Posts

GLOBAL EQUITY MARKETS – December 14, 2019

REVIEW


The benchmark for the Global equity markets performance, the iShares MSCI All Country World Index ETF (ACWI.O) cleared the resistance at 77.5 levels. After a week of short-term volatility and pullback the ETF resumed higher towards its possible rectangle chart pattern price target at 79.6 levels. Both the daily and weekly price charts show a steady uptrend.

Read More

GLOBAL EQUITY MARKETS – November 9, 2019

REVIEW


The benchmark for the Global equity markets performance, the iShares MSCI All Country World Index ETF (ACWI.O) continued higher after breaking out from the 5 month-long rectangle. While the long-term chart pattern can be identified as a H&S continuation and has a much higher price objective the short-term chart pattern is possibly a rectangle and the short-term price target stands at 79.6 levels. This week's price action found resistance at the minor high that stands at 77.5 levels. The ETF might find short-term resistance around 77.5 levels. 74.8 levels will act as support during any pullback.

Read More

GLOBAL EQUITY MARKETS – September 14, 2019

Reminder:

We are continuing our Member webinar series with a review of the most reliable chart patterns Tech Charts Global Equity Markets report featured over the past two years. We will go through numbers on chart pattern reliability. Since May 2017, Global Equity Markets report featured classical chart pattern breakouts. Out of those, most reliable were H&S bottom, rectangle, and descending triangle. We will review under which conditions these chart patterns reached their price objectives. 

Given the current market conditions, the webinar will review some of the important charts that are at inflection points. Global equities can start new medium-term trends and it is important to review some of the charts that could signal the beginning of strength.

Scheduled for: Thursday, September 19th at 8:30 am mountain (register here)

REVIEW


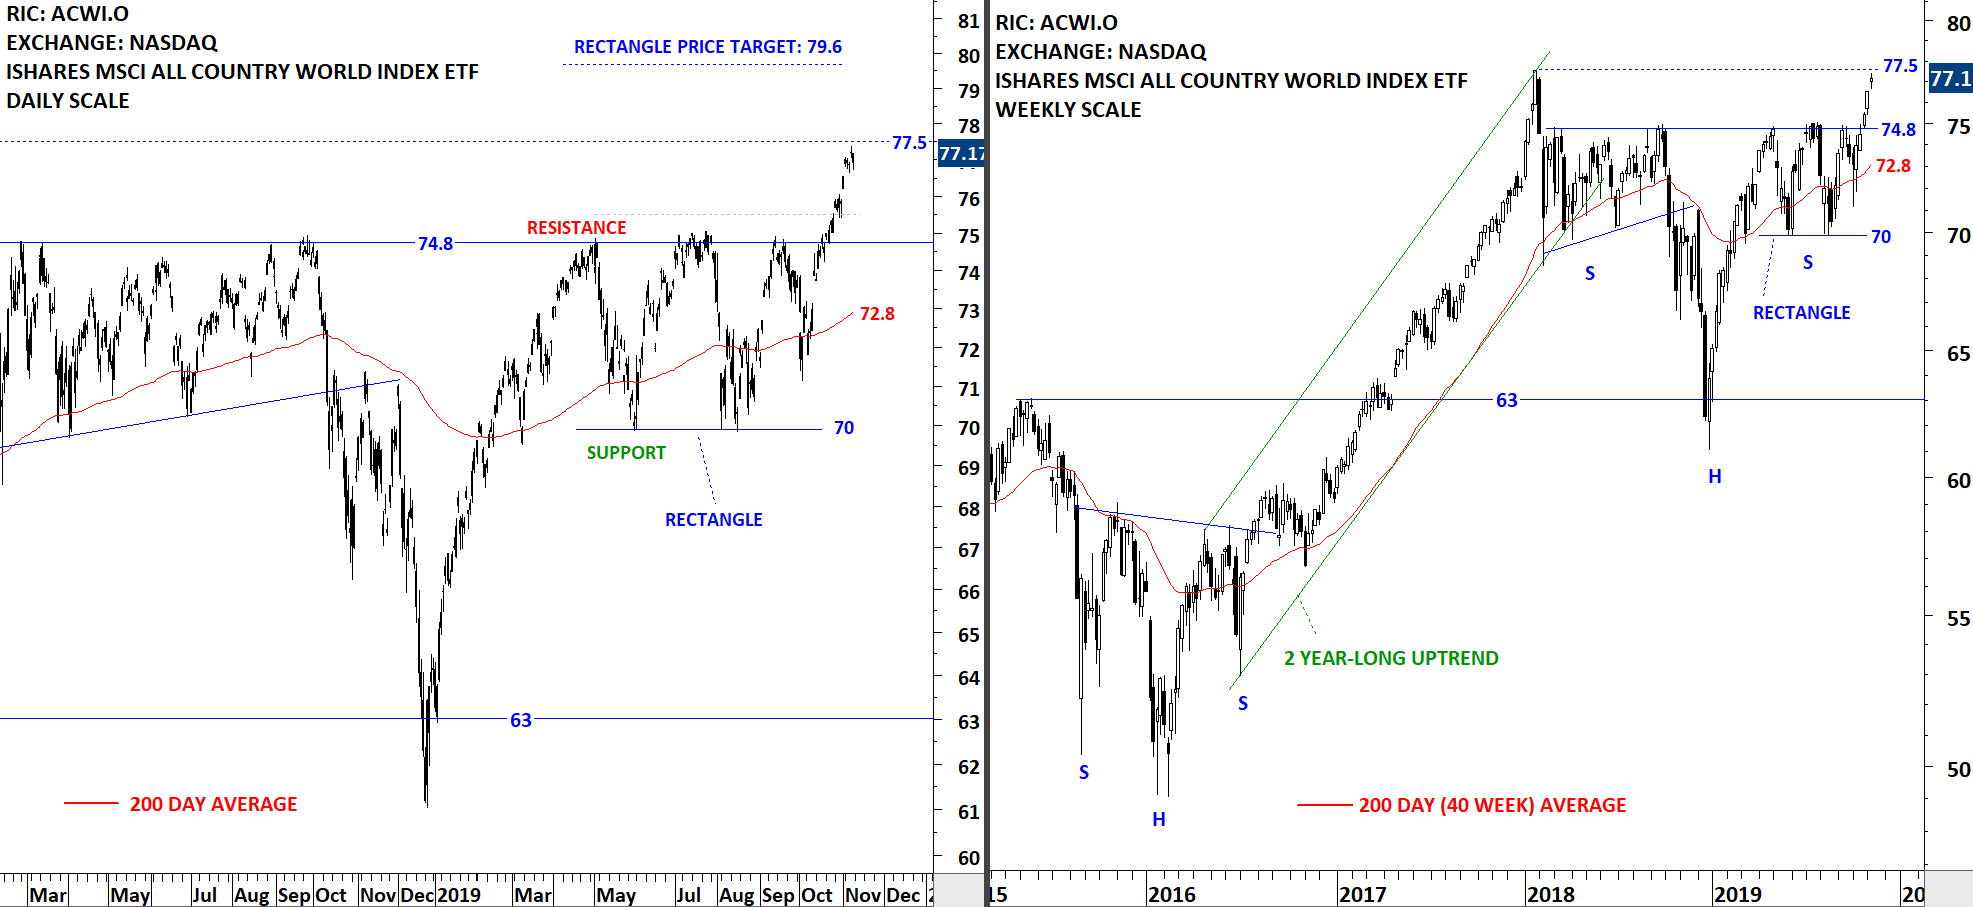
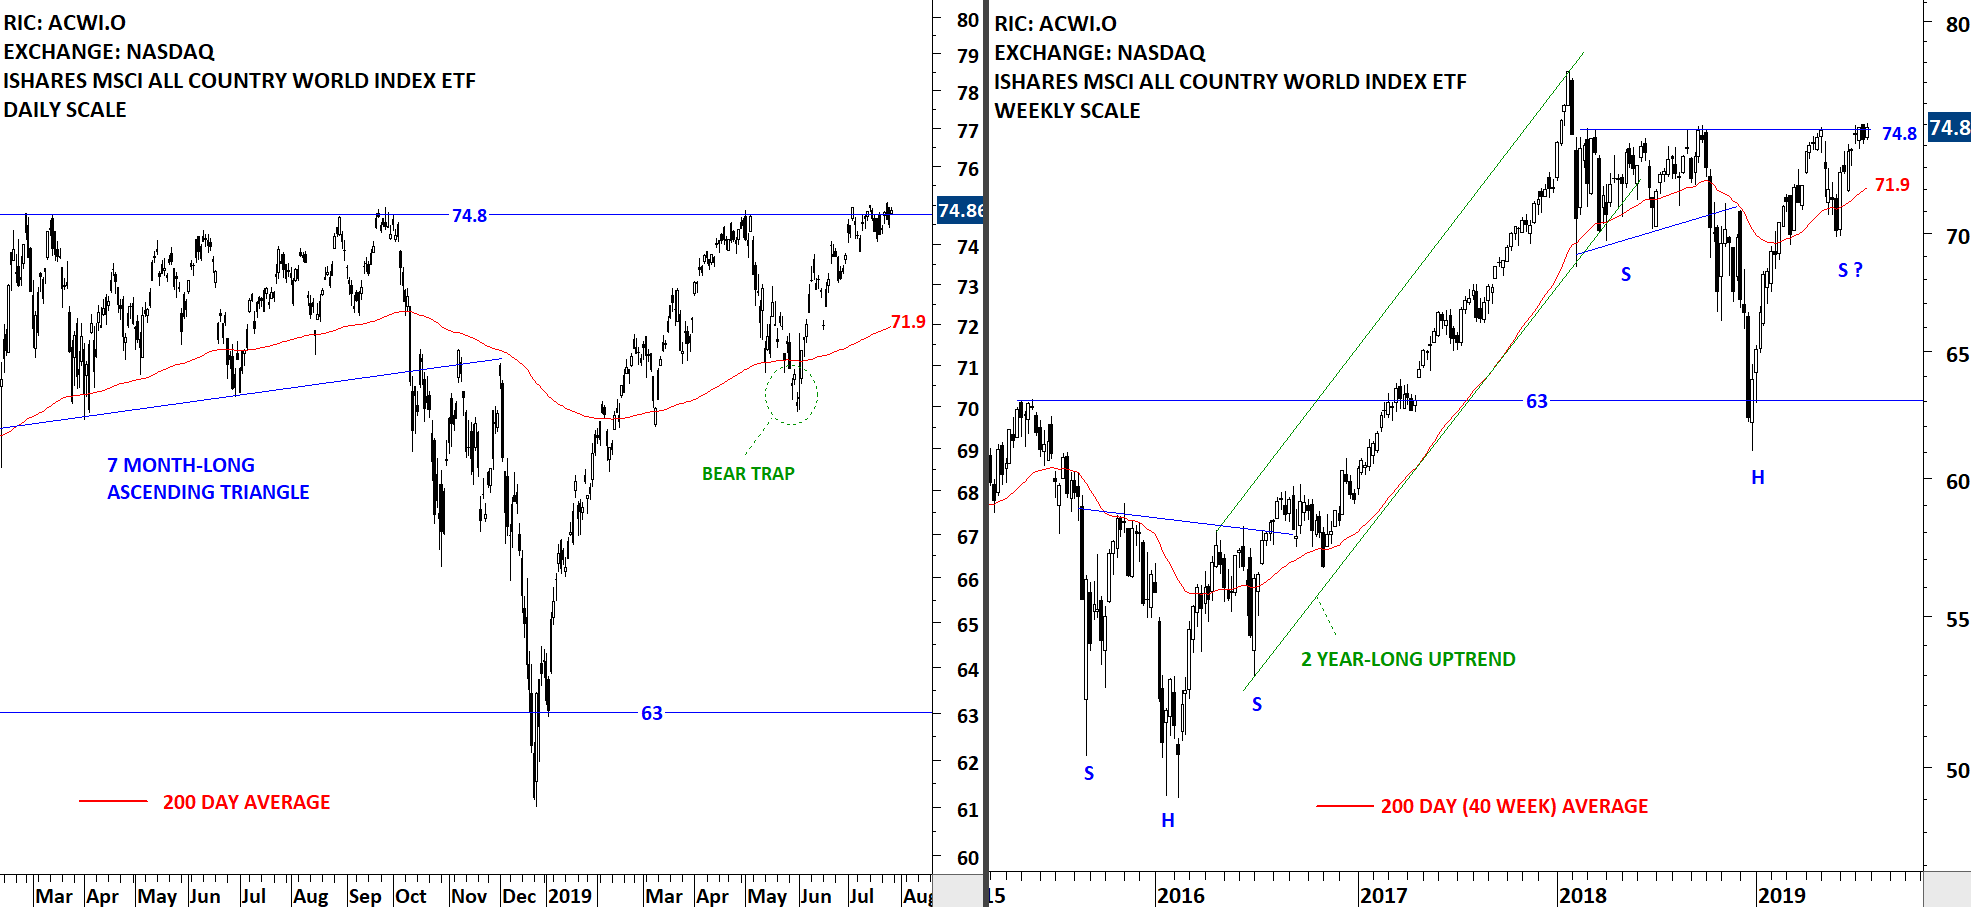
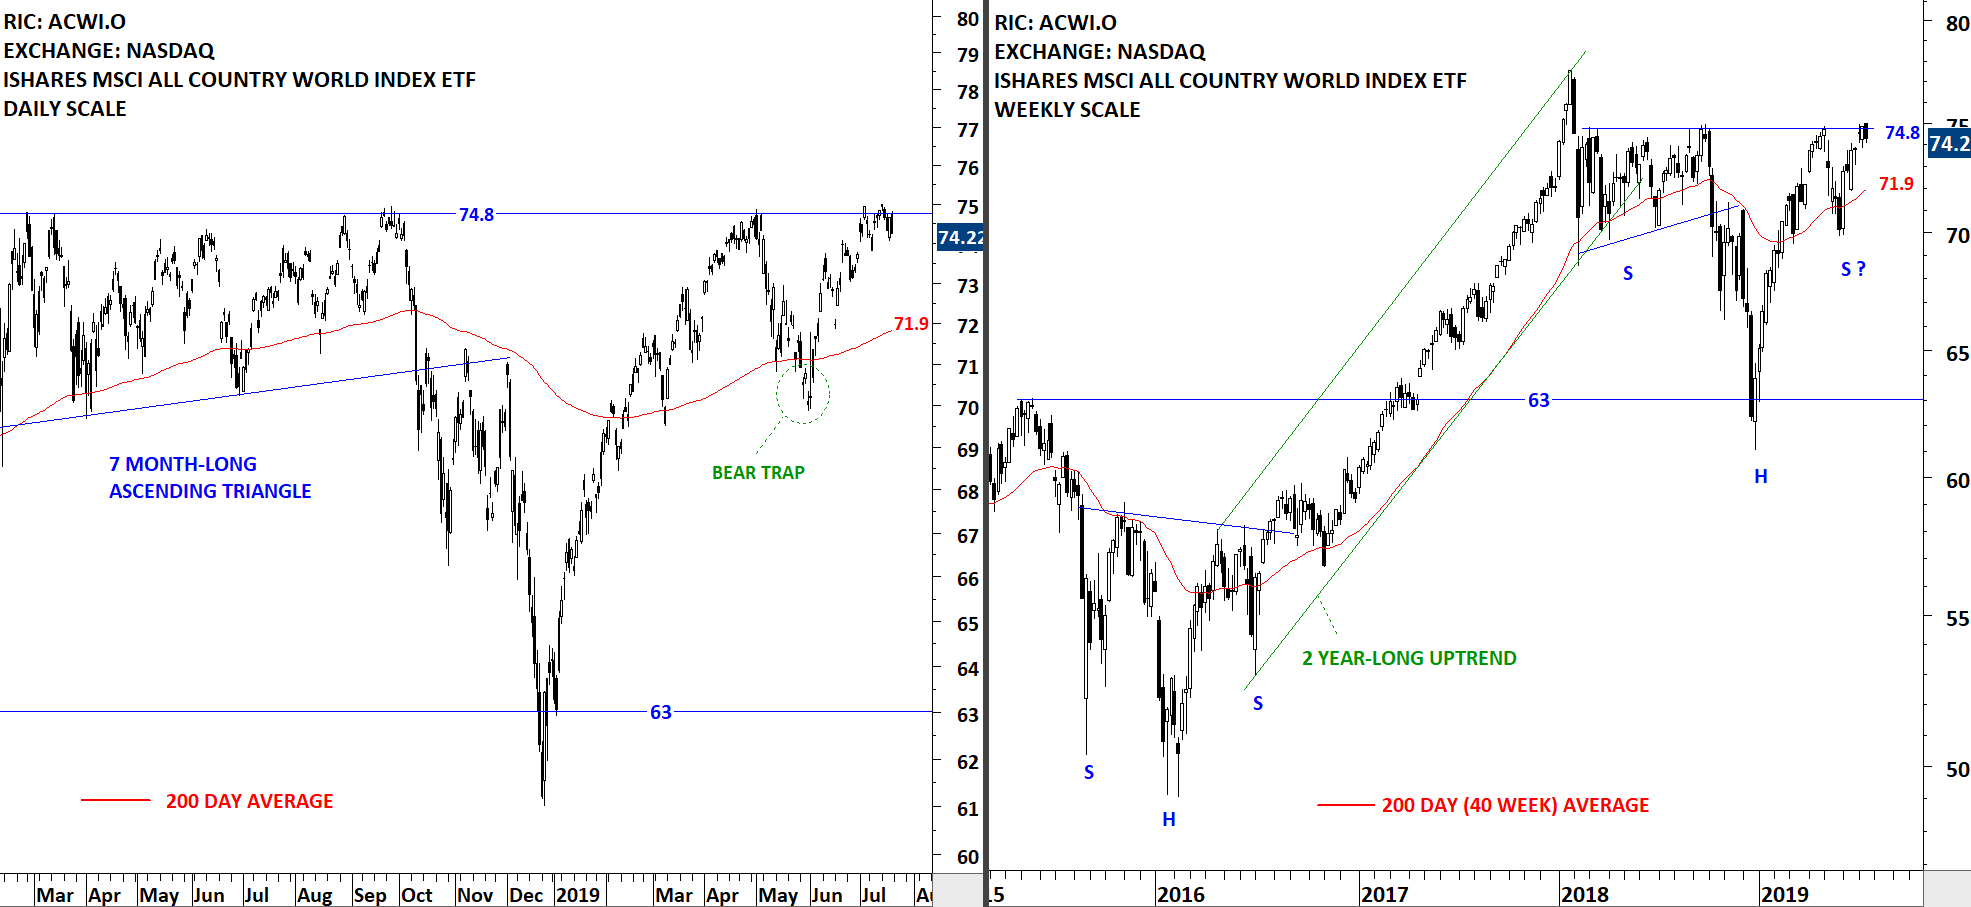
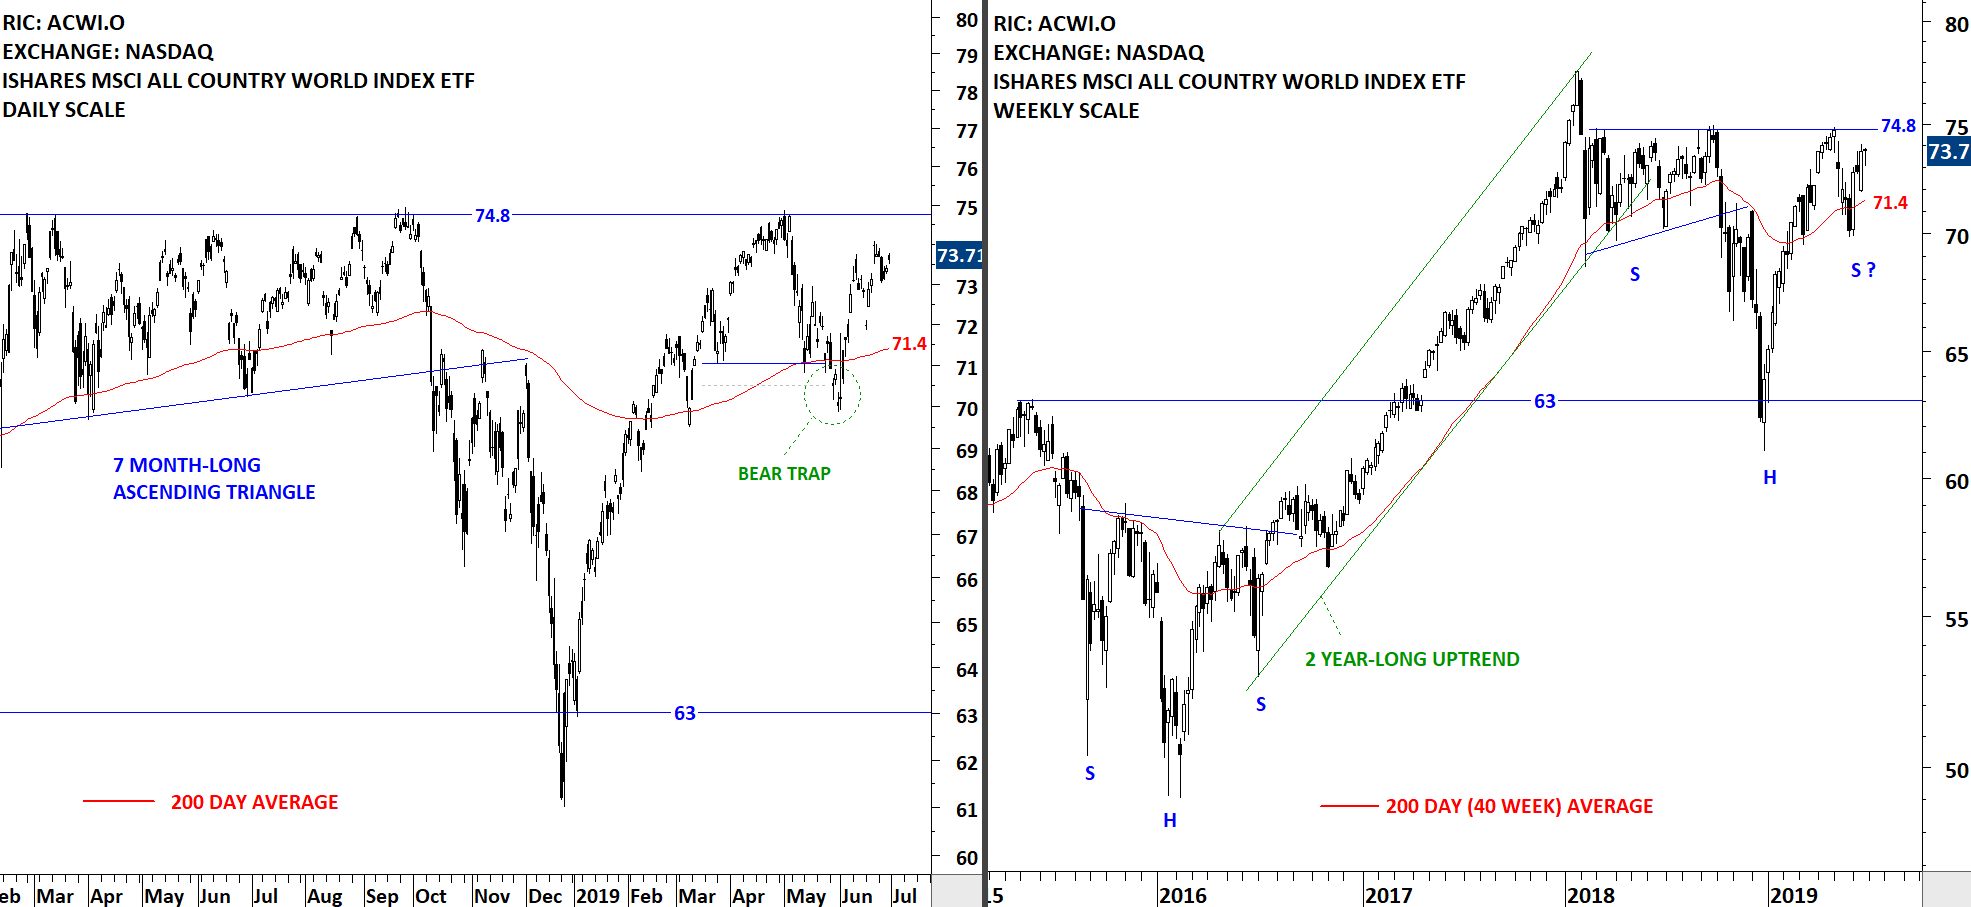
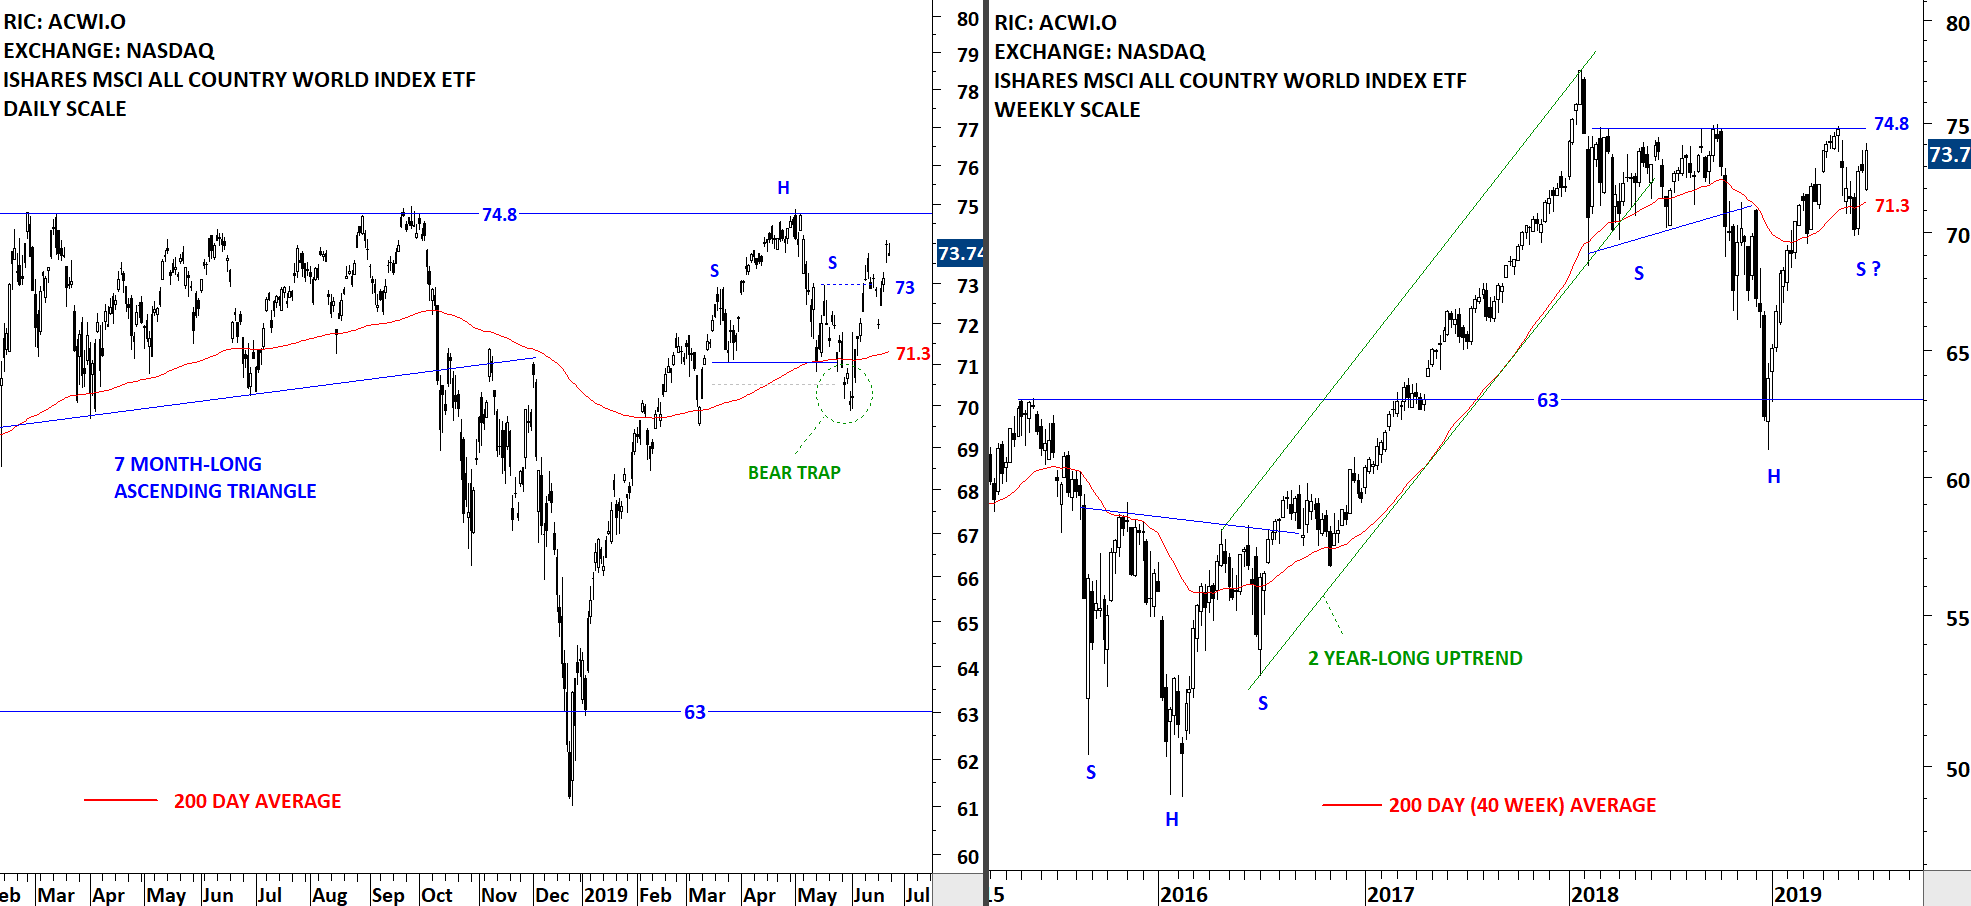
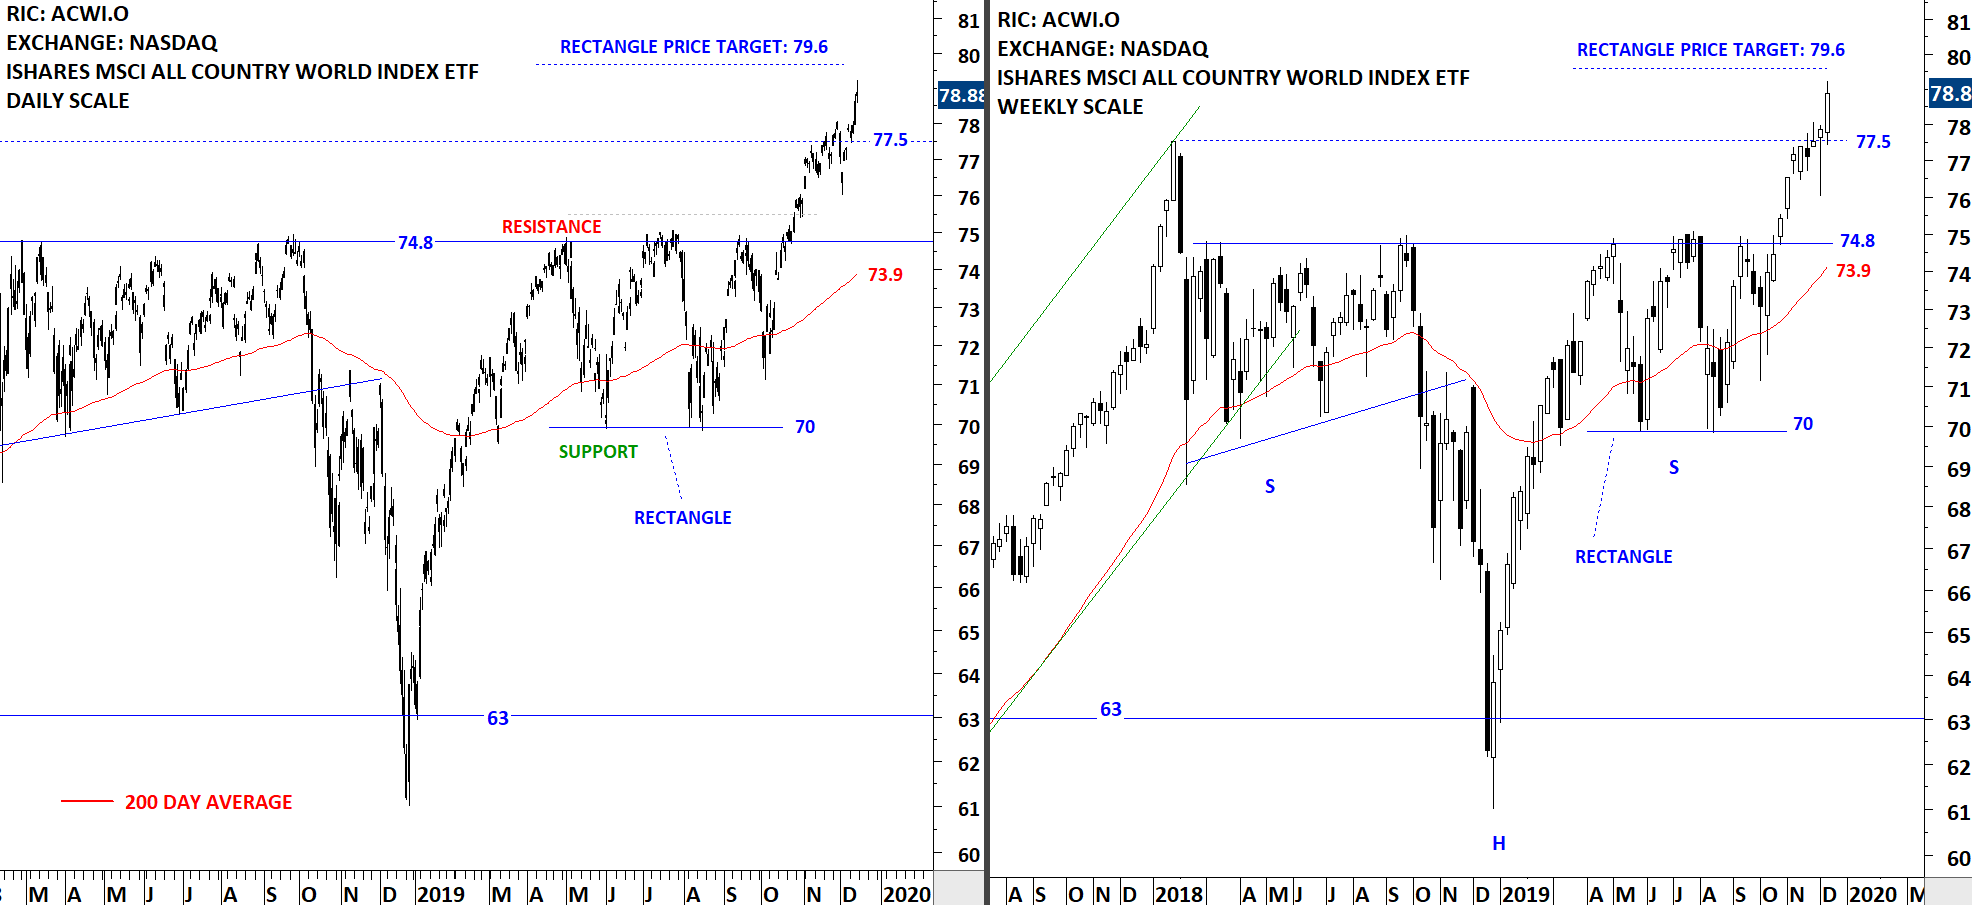
After the minor consolidation between 70 and 72.5 completed on the upside the benchmark for the Global equity markets performance, the iShares MSCI All Country World Index ETF (ACWI.O) reached the upper boundary of the larger scale consolidation at 74.8 levels. A long-term breakout will take place only if the ETF clears the horizontal resistance at 74.8 levels. Larger scale chart pattern can be identified as a H&S continuation. Since April 2019, the ETF is trading between 70 and 74.8 levels. It is important to note that 74.8 acted as a strong resistance since the first quarter of 2018.

Read More

GLOBAL EQUITY MARKETS – September 7, 2019

REVIEW


The minor consolidation between 70 and 72.5 is completed on the upside. The benchmark for the Global equity markets performance, the iShares MSCI All Country World Index ETF (ACWI.O) remains in a wider trading range between 70 and 74.8 levels. A long-term breakout will take place only if the ETF clears the horizontal resistance at 74.8 levels. Larger scale chart pattern can be identified as a H&S continuation.

Read More

GLOBAL EQUITY MARKETS – August 31, 2019

REVIEW


The benchmark for the Global equity markets performance, the iShares MSCI All Country World Index ETF (ACWI.O) formed a short-term consolidation range between 70 and 72.5 levels. The larger scale consolidation is between 70 and 74.8 levels. The boundaries have become well-defined. Breakout above the minor resistance at 72.5 levels can send the ETF towards the resistance at 74.8 levels. Failure at the minor resistance can result in further sideways consolidation between 72.5 and 70 levels. How the ETF resolves from the recent tight consolidation will decide on the last quarter performance for Global equities.

Read More

GLOBAL EQUITY MARKETS – August 17, 2019

REVIEW


The benchmark for the Global equity markets performance, the iShares MSCI All Country World Index ETF (ACWI.O) found support at the minor low at 70 levels. This week's price action was the 3rd test of the support at 70 levels. The ETF is possibly forming a new trading range between 70 and 74.8 levels. Breakdown below 70 levels can confirm the consolidation as a double top and result in further weakness.

Read More

GLOBAL EQUITY MARKETS – July 27, 2019

REVIEW


The benchmark for the Global equity markets performance, the iShares MSCI All Country World Index ETF (ACWI.O) continues to challenge the strong horizontal resistance at 74.8 levels. A breakout can be very positive for Global equities. Failure at the strong resistance can result in a pullback towards the long-term average at 71.9 levels.

Read More

GLOBAL EQUITY MARKETS – July 20, 2019

REVIEW


The benchmark for the Global equity markets performance, the iShares MSCI All Country World Index ETF (ACWI.O) is testing the horizontal resistance at 74.8 levels. Breakout can be positive for Global equities. This week's price action once again challenged the horizontal resistance at 74.8 levels. I'm monitoring ACWI ETF for a possible breakout to all-time highs. The 200-day moving average at 71.9 levels will act as support during any pullback.

Read More

GLOBAL EQUITY MARKETS – June 29, 2019

REVIEW


The benchmark for the Global equity markets performance, the iShares MSCI All Country World Index ETF continues to remain in a range between the horizontal resistance at 74.8 and the 200-day moving average at 71.4 levels. In the previous report I discussed the possibility of a H&S continuation chart pattern with the neckline standing at 74.8 levels. Price can continue to consolidate between the two important technical levels. A breakout above the horizontal resistance will be very positive for Global equities.

Read More

GLOBAL EQUITY MARKETS – June 22, 2019

REVIEW


The benchmark for the Global equity markets performance, the iShares MSCI All Country World Index ETF (ACWI.O) remains above its 200-day average. Strong resistance stands at 74.8 levels and the 200-day moving average as support at 71.3 levels. The weekly scale price chart can form a possible H&S continuation. So far the right shoulder formed symmetry in price but not in time. In other words the time it took for the left shoulder has been longer than the right shoulder. Perfect symmetry is rare. Breakout above 74.8 levels will be positive for Global equities.

Read More