UBS GROUP
Every week Tech Charts Global Equity Markets report features some of the well-defined, mature classical chart patterns under a lengthy watchlist and the chart pattern breakout signals that took place during that week. Global Equity Markets report covers single stocks from developed and emerging markets, ETF’s and global equity indices. The report starts with a review section that highlights the important chart developments on global equity benchmarks. This blog post features one of several great chart analysis that were highlighted in the breakout alerts section from the previous Global Equity Markets report.
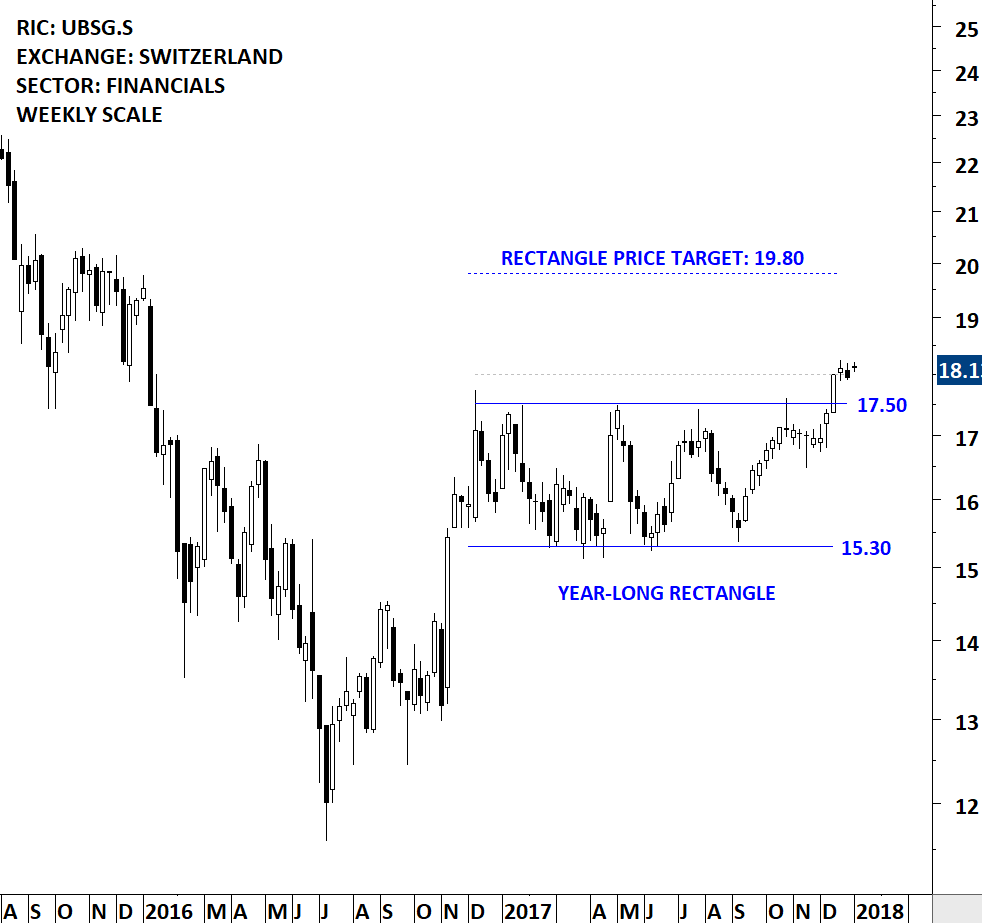
UBS GROUP AG (UBSG.S)
UBS Group AG is a holding company and conducts its operations through UBS AG and its subsidiaries. The Company comprises Corporate Center and five business divisions: Wealth Management, Wealth Management Americas, Personal & Corporate Banking, Asset Management and the Investment Bank. The stock is listed on the Swiss Stock Exchange. Price chart formed a year-long rectangle with the strong horizontal boundary acting as resistance at 17.50 levels. The upper boundary of the rectangle was tested several times over the course of the chart pattern. The daily close above 18 levels confirmed the breakout from the bullish continuation chart pattern with the possible price target of 19.80.
Sample educational video on Rectangle bullish continuation
Tech Charts members have access to a wide range of educational videos on classical chart patterns. Fine points of each classical chart pattern is explained in detail in these videos. Below you can find a sample educational video on Rectangle as bullish continuation. These videos will help you in identifying similar chart setups, calculating price targets and recognizing breakout confirmations.
Tech Charts Membership

By becoming a Premium Member, you’ll be able to improve your knowledge of the principles of classical charting.
With this knowledge, you can merge them with your investing system. In fact, some investors use my analyses to modify their existing style to invest more efficiently and successfully.

As a Premium Member of Aksel Kibar’s Tech Charts,
You will receive:
-
Global Equities Report. Delivered weekly.
-
Classical charting principles. Learn patterns and setups.
-
Actionable information. Worldwide indices and stocks of interest.
-
Risk management advice. The important trading points of each chart.
-
Information on breakout opportunities. Identify the ones you want to take action on.
-
Video tutorials. How patterns form and why they succeed or fail.
-
Watch list alerts. As they become available so you can act quickly.
-
Breakout alerts. Usually once a week.
-
Access to everything (now and as it becomes available)o Reports
o Videos and video series -
Multi-part webinar course. You learn the 8 most common charting principles.
-
Webinars. Actionable and timely advice on breaking out chart patterns.
For your convenience your membership auto renews each year.


