ISHARES MSCI PHILIPPINES ETF
Every week Tech Charts Global Equity Markets report features some of the well-defined, mature classical chart patterns under a lengthy watchlist and the chart pattern breakout signals that took place during that week. Global Equity Markets report covers single stocks from developed and emerging markets, ETF’s and global equity indices. The report starts with a review section that highlights the important chart developments on global equity benchmarks. This blog post features one of several great chart analysis that were highlighted in the review section from the latest Global Equity Markets report.
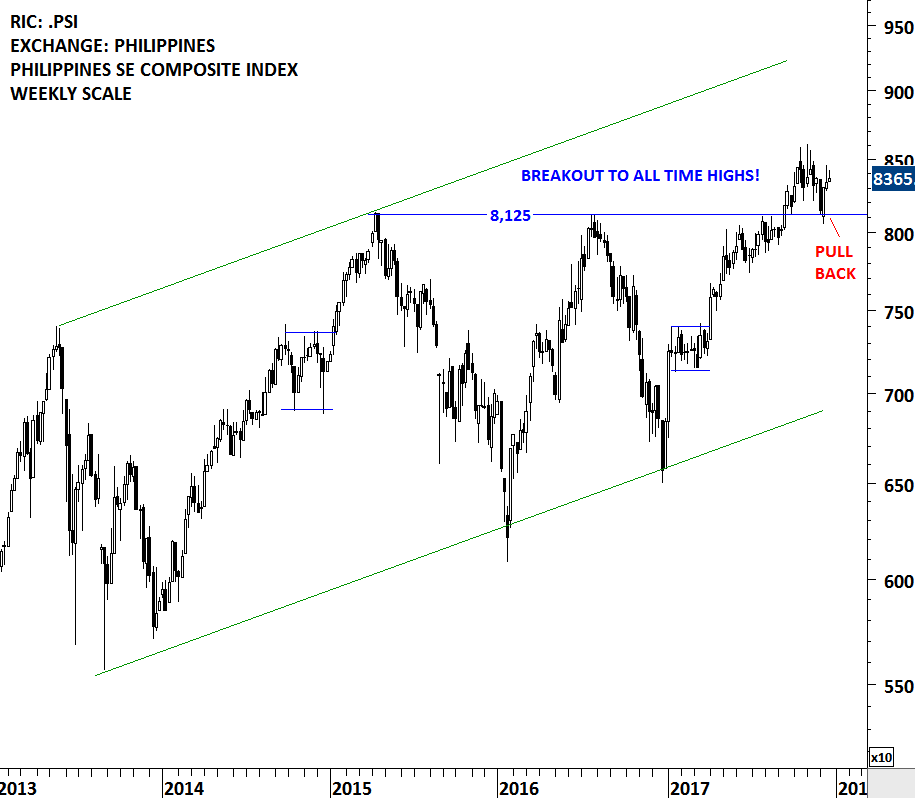
Equity indices of the South East Asia Emerging Markets are showing strength. The Philippines Stock Exchange index cleared its 2 year-long horizontal resistance at 8,125 levels and reached all-time highs. Since then, the index pulled back to the broken resistance which is now acting as a strong support. As long as 8,125 level holds, we can expect the Philippine equity market to remain strong and trend higher.
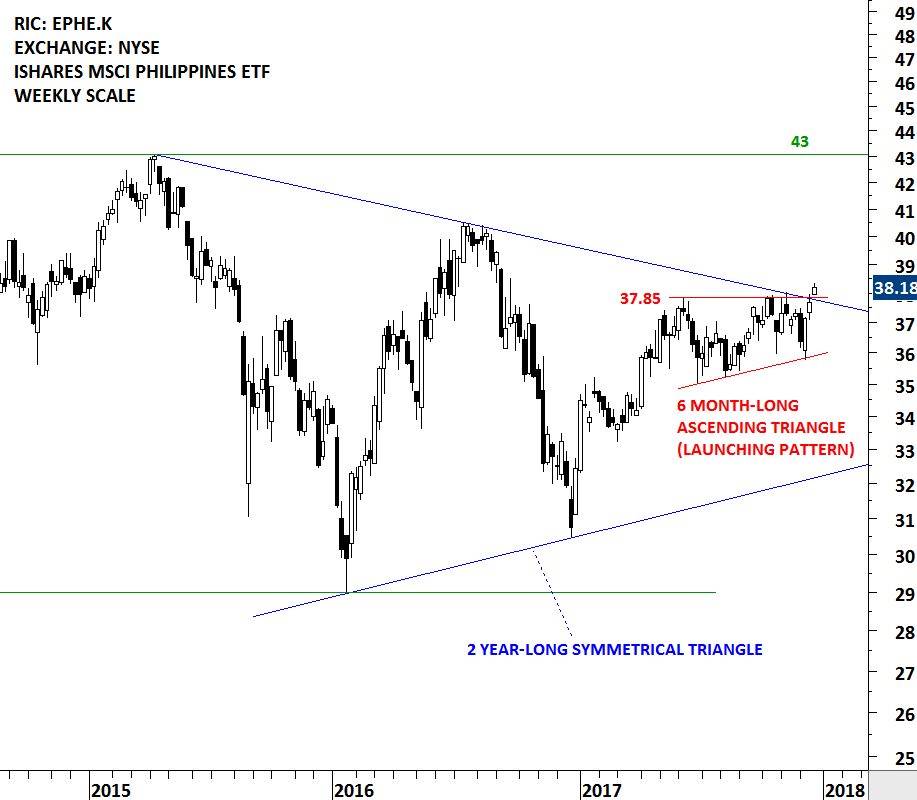
More interesting than the local equity benchmark is the iShares MSCI Philippines ETF (EPHE.K). Unlike the horizontal resistance on the local equity benchmark, the iShares MSCI Philippines ETF has a 2 year-long downward sloping trend resistance. Over the past 6 months, the ETF formed a possible bullish ascending triangle chart pattern. The upper boundary of the continuation chart pattern is overlapping with the 2 year-long trend resistance. A breakout above the upper boundary of the ascending triangle at 37.85 will also clear the trend line resistance. Strength on the Philippines Stock Index can result in a breakout on the iShares MSCI Philippines ETF (EPHE.K).
Tech Charts Membership

By becoming a Premium Member, you’ll be able to improve your knowledge of the principles of classical charting.
With this knowledge, you can merge them with your investing system. In fact, some investors use my analyses to modify their existing style to invest more efficiently and successfully.

As a Premium Member of Aksel Kibar’s Tech Charts,
You will receive:
-
Global Equities Report. Delivered weekly.
-
Classical charting principles. Learn patterns and setups.
-
Actionable information. Worldwide indices and stocks of interest.
-
Risk management advice. The important trading points of each chart.
-
Information on breakout opportunities. Identify the ones you want to take action on.
-
Video tutorials. How patterns form and why they succeed or fail.
-
Watch list alerts. As they become available so you can act quickly.
-
Breakout alerts. Usually once a week.
-
Access to everything (now and as it becomes available)o Reports
o Videos and video series -
Multi-part webinar course. You learn the 8 most common charting principles.
-
Webinars. Actionable and timely advice on breaking out chart patterns.
For your convenience your membership auto renews each year.


