GLOBAL EQUITY MARKETS – December 23, 2017

REVIEW


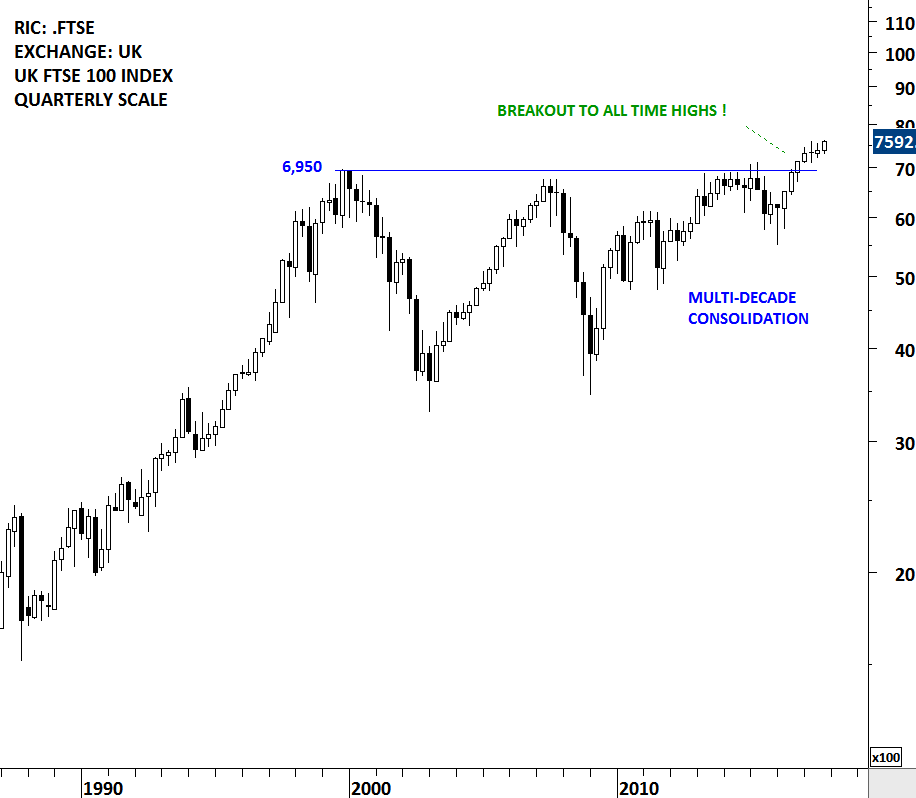
Over the past few weeks I reviewed the UK FTSE 100 index. I believe it is one of the most important long-term opportunity for global equity investors. There are couple of technical developments that I really like about the UK FTSE 100 index chart. First one is that the index cleared its multi-decade long horizontal resistance and reached all-time highs. Stocks or indices that clear long-term resistances and reach all-time highs enter “uncharted territory”. Uncharted territory is the path of least resistance. In other words there is no previous price level that the index would find resistance.

Read more

Rectangle Chart Patterns – December 2017 Tech Charts Webinar

Rectangle Chart Patterns – December 2017 Tech Charts Webinar 

  • Rectangle is a reliable chart pattern with horizontal boundaries.
  • Breakouts from chart patterns with horizontal boundaries are more reliable when compared with breakouts from diagonal boundaries
  • 5 important technical points when identifying rectangle chart patterns
  • Importance of several tests of chart pattern boundary before a breakout takes place
  • The broader context of price action and where the rectangle chart pattern forms
  • Rectangle as a launching pattern
  • Long-term chart patterns will launch strong uptrends
  • Breakout above more than one technical resistance is significant
  • Review of all rectangle chart pattern breakouts between May 2017 and December 2017
  • Developing rectangle chart patterns; a review of watchlist candidates
  • Member charts, analysis of Tech Charts members charts
  • Q&A

Live questions from Members  

  1.  Any thoughts on gold? 48:01
  2. Comments on general questions from members 48:59
  3. What charting platform do you use or recommend for Canada? 51:07
  4. Profit target / exit strategy: any views on the most profitable as 1/ exit 2/ half exit, half keep in trade 3/ trailing stop? 52:22
  5. Broker to trade international stock from Canada? 53:48 (Member reply 58:30)
  6. Could you please explain how you proceed to look at a chart? For a beginner, it’s often we don’t know where to start when looking at a chart. 54:02
  7. Do you use any indicators to support the breakout or avoid fake breakouts like rsi macd etc? 57:20
  8. I am using CMC Markets which is a free platform. How does this compare with Metastock? 58:54
  9. Would you consider an initial trade at the lower boundary of a rect. after it has been tested 3-4 times and held? 1:00:18
  10. Re entry on a pattern failure, are there any parameters you have? 1:01:36
  11. Can you discuss how you calculate the Negation Point? Do you still keep the stock that triggers the Negation Levels / Point in your watch list? 1:01:36
  12. What do you think is the success rate of the weekly rectangle in % (like 60 or 70%)? 1:04:34
  13. Do you keep statistic of triggered breakouts that failed vs successful ones that you posted in a member section? I mean a ratio between them. 1:06:25
  14. Could you talk a little on the Bitcoin chart. 1:07:39

Recorded live 12.14.2017

Read more

INTERIM UPDATE – December 21, 2017

Vale S.A. is a global producer of iron ore and iron ore pellets, key raw materials for steelmaking, and producer of nickel. The Company also produces copper, metallurgical and thermal coal, potash, phosphates and other fertilizer nutrients, manganese ore, ferroalloys, platinum group metals, gold, silver and cobalt. The stock is listed on the Sao Paulo Stock Exchange. It is also listed on the New York Stock Exchange via depository receipts. This interim update features both the Sao Paulo Stock Exchange and NYSE listing.

Read more

ISHARES MSCI PHILIPPINES ETF

Every week Tech Charts Global Equity Markets report features some of the well-defined, mature classical chart patterns under a lengthy watchlist and the chart pattern breakout signals that took place during that week. Global Equity Markets report covers single stocks from developed and emerging markets, ETF’s and global equity indices. The report starts with a review section that highlights the important chart developments on global equity benchmarks. This blog post features one of several great chart analysis that were highlighted in the review section from the latest Global Equity Markets report.

Equity indices of the South East Asia Emerging Markets are showing strength. The Philippines Stock Exchange index cleared its 2 year-long horizontal resistance at 8,125 levels and reached all-time highs. Since then, the index pulled back to the broken resistance which is now acting as a strong support. As long as 8,125 level holds, we can expect the Philippine equity market to remain strong and trend higher.

Read more

GLOBAL EQUITY MARKETS – December 16, 2017

REVIEW


Global Equity Markets continue to remain in a steady uptrend with the iShares MSCI All Country World Index ETF trending higher in a year-long trend channel. The ETF is also holding above the steep 19 month-long trend line. At this point, there is no clear chart pattern that would suggest a top reversal. Uptrend is intact with the minor support standing at 69.4 levels.

Read more

EURO STOXX BANKS PRICE INDEX

During established up trends pullback to the long-term averages are considered to be low risk entry points. A widely followed trend indicator is the 200 day moving average. Price action above the 200 day moving average is recognized as an uptrend, while price trading below the 200 day (40 week) average is considered to be a downtrend. In the last quarter of 2016, the Euro Stoxx Banking index breached its long-term average on the upside what was considered to be the beginning of a possible uptrend. Since then, each pullback found support at the long-term moving average, confirming the steady uptrend. Over the past 6 months, the Euro Stoxx Banking index formed a sideways consolidation that can be identified as a symmetrical triangle.  Read more

GLOBAL EQUITY MARKETS – December 9, 2017

REVIEW


After breaking out to all-time highs in the beginning of 2017, UK FTSE 100 Index is still looking for direction as the last several-months price action formed a possible bullish continuation chart pattern. 7 month-long sideways consolidation can be identified as a possible ascending triangle with the lower boundary acting as support at 7,300 and the upper boundary as resistance at 7,600 levels. The upward sloping lower boundary and the horizontal upper boundary gives the chart pattern its bullish bias, suggesting buyers are able to bid the price higher at every pullback. Latest correction not only found support at the lower boundary of the possible ascending triangle but also at the long-term 200 day (40 week) moving average. If the support at 7,300 level holds, we can expect a rebound towards 7,600 levels.

Read more

Live Webinar and Q&A with Aksel – Thursday, December 14, 11am mountain

Dear Tech Charts Members,

(Register below)

As you all know one of my favorite chart patterns is a rectangle. A rectangle is a chart pattern with horizontal boundaries. I prefer breakouts from chart patterns with horizontal boundaries when compared with breakouts from diagonal chart patterns. Over the past couple of months the Global Equity Markets report has featured great chart setups that I identified as well-defined rectangles.

The upcoming webinar is dedicated to a thorough discussion on this highly reliable chart pattern.

  • We will review some of those chart pattern breakouts that were featured in the Global Equity Markets report.
  • We will look at some of the developing chart pattern breakout opportunities.
  • Most important in this webinar we will highlight Tech Charts members favorite rectangle setups in different equity markets. I would like to discuss and share some of the best classical chart patterns that members identified or those charts that members might have questions about.
  • As usual we will have a member Q&A at the end of the webinar.

Read more

NYSE ARCA GOLD BUGS INDEX

Every week Tech Charts Global Equity Markets report features some of the well-defined, mature classical chart patterns under a lengthy watchlist and the chart pattern breakout signals that took place during that week. Global Equity Markets report covers single stocks from developed and emerging markets, ETF’s and global equity indices. The report starts with a review section that highlights the important chart developments on global equity benchmarks. This blog post features one of several great chart analysis from the latest Global Equity Markets report.

The XAU is a capitalization-weighted index of thirty precious metal mining companies that has been traded on the Philadelphia Stock Exchange since 1983. As its name suggests it includes both gold and silver mining companies. In order to track gold and silver mining companies performance in an index there are several options available for investors, but the two most watched indices are: the NYSE Arca Gold BUGS (Basket of Unhedged Gold Stocks) Index (called the HUI Index) and Philadelphia Gold and Silver Index (called the XAU Index). Below charts feature the Philadelphia Gold and Silver Index and the NYSE Arca Gold BUGS Index.

Read more

GLOBAL EQUITY MARKETS – December 2, 2017

REVIEW


The XAU is a capitalization-weighted index of thirty precious metal mining companies that has been traded on the Philadelphia Stock Exchange since 1983. As its name suggests it includes both gold and silver mining companies. In order to track gold and silver mining companies performance in an index there are several options available for investors, but the two most watched indices are: the NYSE Arca Gold BUGS (Basket of Unhedged Gold Stocks) Index (called the HUI Index) and Philadelphia Gold and Silver Index (called the XAU Index). Below charts feature the Philadelphia Gold and Silver Index and the NYSE Arca Gold BUGS Index.

Read more