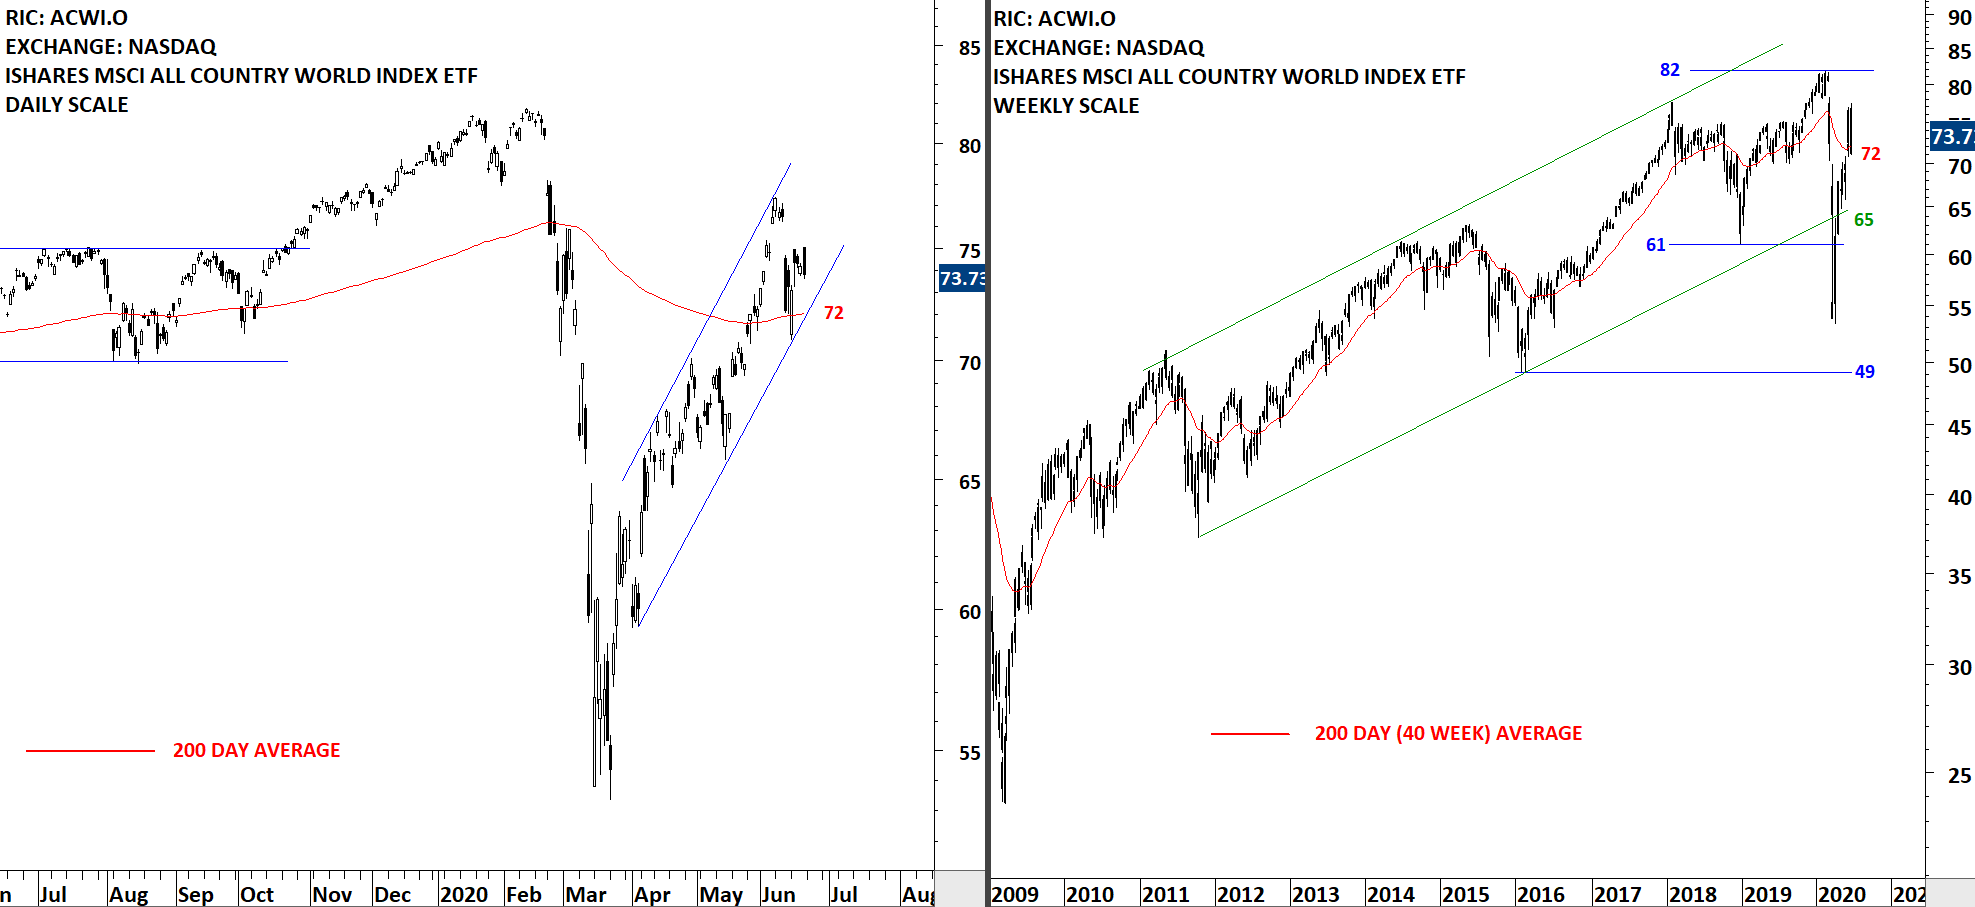
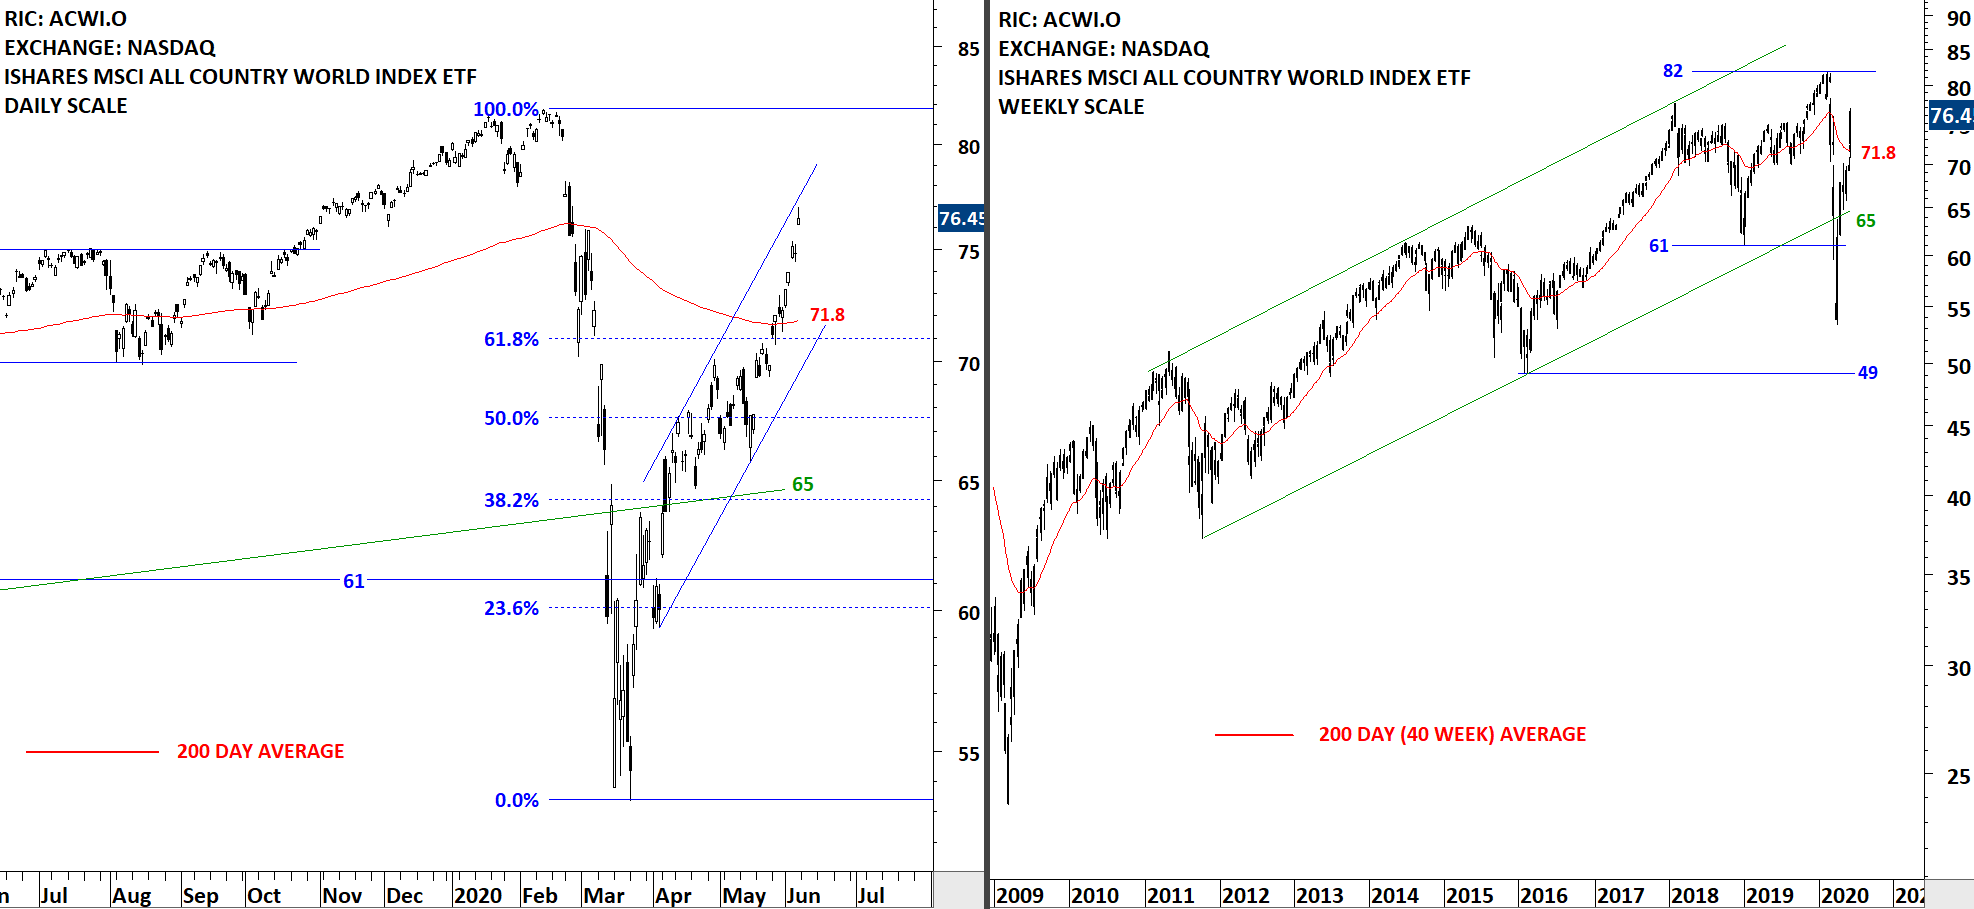
The benchmark for the Global equity markets performance, the iShares MSCI All Country World Index ETF (ACWI.O) pulled back to its 200-day moving average that was acting as support at 72 levels. Last two month’s price action can be identified as a rising channel. Price can remain inside the trend channel. Both the lower boundary of the trend channel and the 200-day average are forming support around the same area. For bullish interpretation to remain intact, price should stabilize above the 200-day average.
Every week Tech Charts Global Equity Markets report features some of the well-defined, mature classical chart patterns under a lengthy watchlist and the chart pattern breakout signals that took place during that week. Global Equity Markets report covers single stocks from developed, emerging and frontier markets, ETF’s and global equity indices. The report starts with a review section that highlights the important chart developments on global equity benchmarks. This blog post features from the watchlist section a rectangle chart pattern that is listed on the Milan Stock Exchange.
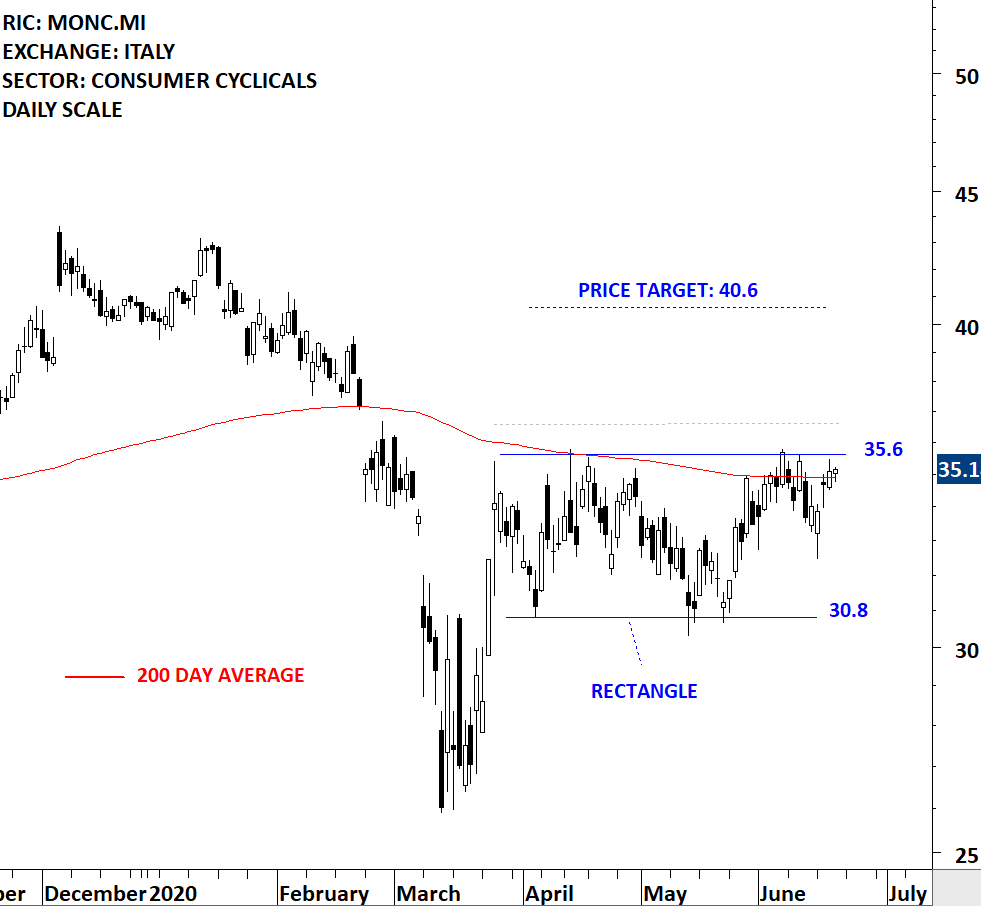
MONCLER SPA (MONC.MI)
Moncler SpA is an Italy-based company engaged in fashion industry. The Company designs, produces and distributes clothing and accessories through Moncler brand. The stock is listed on the Milan Stock Exchange. Over the past 3 months the stock formed a short-term consolidation between 30.8 and 35.6 levels. The short-term consolidation can be identified as rectangle. A daily close above 36.6 levels will confirm the breakout with the possible chart pattern price target of 40.6 levels. Breakout from the rectangle can also clear the 200-day average which is acting as resistance at the same level. I’ve adjusted the upper boundary of the rectangle to 35.6 levels to better reflect the boundaries of the consolidation range. (Data as of June 18, 2020 CET 10:30 AM) (Learn more: Video Tutorial)
Tech Charts Membership
By becoming a Premium Member, you’ll be able to improve your knowledge of the principles of classical charting.
With this knowledge, you can merge them with your investing system. In fact, some investors use my analyses to modify their existing style to invest more efficiently and successfully.
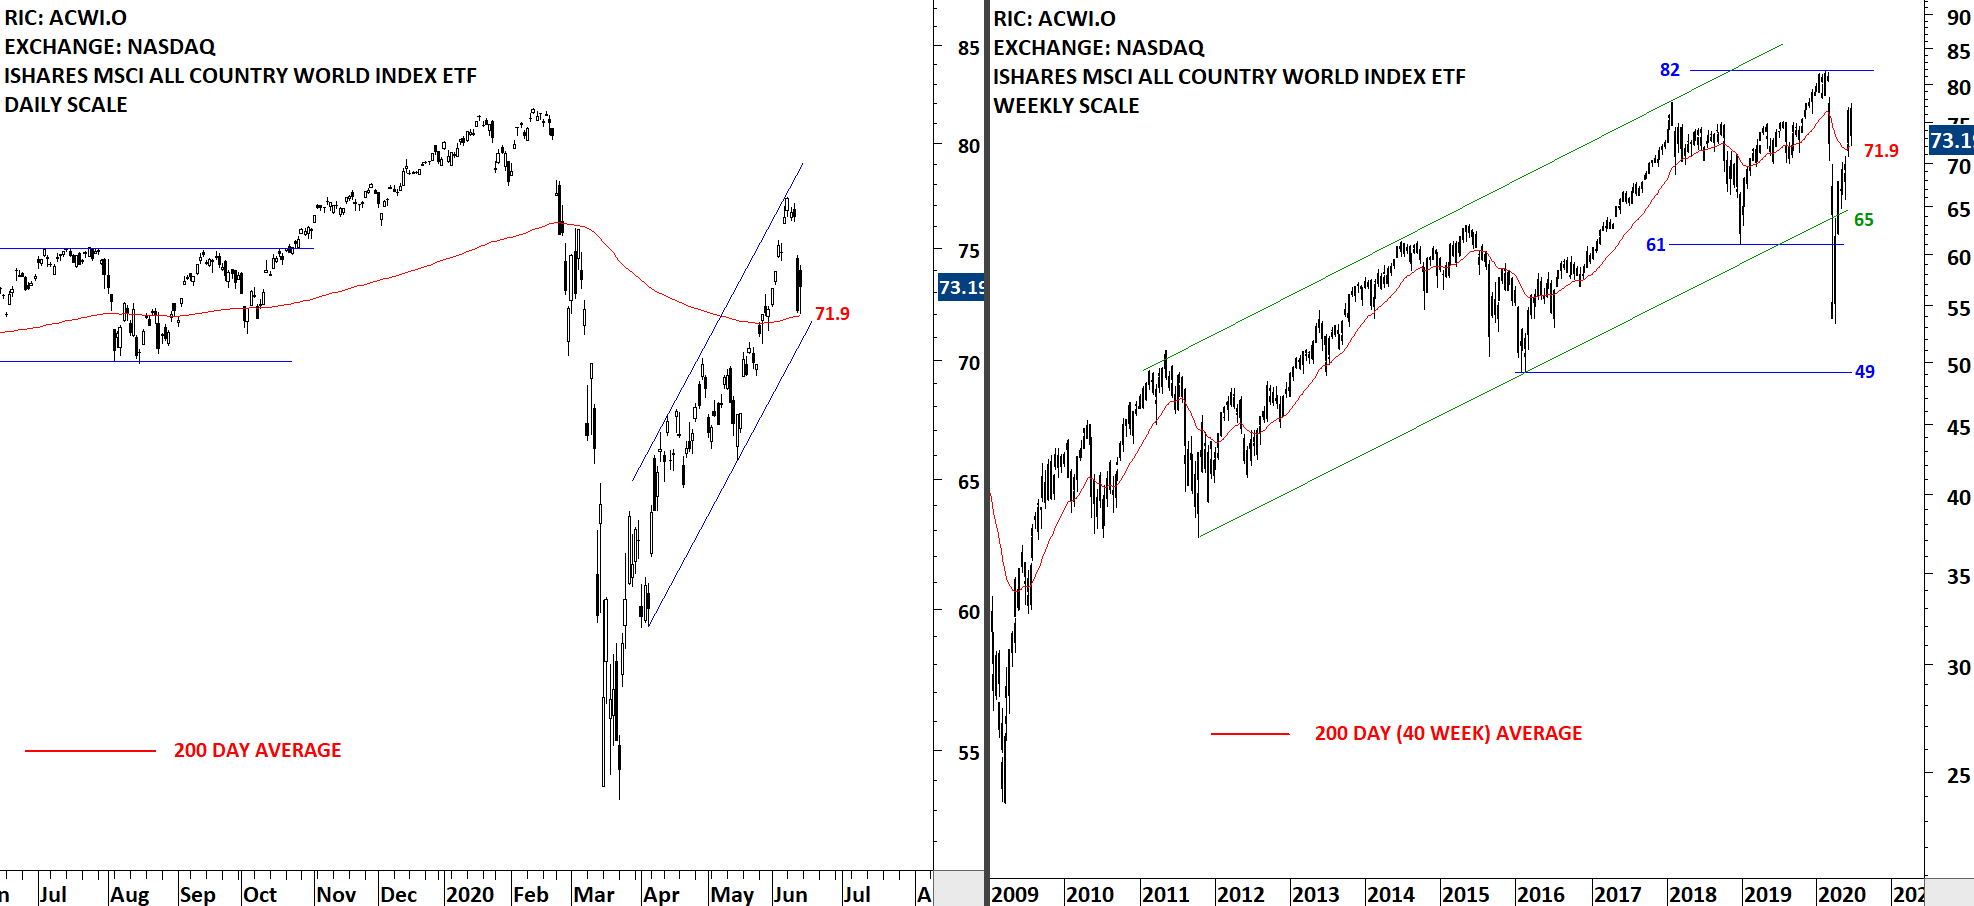
The benchmark for the Global equity markets performance, the iShares MSCI All Country World Index ETF (ACWI.O) pulled back to its 200-day moving average that was acting as support at 71.9 levels. Last two month’s price action can be identified as a rising channel. Price can remain inside the trend channel. The acceleration on the upside took a parabolic shape in the short-term. Parabolic price actions are not sustainable. Both the lower boundary of the trend channel and the 200-day average are forming support around the same area. For bullish interpretation to remain intact, price should stabilize above the 200-day average.
I start my research on Mondays and finalize by end of day Thursday. Friday is dedicated to putting all ideas to the report format. During the week I come across good setups and those are featured in the weekly report. However, there are those that pop during the week and is worth bringing to your attention before the week finalizes. Below is one latest additions to Tech Charts watchlist that may experience breakout. This chart will also be included in the weekly update.
I start my research on Mondays and finalize by end of day Thursday. Friday is dedicated to putting all ideas to the report format. During the week I come across good setups and those are featured in the weekly report. However, there are those that pop during the week and is worth bringing to your attention before the week finalizes. Below are 2 additions to Tech Charts watchlist that may experience breakouts. These charts will also be included in the weekly update.
Every week Tech Charts Global Equity Markets report features some of the well-defined, mature classical chart patterns under a lengthy watchlist and the chart pattern breakout signals that took place during that week. Global Equity Markets report covers single stocks from developed, emerging and frontier markets, ETF’s and global equity indices. The report starts with a review section that highlights the important chart developments on global equity benchmarks. This blog post features from the watchlist section a cup & handle continuation chart pattern listed on the Nasdaq Stock Exchange.
Also you will find below a short educational video on how to identify a cup & handle continuation chart pattern, how to measure price objective and what to expect following the breakout.
If you are interested to learn more about classical charting principles and fine points on how to trade those breakout opportunities, our annual special discount is still ongoing and finalizing today (June 10th). You can get access to everything on Tech Charts website for $29 for 3 months (special discounted price is valid for the first 3 months only). More than 35 educational videos, each with 5-10 min of important points to look for on a classical chart pattern.
Here is the link for special 3rd anniversary discount >> GET ACCESS NOW
MOMENTA PHARMACEUTICALS INC (MNTA.OQ)
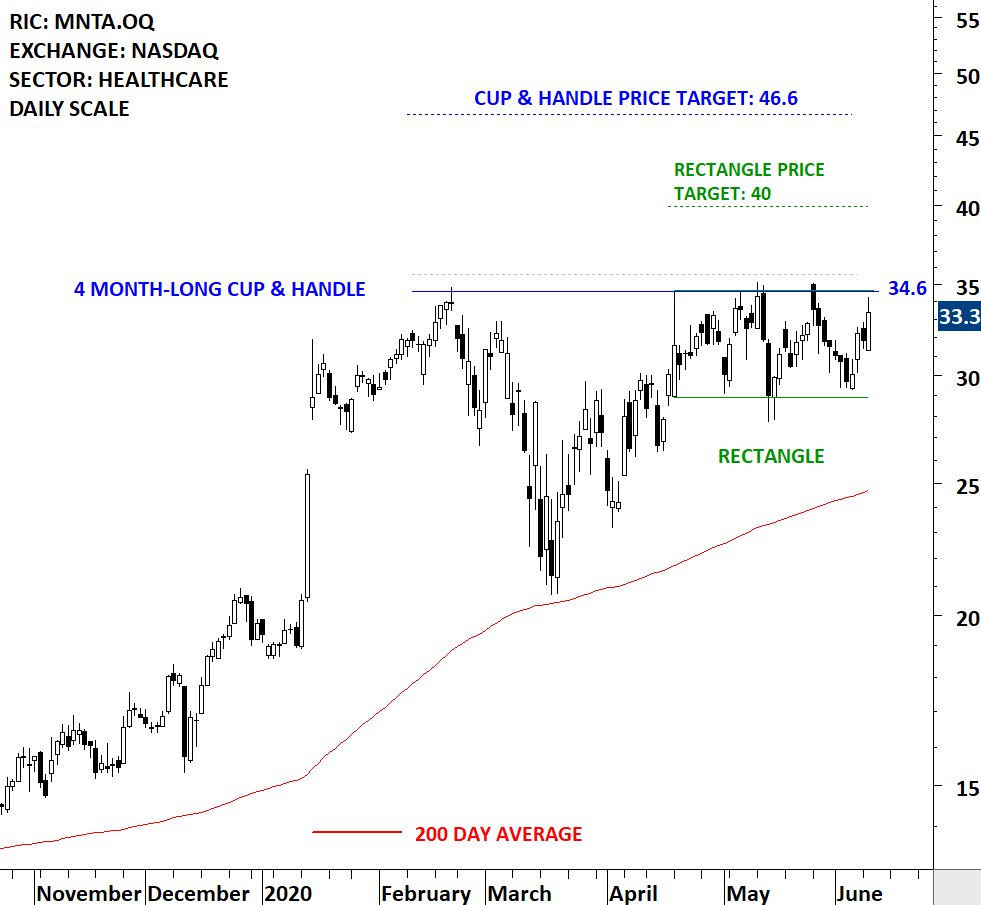
Momenta Pharmaceuticals, Inc. is a biotechnology company. The Company is focused on developing generic versions of drugs, biosimilars and therapeutics for oncology and autoimmune disease. The stock is listed on the Nasdaq Stock Exchange. Price chart formed a 4 month-long cup & handle continuation with the horizontal boundary acting as strong resistance at 34.60 levels. The horizontal boundary was tested several times over the course of the chart pattern. A daily close above 35.60 levels will confirm the breakout from the 4 month-long cup & handle continuation with the possible chart pattern price target of 46.60 levels. The handle part of the chart pattern can be identified as a rectangle with the possible chart pattern price target of 40 levels. (Data as of June 9, 2020)
CUP & HANDLE CONTINUATION CHART PATTERN
Tech Charts Membership
By becoming a Premium Member, you’ll be able to improve your knowledge of the principles of classical charting.
With this knowledge, you can merge them with your investing system. In fact, some investors use my analyses to modify their existing style to invest more efficiently and successfully.
The benchmark for the Global equity markets performance, the iShares MSCI All Country World Index ETF (ACWI.O) cleared its 200-day moving average that was acting as resistance at 71.8 levels. Last two month’s price action can be identified as a rising channel. Price can remain inside the trend channel. During any pullback the 200-day moving average at 71.8 levels can act as support. The acceleration on the upside took a parabolic shape in the short-term. Parabolic price actions are not sustainable. Short-term corrections or sideways consolidations are possibilities that we need to consider after such strong advance.
I start my research on Mondays and finalize by end of day Thursday. Friday is dedicated to putting all ideas to the report format. During the week I come across good setups and those are featured in the weekly report. However, there are those that pop during the week and is worth bringing to your attention before the week finalizes. Below are 3 additions to Tech Charts watchlist that may experience breakouts. These charts will also be included in the weekly update.
A theme develops when we see several bullish or bearish chart patterns on the price charts of an industry/sector. At Tech Charts, research and idea generation is based on a bottom up approach. That means I start with individual names irrespective of market, sector or geography. As I find new opportunities that fit my criteria I add them to my watchlist. Sometimes I see several similar chart pattern developments and when I start working on my short list I come across developing themes. Read more
Every week Tech Charts Global Equity Markets report features some of the well-defined, mature classical chart patterns under a lengthy watchlist and the chart pattern breakout signals that took place during that week. Global Equity Markets report covers single stocks from developed, emerging and frontier markets, ETF’s and global equity indices. The report starts with a review section that highlights the important chart developments on global equity benchmarks and miscellaneous charts of interest. This blog post features from the review section a long-term base formation and a breakout opportunity that is listed on Toronto Stock Exchange.
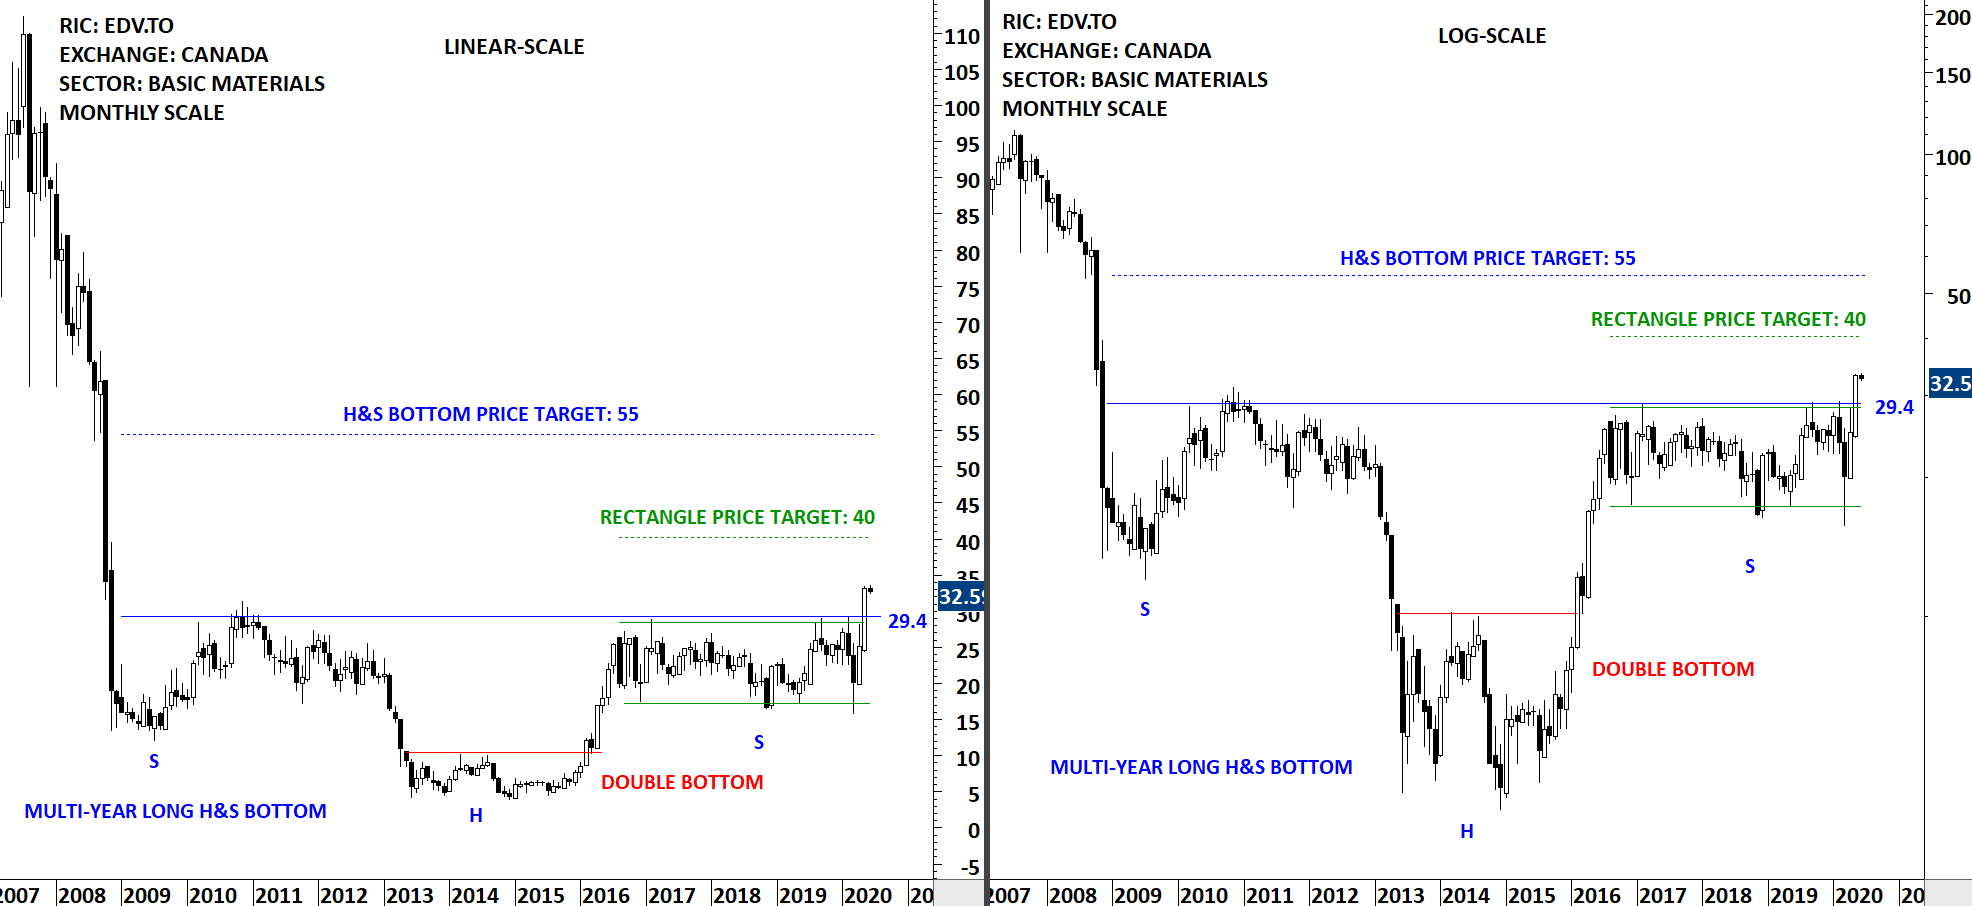
ENDEAVOUR MINING CORP (EDV.TO)
Endeavour Mining Corporation (Endeavour) is an intermediate gold producer. The Company is a gold mining company that operates four mines in Cote d’Ivoire (Agbaou and Ity), Burkina Faso (Karma) and Ghana (Nzema), along with project development and exploration assets. The stock is listed on Toronto Stock Exchange. Price chart formed a multi-year long rectangle as part of a possible decade-long H&S bottom. This is a very long-term chart pattern and should be given enough room with protective stops. I would view it as a long-term breakout opportunity. I added both the linear scale and logarithmic scale price charts (difference between log and linear scale price charts). Rectangle chart pattern has a possible price target of 40 and the price objective for the H&S bottom is at 55 levels.
Tech Charts Membership
By becoming a Premium Member, you’ll be able to improve your knowledge of the principles of classical charting.
With this knowledge, you can merge them with your investing system. In fact, some investors use my analyses to modify their existing style to invest more efficiently and successfully.