
ISHARES MSCI EMERGING MARKETS ETF (EEM)
Every week Tech Charts Global Equity Markets report features some of the well-defined, mature classical chart patterns under a lengthy watchlist and the chart pattern breakout signals that took place during that week. Global Equity Markets report covers single stocks from developed, emerging and frontier markets, ETF’s and global equity indices. The report starts with a review section that highlights the important chart developments on global equity benchmarks. This blog post features from the review section the iShares MSCI Emerging Markets Index ETF (EEM), listed on the New York Stock Exchange.
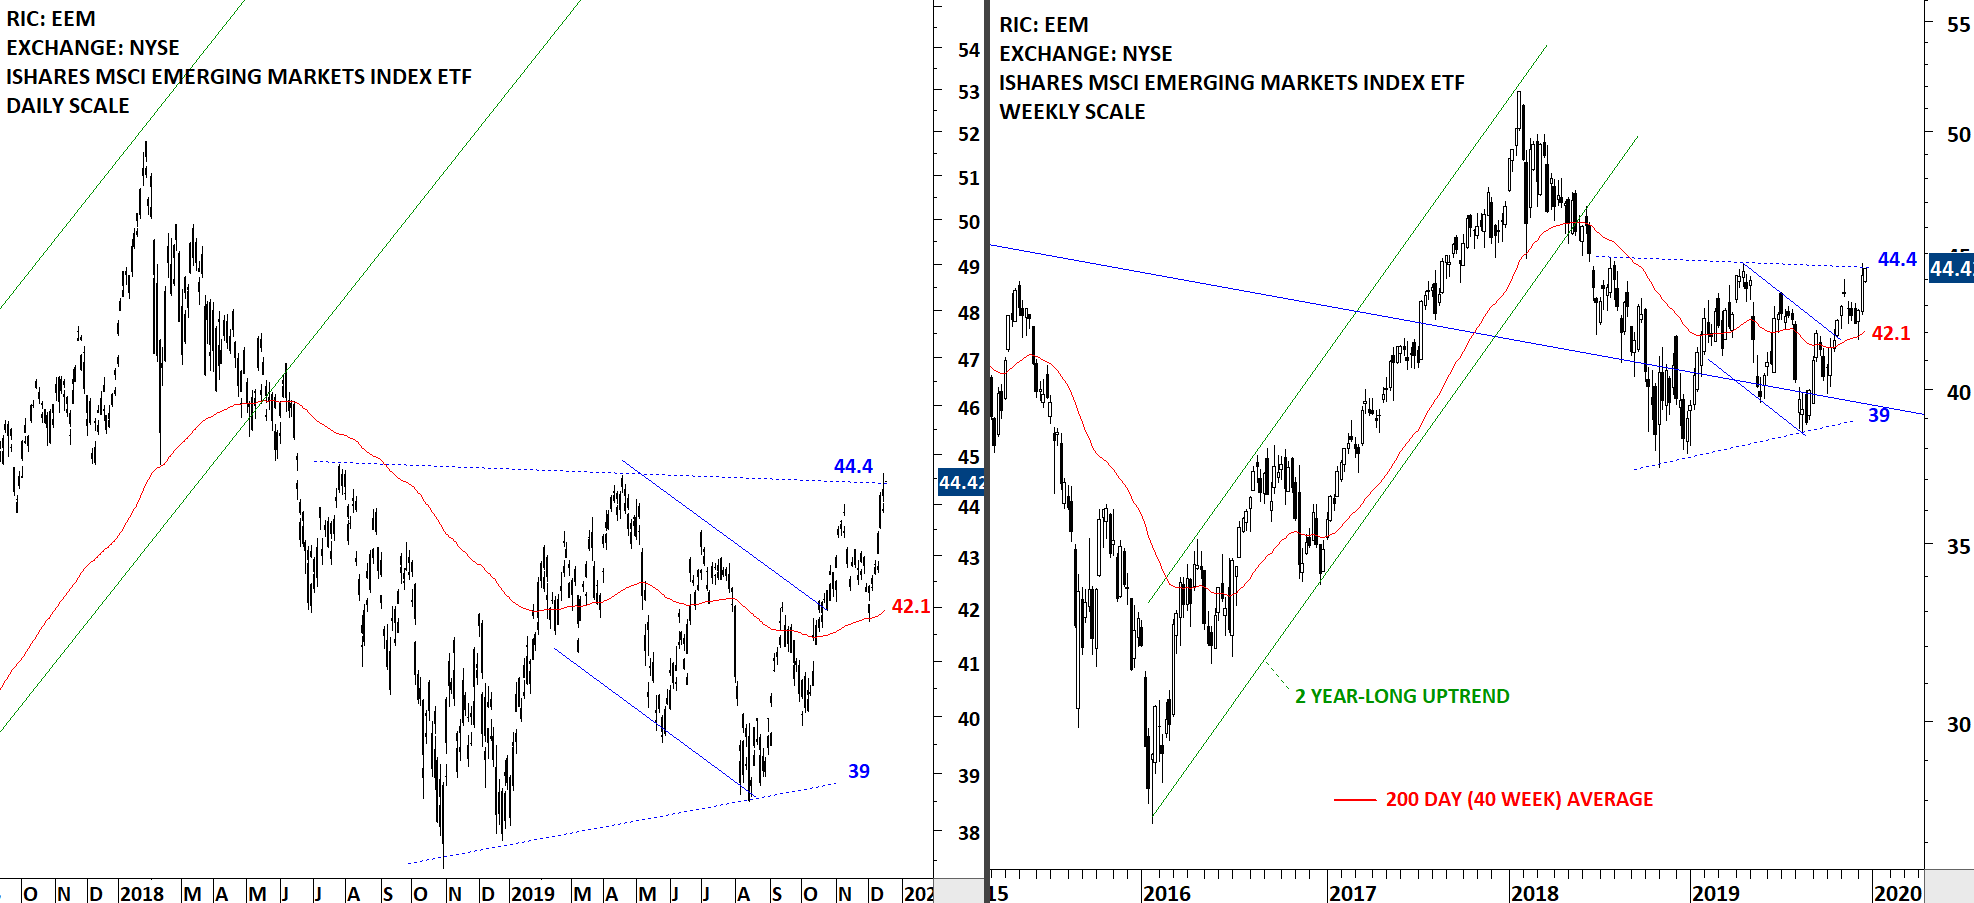
The benchmark for the Emerging Markets performance, the iShares MSCI Emerging Markets Index ETF (EEM) rebounded from the 200-day moving average at 42 levels and reached the upper boundary of its year-long sideways consolidation at 44.4 levels. Without a breakout on China equity benchmarks the Emerging Markets ETF will not get out of the woods. Having said that this week’s price action was promising both on China equity benchmarks and EEM ETF. Price action is still showing sideways consolidation. Breakout above 44.4 levels will be very positive for Emerging Markets. The consolidation can act as a bottom reversal (double bottom) or (symmetrical triangle reversal). Data as of December 16, 2019.
Tech Charts Membership

By becoming a Premium Member, you’ll be able to improve your knowledge of the principles of classical charting.
With this knowledge, you can merge them with your investing system. In fact, some investors use my analyses to modify their existing style to invest more efficiently and successfully.

As a Premium Member of Aksel Kibar’s Tech Charts,
You will receive:
-
Global Equities Report. Delivered weekly.
-
Classical charting principles. Learn patterns and setups.
-
Actionable information. Worldwide indices and stocks of interest.
-
Risk management advice. The important trading points of each chart.
-
Information on breakout opportunities. Identify the ones you want to take action on.
-
Video tutorials. How patterns form and why they succeed or fail.
-
Watch list alerts. As they become available so you can act quickly.
-
Breakout alerts. Usually once a week.
-
Access to everything (now and as it becomes available)o Reports
o Videos and video series -
Multi-part webinar course. You learn the 8 most common charting principles.
-
Webinars. Actionable and timely advice on breaking out chart patterns.
For your convenience your membership auto renews each year.


