Every week Tech Charts Global Equity Markets report features some of the well-defined, mature classical chart patterns under a lengthy watchlist and the chart pattern breakout signals that took place during that week. Global Equity Markets report covers single stocks from developed, emerging and frontier markets, ETF’s and global equity indices. The report starts with a review section that highlights the important chart developments on global equity benchmarks. This blog post features from the watchlist section Sodexo SA, listed on the Paris Stock Exchange.
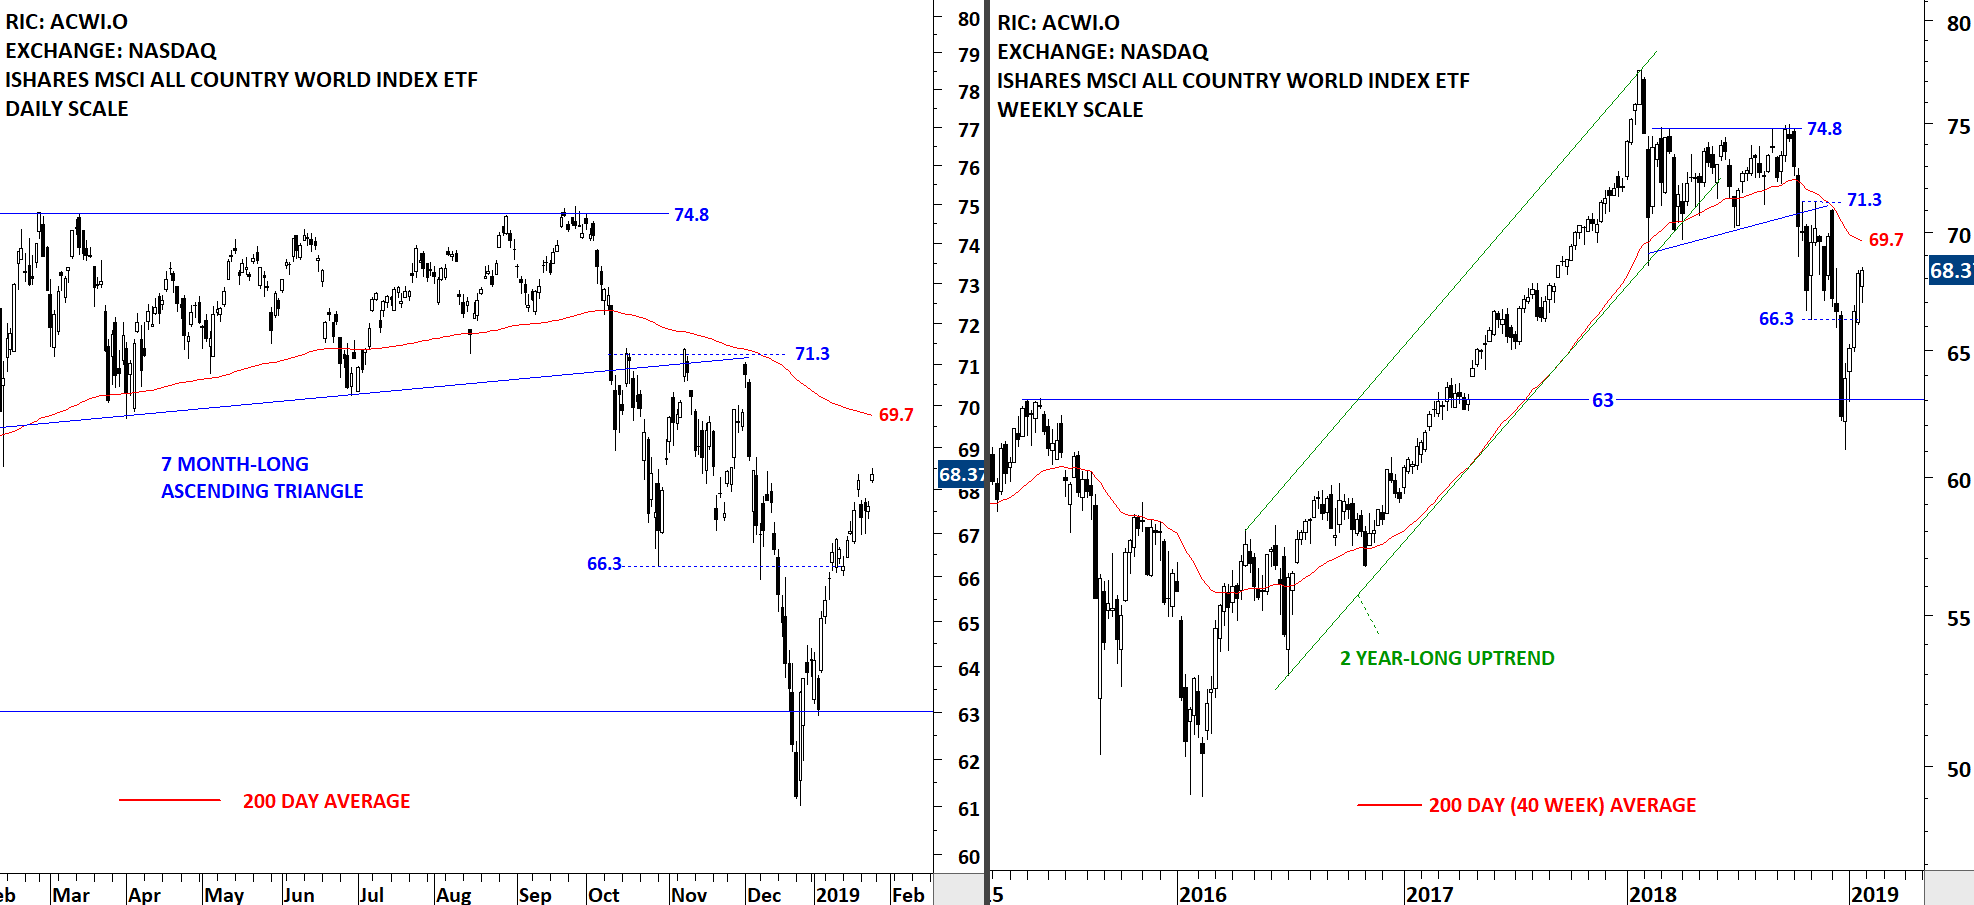
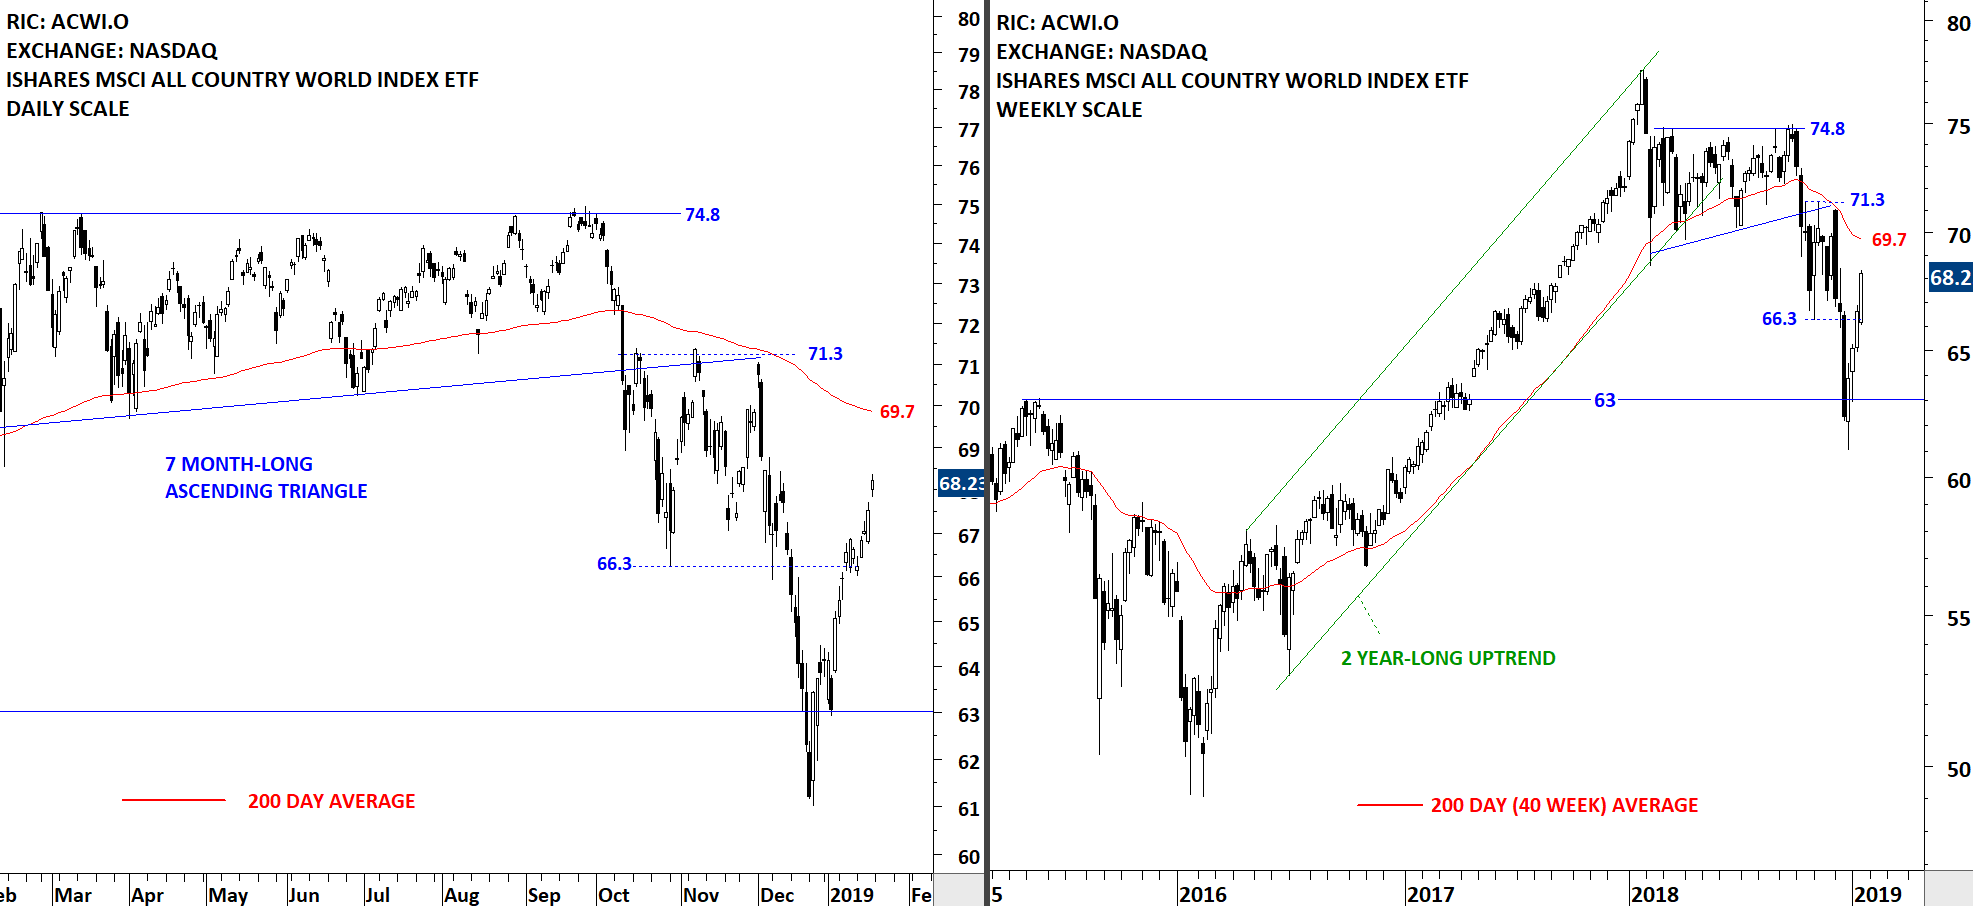
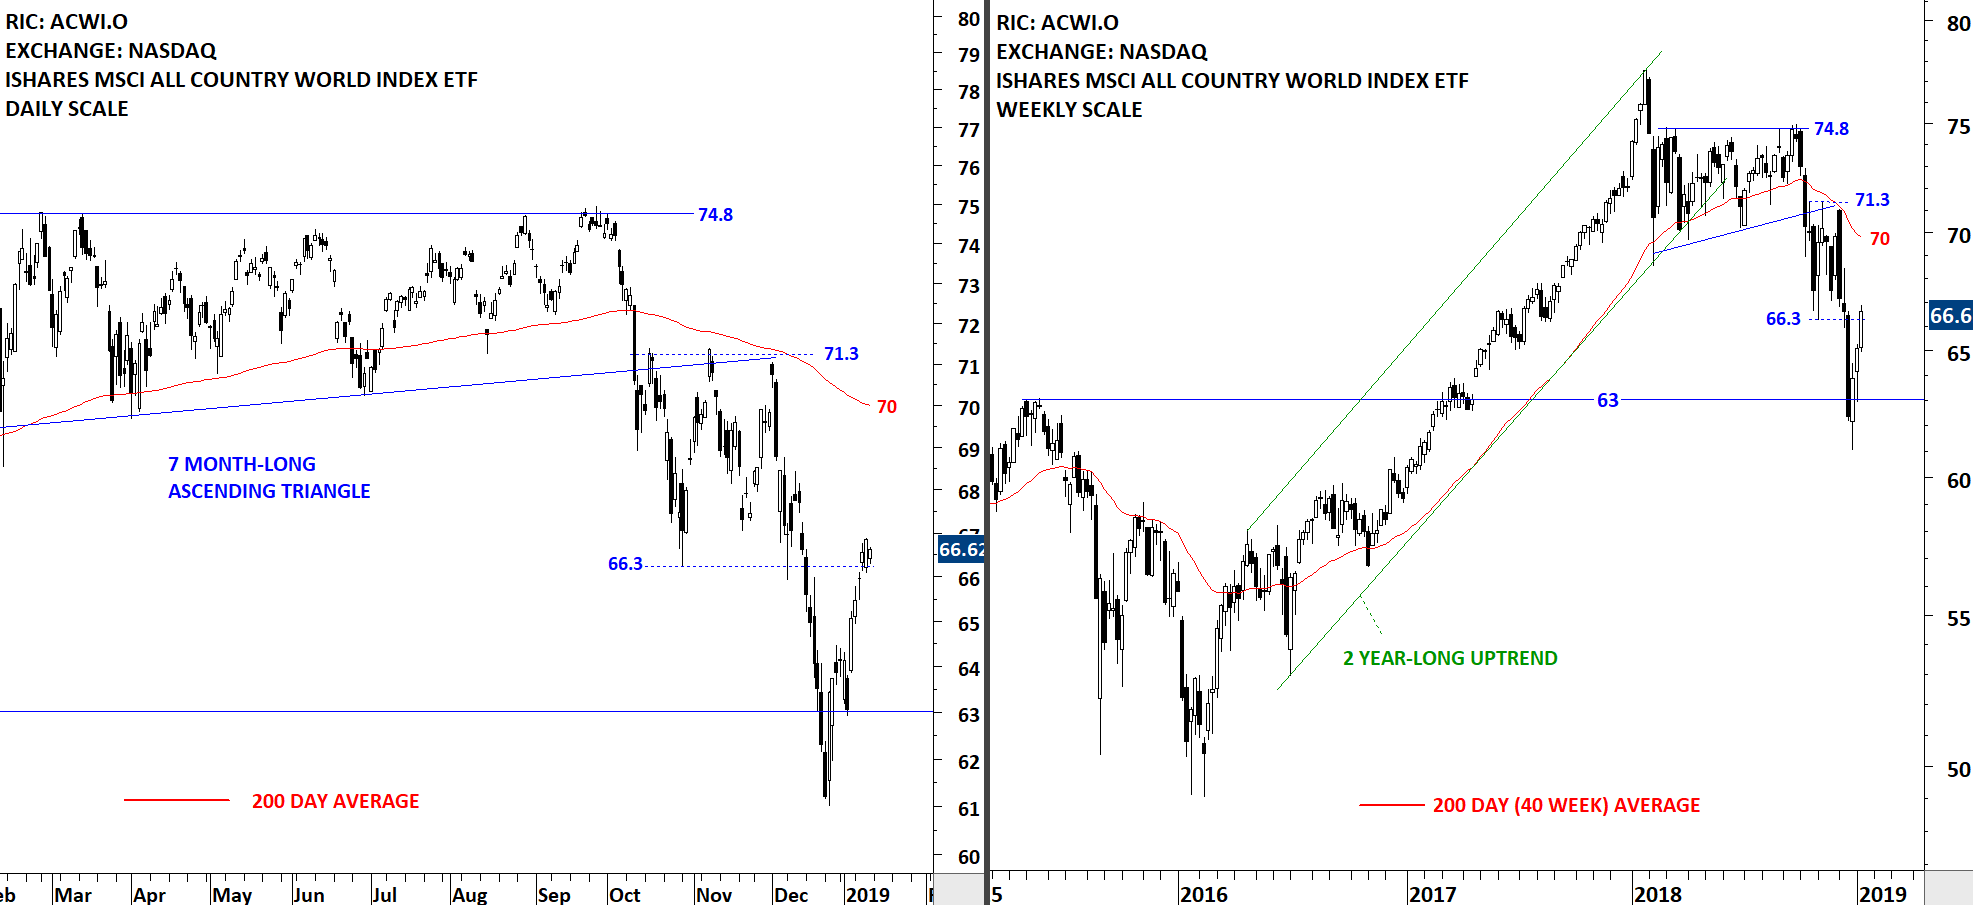
The benchmark for Global equity markets performance, iShares MSCI All Country World Index ETF (ACWI.O) had a strong rebound from the support level at 63 levels. V-reversal pushed the ETF towards its long-term moving average at 69.7 levels. In the last quarter of 2018, the ETF broke down its 7 month-long consolidation and started a corrective period. Over the past 5 weeks the ETF had back to back gains that recovered most of December 2018 losses without any pullback. Latest rebound might be due for a short pullback. I will be looking for bullish chart pattern developments to find low risk entry points.
Friday’s price action was a gap opening. Below I analyze two gap openings on the iShares MSCI Emerging Markets ETF (EEM) and the iShares MSCI All Country World Index ETF (ACWI.O).
Every week Tech Charts Global Equity Markets report features some of the well-defined, mature classical chart patterns under a lengthy watchlist and the chart pattern breakout signals that took place during that week. Global Equity Markets report covers single stocks from developed, emerging and frontier markets, ETF’s and global equity indices. The report starts with a review section that highlights the important chart developments on global equity benchmarks. This blog post features from the review section the iShares MSCI Emerging Markets Index ETF (EEM)
The iShares MSCI All Country World Index ETF, a measure of Global equity markets performance, had a sharp rebound from the support level at 63. V-bottom reversals are difficult to analyze and trade. If we have seen a V bottom and the ETF keeps climbing higher in the following weeks, I will wait for the price to stabilize around the long-term average. During any pullback I will monitor this ETF for short/medium-term bullish continuation chart pattern developments. Long-term 200-day moving average stands at 69.7 levels.
I have been preparing some bullish chart pattern setups to be featured in the weekly Global Equity Markets report on the 19th of January. However, a positive news on China & U.S. trade talks is likely to move some of those names in the last trading day of the week. I thought it is important to be prepared for such breakouts (if they take place). Below are the stocks that are listed on China/Hong Kong exchanges with potential bullish setups.
Reversal Chart Patterns – January 2019 Tech Charts Webinar
We will review some of those chart pattern breakdowns that were featured in the Global Equity Markets report.
We will review some of the qualities we look for when identifying reversal chart patterns
We will look at some of the developing top formations.
We will continue to highlight Tech Charts members favorite chart pattern setups in different equity markets.
Live questions from Members
Live questions from Members
I wondered if you could discuss gold and silver in dollars please? They seem to have bottomed, but not clear on what formations they may be making. 48:25
Japan I have seen some folks draw non-horizontal boundary lines on potential H&S tops. Is this valid? 49:33 Link mentioned VEDANTA LTD (VDAN.NS)
Italy would the buy signal come at a reversal to 15.8 or earlier? 51:16
For the launching patterns you showed – where do you put your stop? Can you discuss trade management? 52:08
Germany had a nice candle right where it should at the target low price, what do we need to see to be a buyer for a reversal upside? 53:44
For PKG the right shoulder was higher than the left shoulder – What are your thoughts on this, do you prefer lower right shoulder? How much of a difference in shoulder height would you ignore? 56:06
Korea has an almost horizontal neck line, valid? 59:40
On the breakdown of the H&S – Are you taking into consideration volume as a confirmation as well? 1:00:11
What is the difference between consolidation, distribution, and continuation patterns? 1:00:44
You mention a price target on the charts, what about stop loss? Where would you set your stop loss? 1:03:00 Link mentioned ATR Trailing Stop-Loss – H&S Top
If you are new to trading – How would you suggest starting? 1:03:43
If a breakout signal is missed, would you try to enter at a rebound? 1:07:24
If the price target is met do you take profit on the whole position? Or keep some on and use a trailing stop? 1:08:20
When you draw your diagonal trend channels, do you start with the line on the top of the candles or the bottom? And are the charts linear or log? 1:09:06
On the DAX why draw the neckline as horizontal? 1:10:23
For ascending and descending triangles are there a minimum/ideal number of contact points you look for to define these? 1:11:45
When you have 2 patterns e.g. H&S and rectangle, which price target should we use? 1:13:40
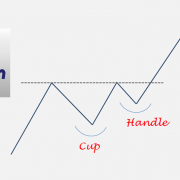
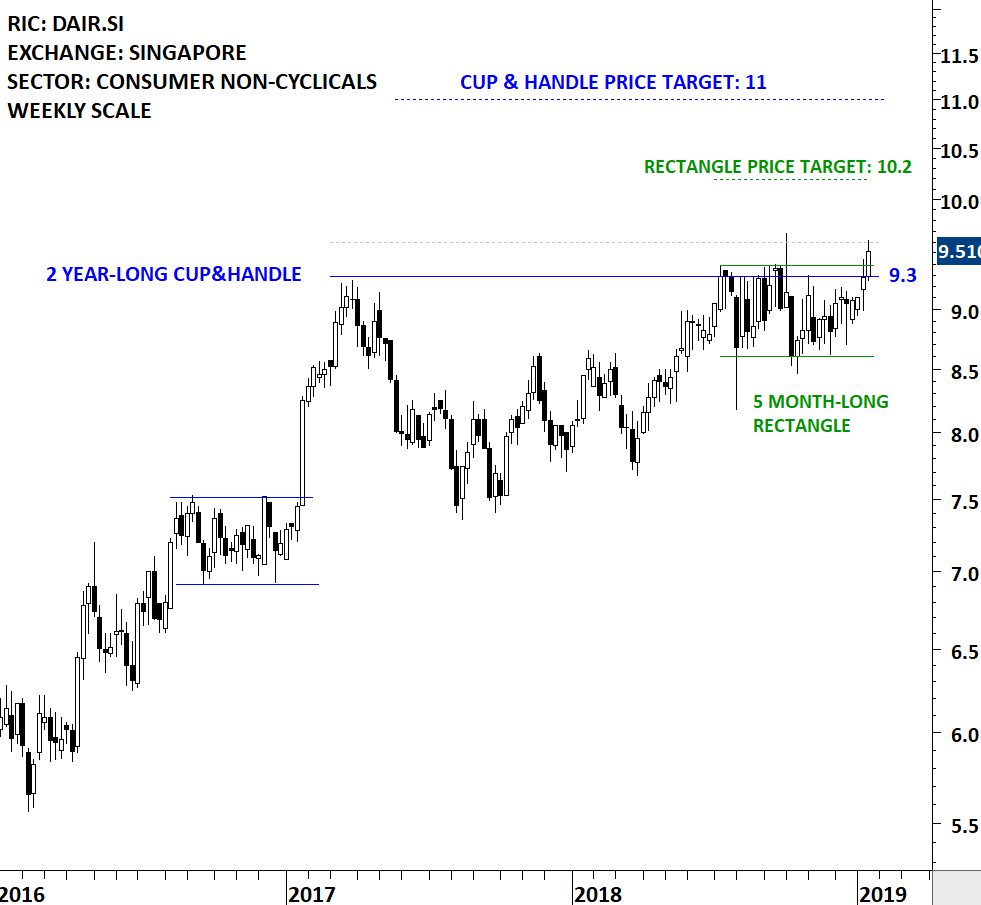
Every week Tech Charts Global Equity Markets report features some of the well-defined, mature classical chart patterns under a lengthy watchlist and the chart pattern breakout signals that took place during that week. Global Equity Markets report covers single stocks from developed, emerging and frontier markets, ETF’s and global equity indices. The report starts with a review section that highlights the important chart developments on global equity benchmarks. This blog post features from the watchlist section a bullish cup & handle continuation chart pattern on Singapore’s Dairy Farm International Holdings (DAIR.SI)
Dairy Farm International Holdings Limited is a Hong Kong-based Asian retailer. The Company operates in four segments: Food, Health and Beauty, Home Furnishings, and Restaurants. The stock is listed on the Singapore Stock Exchange. Price chart formed a 2 year-long cup & handle continuation with the horizontal boundary acting as strong resistance at 9.3 levels. The horizontal boundary was tested several times over the course of the chart pattern. A daily close above 9.6 levels will confirm the breakout from the 2 year-long cup & handle continuation with the possible chart pattern price target of 11 levels. The handle part of the multi year-long consolidation can be identified as a possible rectangle that can act as a launching pattern. Price data is as of January 15, 2019 CET 7:00 AM.
EDUCATIONAL VIDEO ON CUP & HANDLE CONTINUATION CHART PATTERN
Tech Charts Membership
By becoming a Premium Member, you’ll be able to improve your knowledge of the principles of classical charting.
With this knowledge, you can merge them with your investing system. In fact, some investors use my analyses to modify their existing style to invest more efficiently and successfully.
The iShares MSCI All Country World Index ETF, a measure of Global equity markets performance, had a sharp rebound from the support level at 63. Back to back weekly gains pushed the index towards the resistance area between 66.3 and 70. Is the recent rebound part of a bottoming process or a counter-trend rally in a downtrend? The answer lies in the following week’s price action. V-bottom reversals are difficult to analyze and trade. If we have seen a V bottom and the ETF keeps climbing higher in the following weeks, I will wait for the price to stabilize above the long-term average. If there is a re-test of previous lows in an attempt to form a double bottom, then I will monitor the ETF for a long opportunity. The other possibility is that we see a short-term consolidation before moving higher. That again will alert me to look for bullish setups.
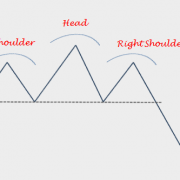
Every week Tech Charts Global Equity Markets report features some of the well-defined, mature classical chart patterns under a lengthy watchlist and the chart pattern breakout signals that took place during that week. Global Equity Markets report covers single stocks from developed, emerging and frontier markets, ETF’s and global equity indices. The report starts with a review section that highlights the important chart developments on global equity benchmarks. This blog post features 2 head and shoulder top chart patterns from Developed and Emerging market equities.
This interim update reviews 2 long-term developing breakout opportunities in Sweden equity market. Both charts patterns are mature and well-defined. Breakouts from these lengthy consolidations can push these stocks to all-time highs. Both chart patterns can act as bullish continuations.