GLOBAL EQUITY MARKETS – March 2, 2019
REVIEW
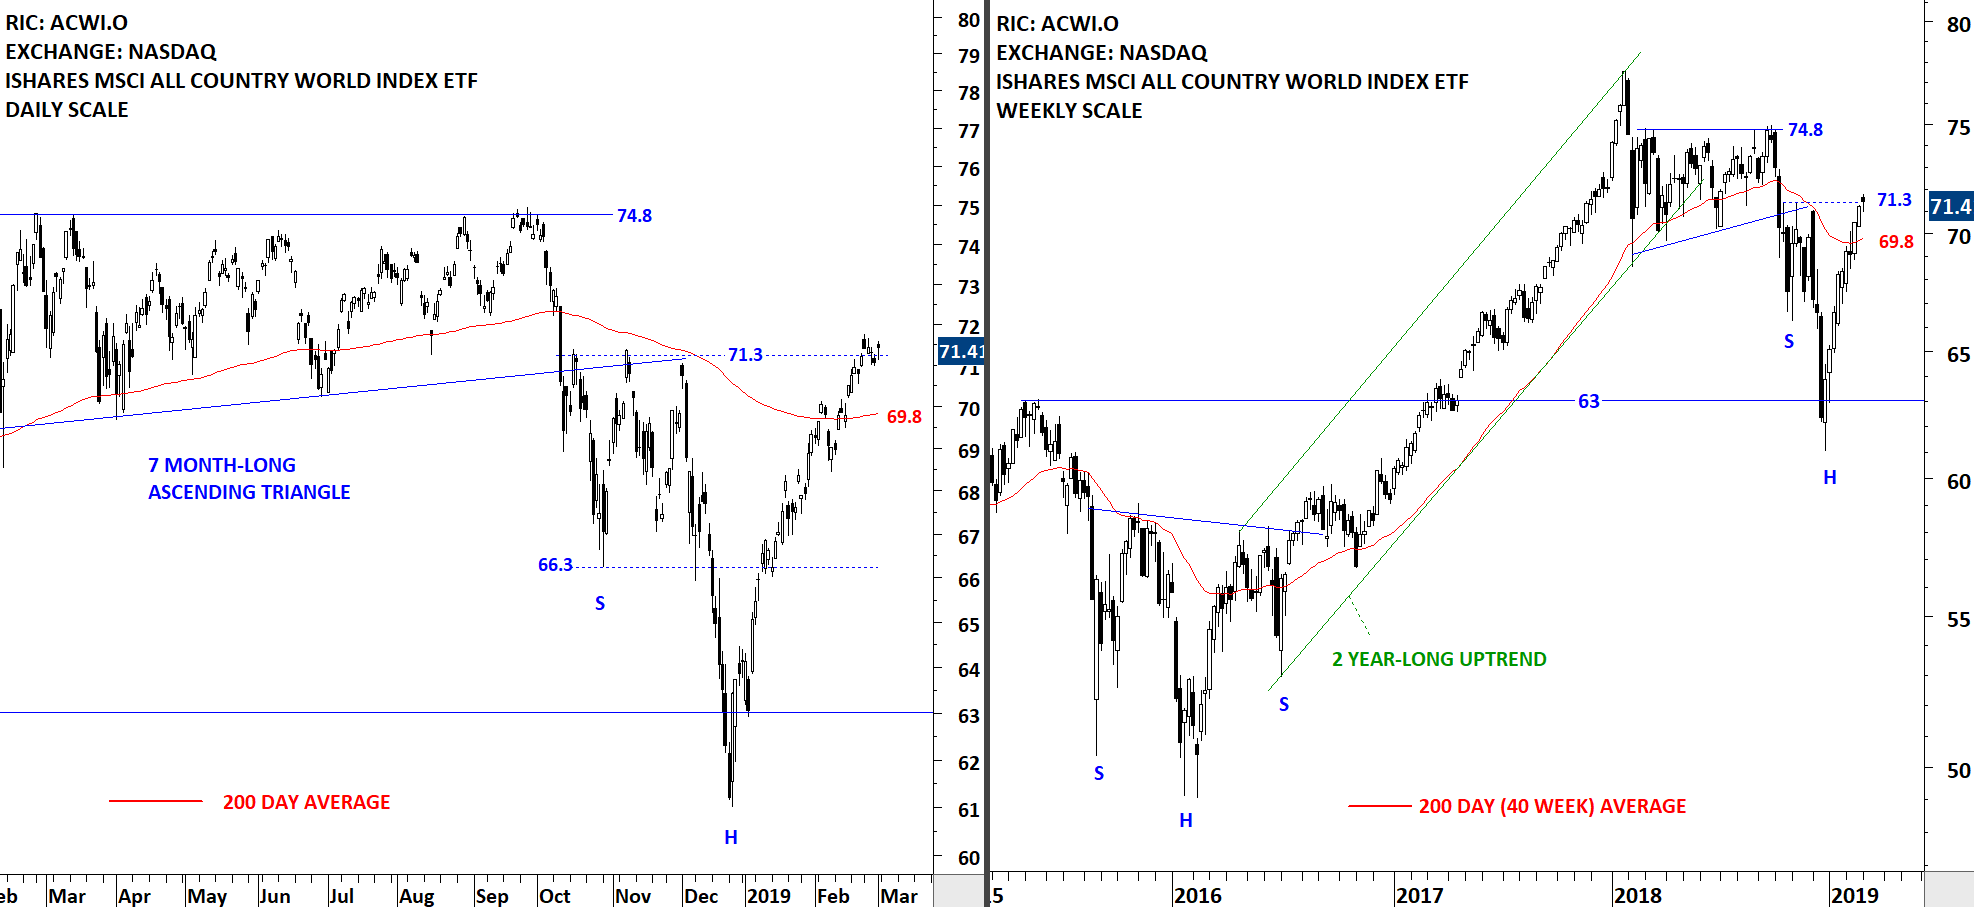
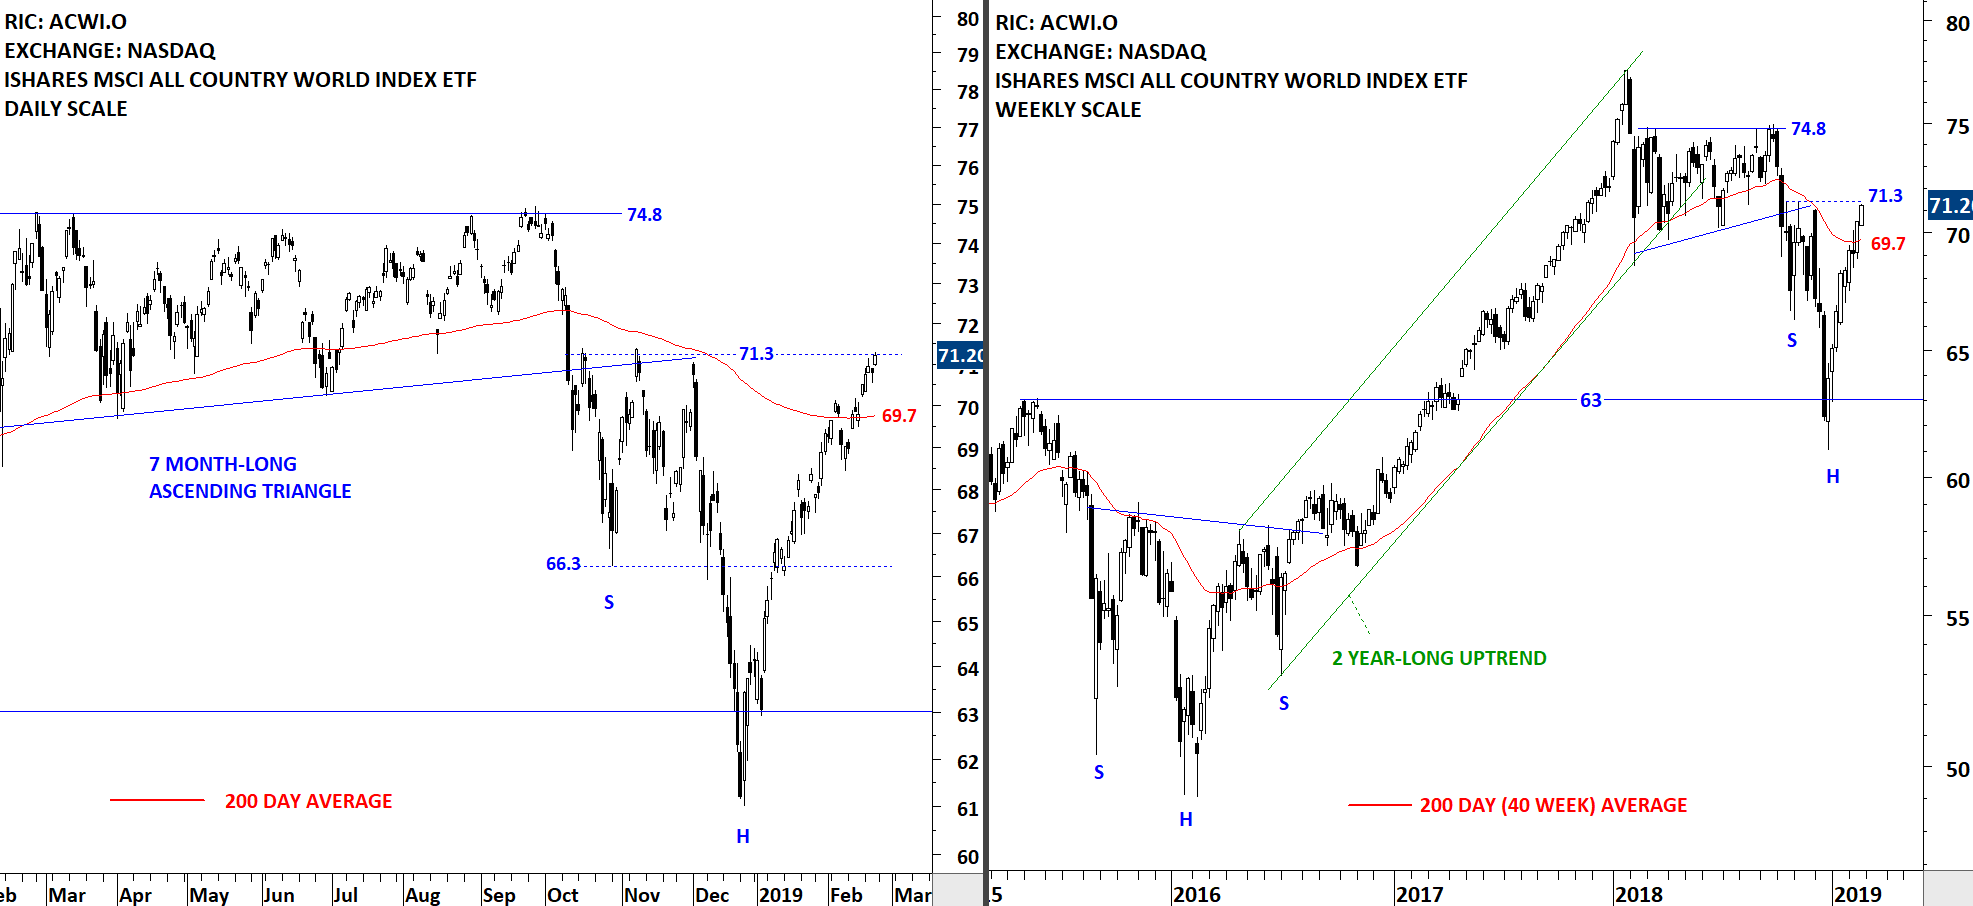
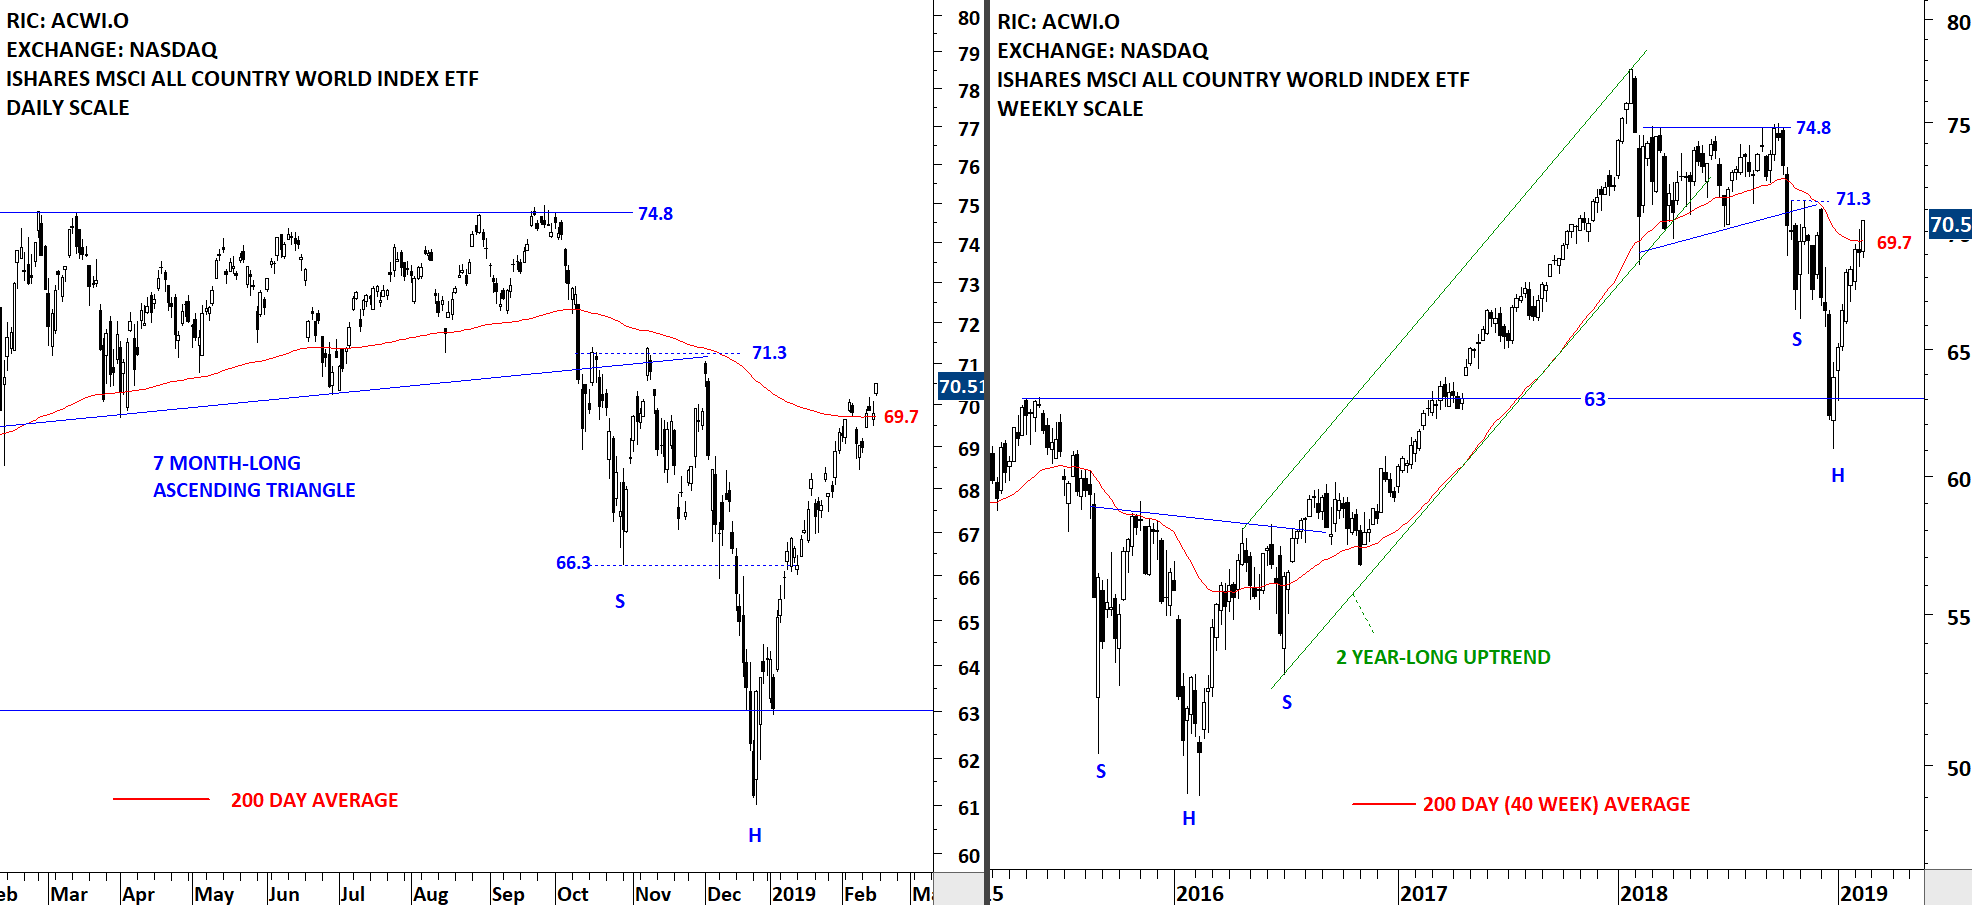
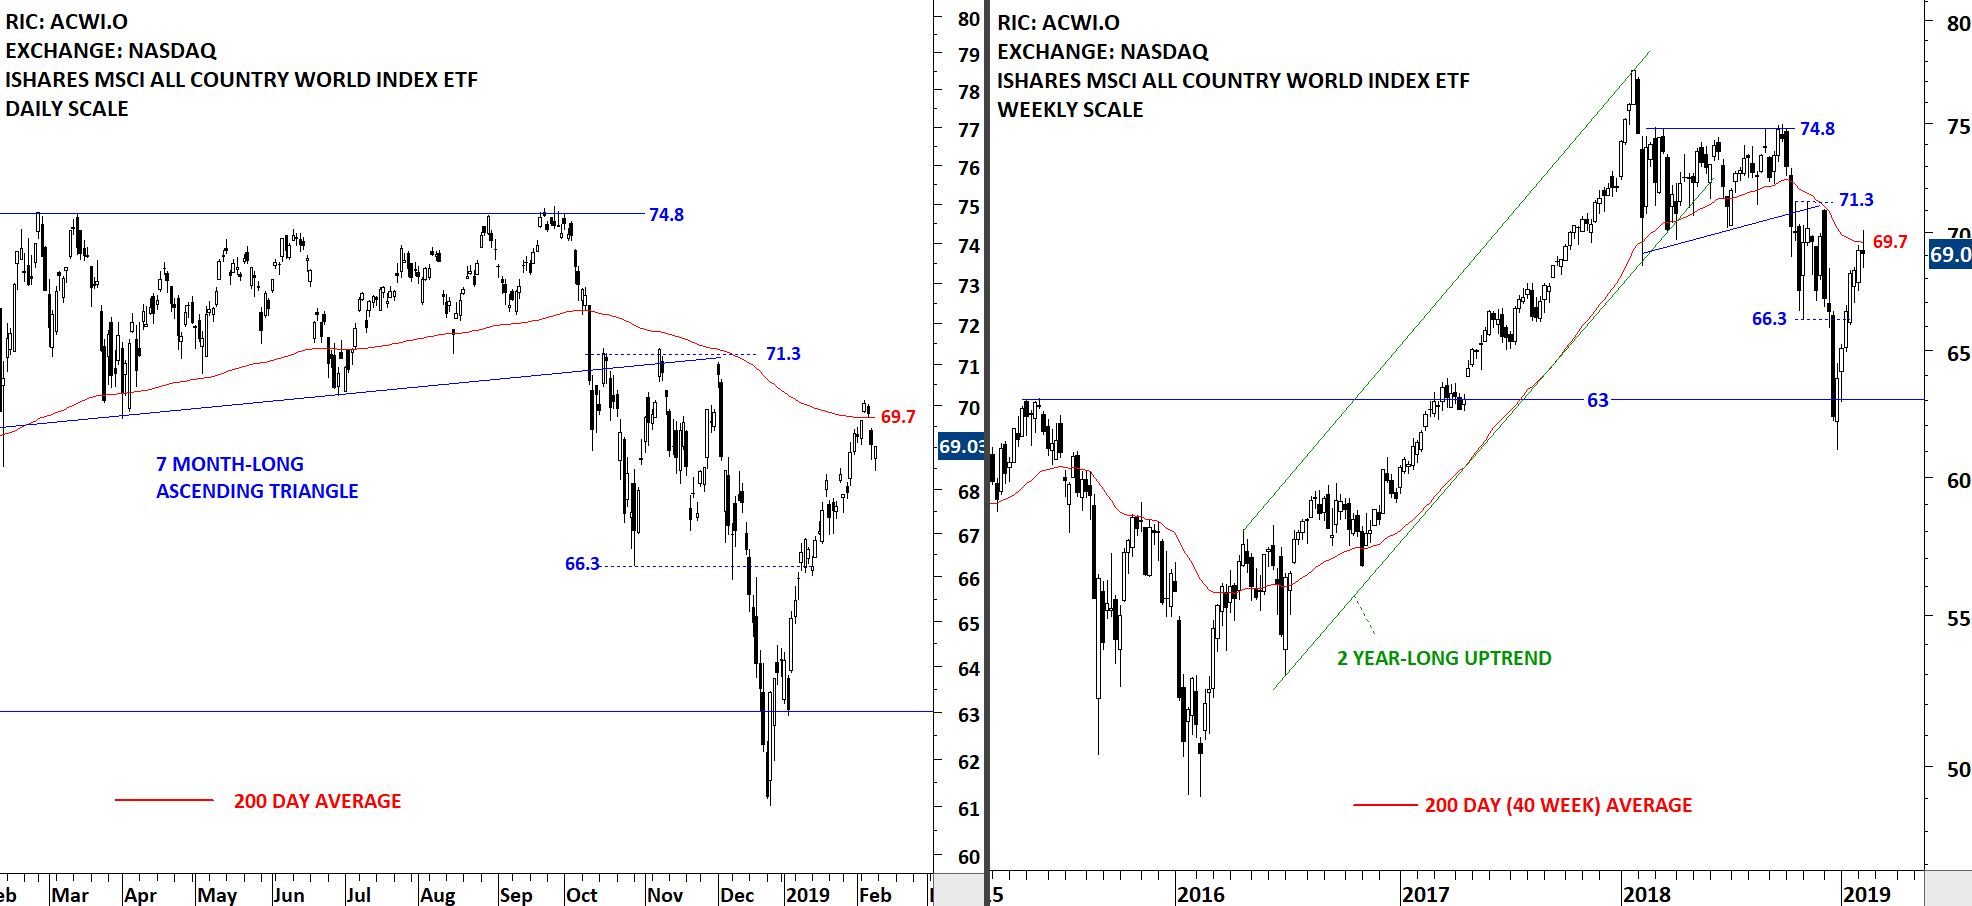
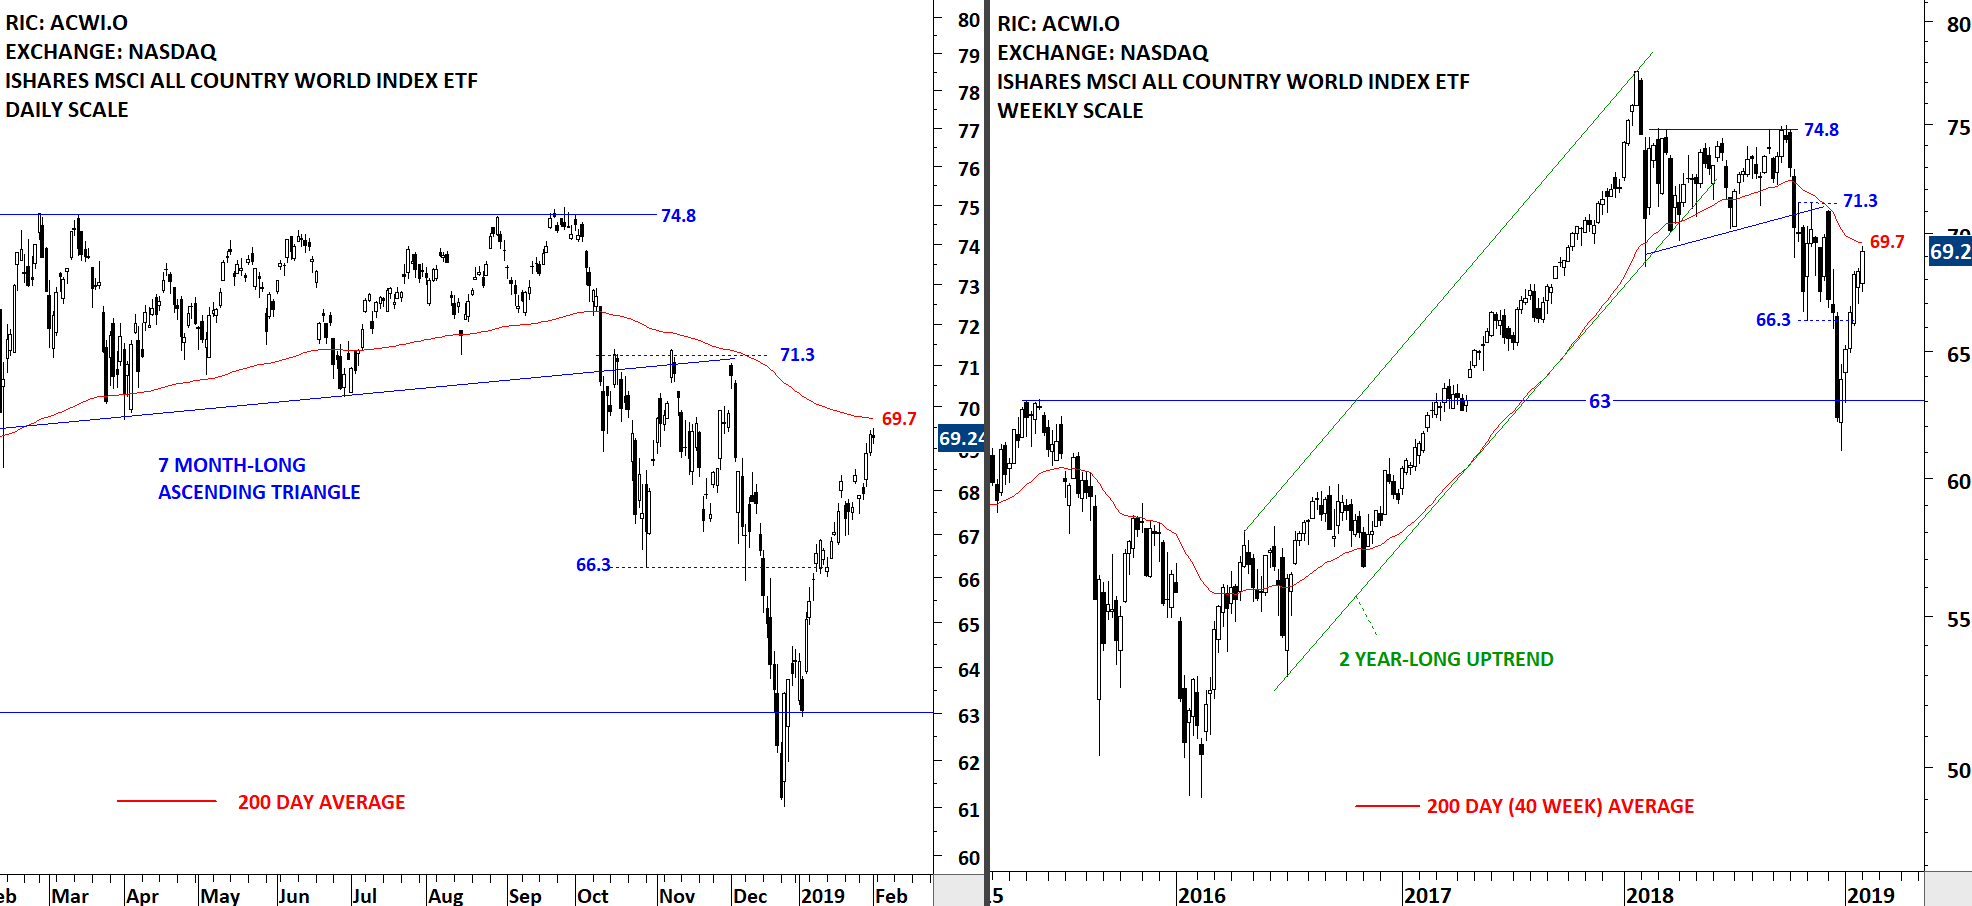
The benchmark for the Global equity markets performance, the iShares MSCI All Country World Index ETF remains above its long-term 200-day moving average. The ETF is now testing a minor resistance level at 71.3. The rebound from January lows has been strong and without any correction. A possible correction can result in a pullback to test the 200-day moving average at 69.8 levels. With the price remaining above the long-term average, the technical outlook has turned positive.