STEPAN CO (SCL)
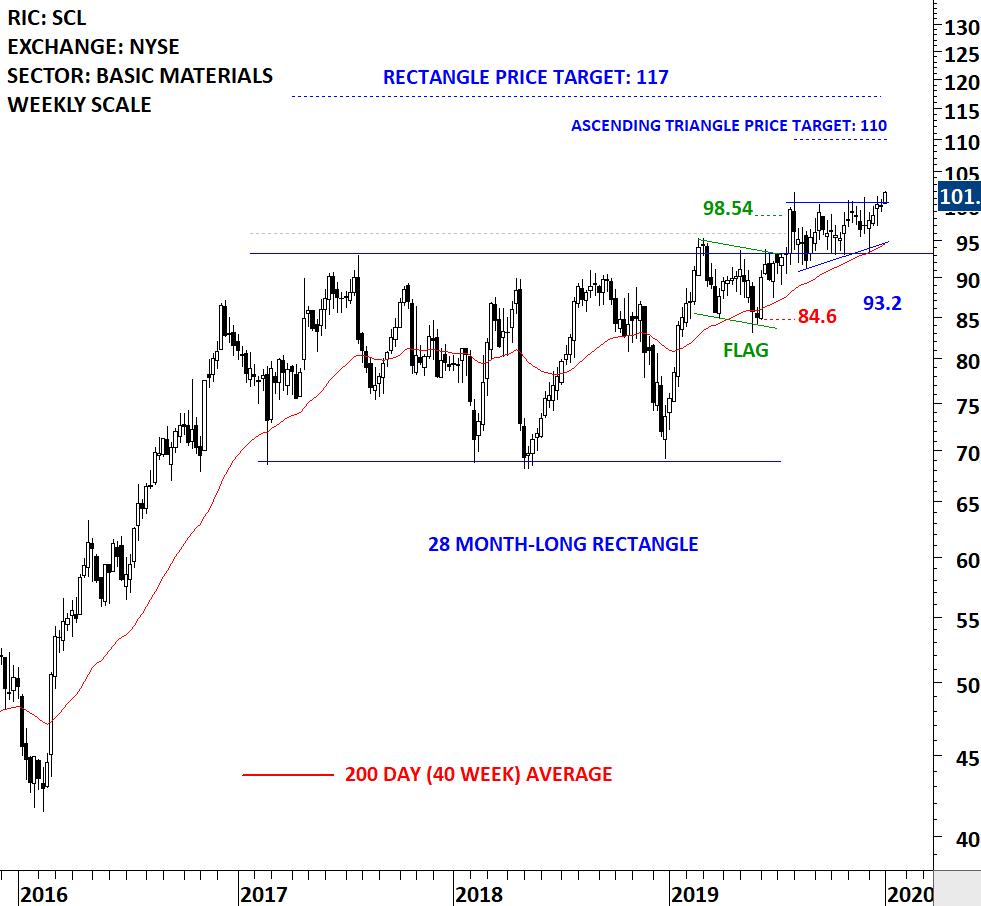
Every week Tech Charts Global Equity Markets report features some of the well-defined, mature classical chart patterns under a lengthy watchlist and the chart pattern breakout signals that took place during that week. Global Equity Markets report covers single stocks from developed, emerging and frontier markets, ETF’s and global equity indices. The report starts with a review section that highlights the important chart developments on global equity benchmarks. This blog post features from the watchlist section an ascending triangle chart pattern opportunity, listed on the New York Stock Exchange. Stepan Company was featured before as part of Breakout Alerts when the stock completed the 28 month-long rectangle. However since then, price formed another sideways consolidation above the horizontal support (upper boundary of the rectangle). The chart pattern is possibly an ascending triangle (bullish continuation) that can resume the existing uptrend.
Below you can also find a short educational video explaining how several bullish chart patterns can form during a steady uptrend.
STEPAN CO (SCL)
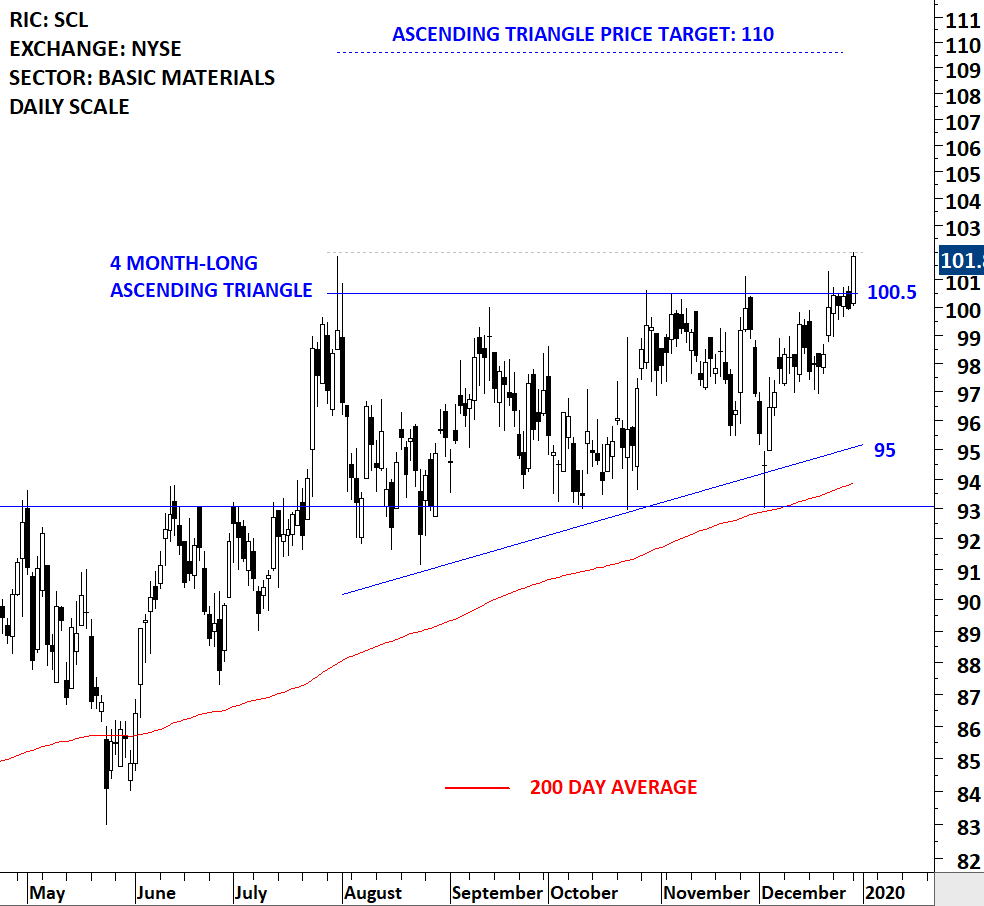
Stepan Company produces specialty and intermediate chemicals, which are sold to other manufacturers and used in a range of end products. The stock is listed on the New York Stock Exchange. Price chart formed a 4 month-long ascending triangle with the horizontal boundary acting as strong resistance at 100.5 levels. The horizontal boundary was tested several times over the course of the chart pattern. A daily close above 102.0 levels will confirm the breakout from the 4 month-long ascending triangle with the possible chart pattern price target of 110.0 levels. Breakout can push the stock to all-time highs.
A short educational video explaining formation of several bullish chart patterns in an uptrend
Tech Charts Membership

By becoming a Premium Member, you’ll be able to improve your knowledge of the principles of classical charting.
With this knowledge, you can merge them with your investing system. In fact, some investors use my analyses to modify their existing style to invest more efficiently and successfully.

As a Premium Member of Aksel Kibar’s Tech Charts,
You will receive:
-
Global Equities Report. Delivered weekly.
-
Classical charting principles. Learn patterns and setups.
-
Actionable information. Worldwide indices and stocks of interest.
-
Risk management advice. The important trading points of each chart.
-
Information on breakout opportunities. Identify the ones you want to take action on.
-
Video tutorials. How patterns form and why they succeed or fail.
-
Watch list alerts. As they become available so you can act quickly.
-
Breakout alerts. Usually once a week.
-
Access to everything (now and as it becomes available)o Reports
o Videos and video series -
Multi-part webinar course. You learn the 8 most common charting principles.
-
Webinars. Actionable and timely advice on breaking out chart patterns.
For your convenience your membership auto renews each year.


