Dear Tech Charts Members,
(Register below)
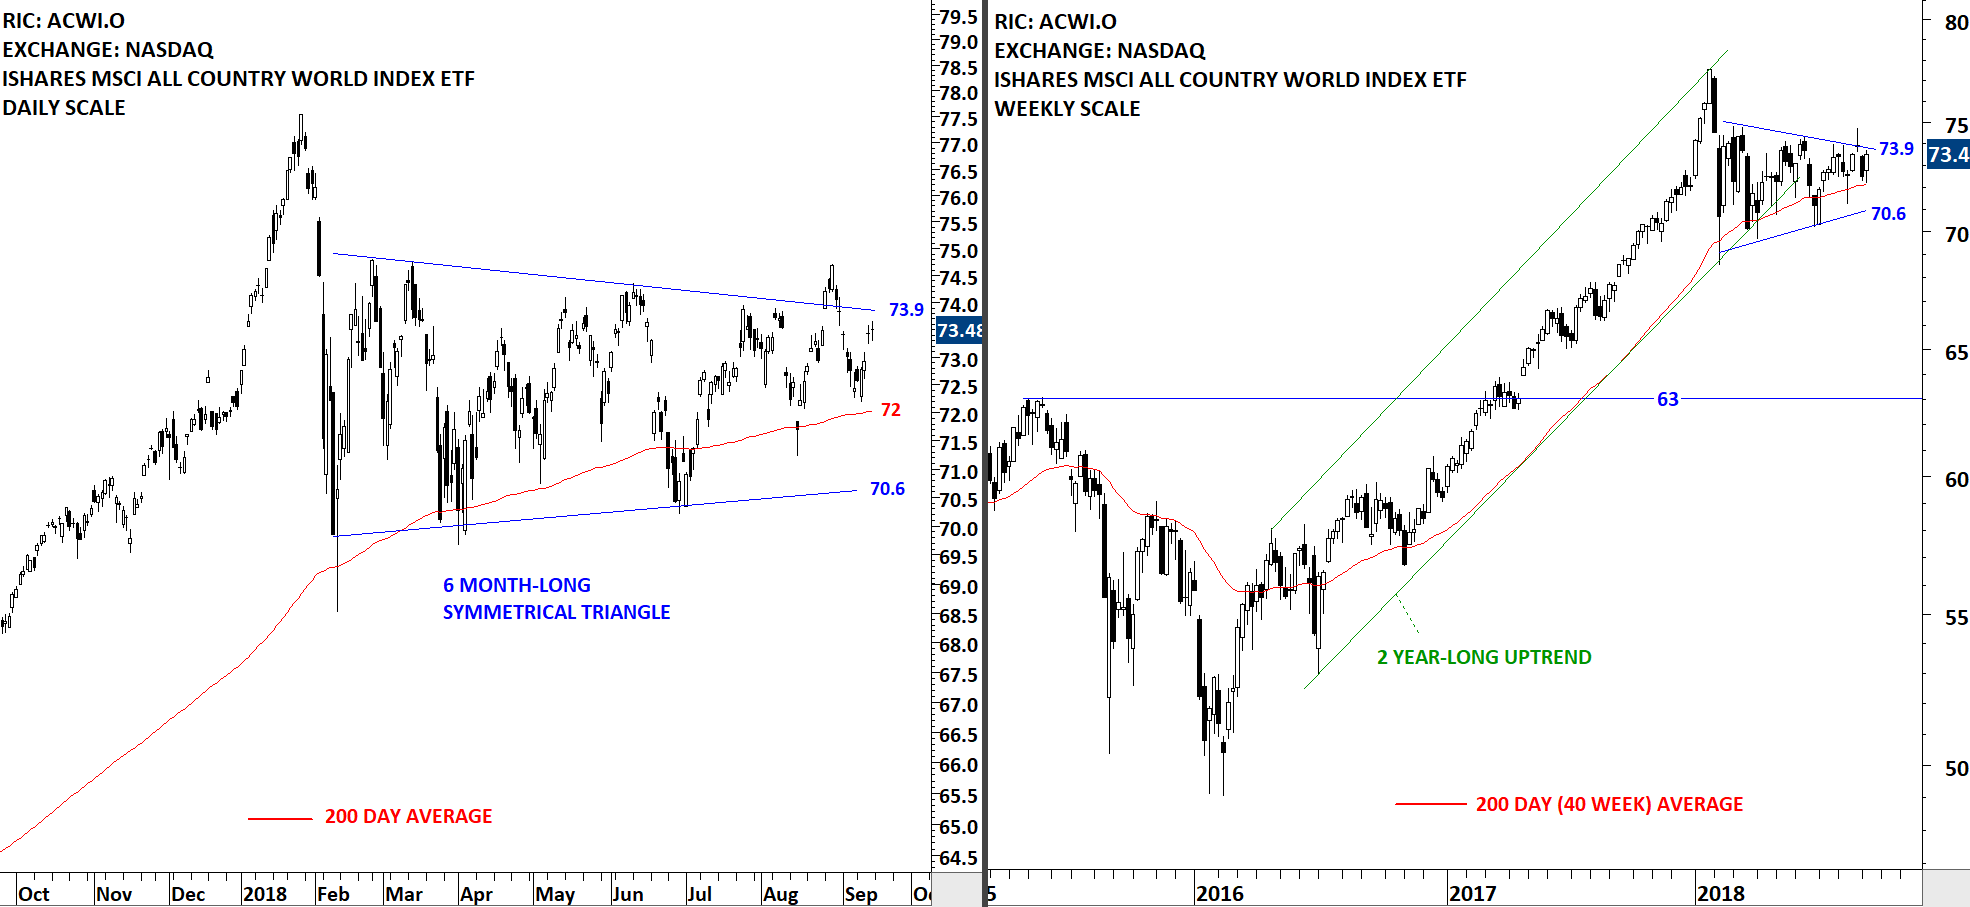
We are continuing our Member webinar series with another classical chart pattern; the symmetrical triangle. Symmetrical triangle is a chart pattern with diagonal boundaries and it is a neutral chart pattern. It can form as a reversal as well as a continuation chart pattern. A symmetrical triangle forms due to the indecision between buyers and sellers. Over the past couple of months the Global Equity Markets report has featured great chart setups that were identified as well-defined symmetrical triangles.
Scheduled for: Tuesday, September 25th at 11am MST (register below)
The upcoming webinar is dedicated to a thorough discussion on this popular diagonal chart pattern.
- We will review some of those chart pattern breakouts that were featured in the Global Equity Markets report.
- We will review some of the failed breakouts and try to analyze what differentiates a successful breakout from a failed breakout.
- We will look at some of the developing symmetrical triangle chart pattern setups.
- We will continue to highlight Tech Charts members favorite symmetrical triangle setups in different equity markets. I would like to discuss and share some of the best classical chart patterns that members identified or those charts that members might have questions about.
- As usual we will have a member Q&A at the end of the webinar.
Read more