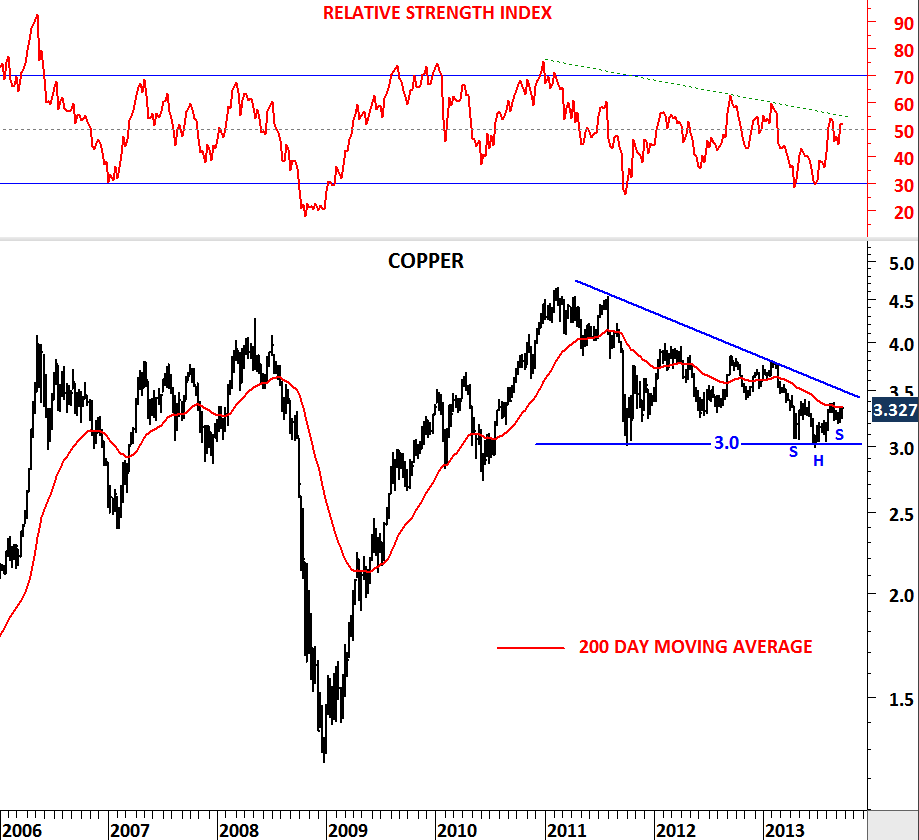
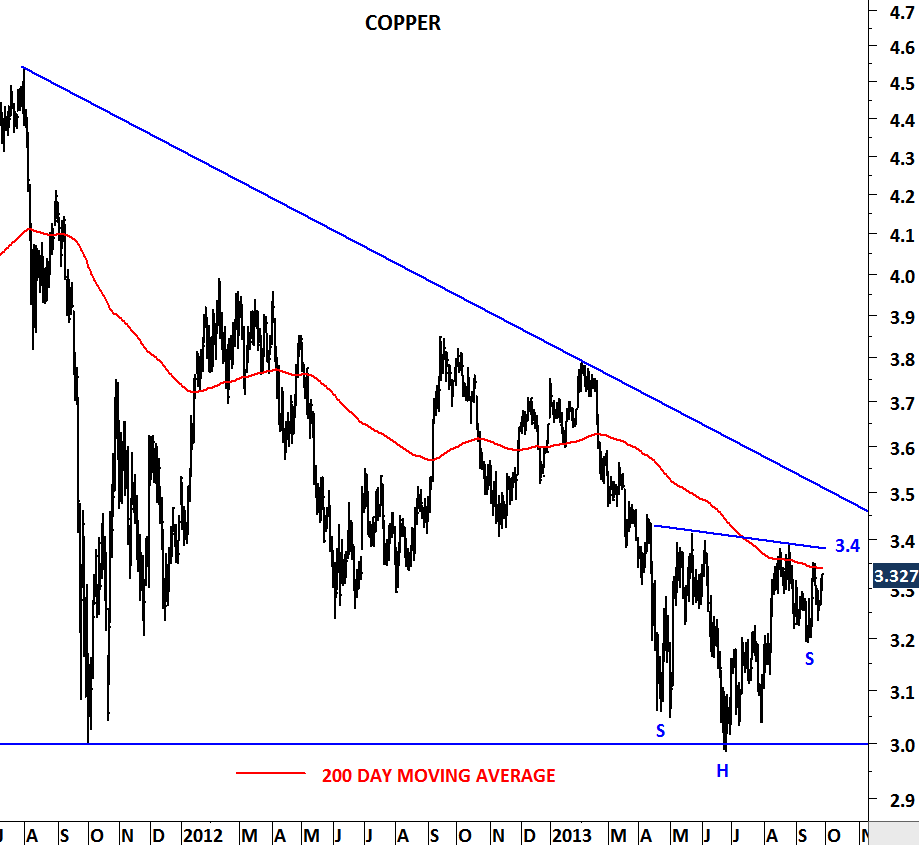
SPAIN IBEX 35 – ITALY MIBTEL – PORTUGAL PSI 20

It has been a challenging week for the equity markets. Especially in Europe, fears on Spain’s debt triggered heavy speculation in the equity and bond markets. Yields have jumped and equities sold-off. Weakness in Spain spread to Italy and Portugal. We have seen clear technical sell signals in Spain, Italy and Portugal. These were the weak markets of euro zone and as a result they were the first one to experience further set backs.

In this post I’m updating Spain, Italy and Portugal’s equity indices. On the 3rd of April, I reviewed all the European equity indices and since then there has been major breakdowns that needed to be revisited. Spain’s IBEX 35 index is now breaking down the 7 month-long consolidation range at 7,800 levels. Sideways consolidation was a symmetrical triangle and breakdowns from these type of continuation patterns are usually followed by weakness. Next support for IBEX 35 is at 6,700 levels.

Italy’s MIBTEL Index is also breaking down its sideways consolidation at 15,000 levels. 7 month-long choppy sideways consolidation is likely to be followed by a downtrend towards the next support at 12,300 levels.

Portugal’s PSI 20 index is another poor performer that is now breaking down its bearish wedge pattern. Unless the index moves back above 5,670-6,000 area, PSI 20 will experience more selling pressure.

CHINA SSE 50 INDEX & CHINA GDP

Yesterday markets were strong with the expectation of a better than expected Chinese GDP data for the Q1. Today markets were disappointed by the worse than expected data at 8.1% for the quarter. Expectation was around 8.3%-8.5% but 8.1% growth was clearly below expectations. Q4 2011 growth was at 8.9%. This is the lowest growth in almost 3 years and from the chart below you can see the downtrend over the past three years.

In this post I’m analyzing the China SSE 50 Index and the quarterly GDP growth for China. The two charts are self illustrative with their correlation and trending periods. Downtrends on the equity markets were accompanied by lower growth and vice versa. Major trend reversals (in this case price breaking above/below long-term moving average) on the equity index was a good indicator and confirmation of better/worse GDP growth.

Given that the SSE 50 Index is trending lower in a clear parallel trend channel since mid-2009, expecting a downward trend on GDP is reasonable. Though anticipating a reversal on GDP is more difficult. For this reason I will use SSE 50 Index as a leading indicator or a confirming indicator to expect higher growth in the world’s second biggest economy. Both 1 year-long moving average and the upper boundary of the downward trend channel are overlapping between 1,800 and 1,900, making this area a strong resistance. Before we see SSE 50 Index breaking above this resistance we should expect weak growth. We need to see confirmation in equity markets that usually anticipates the future of the economy.


EURO BUND & US 10 YEAR T-NOTE

It was mid-March when U.S. CPI data was higher than expected and everyone feared from a possible inflationary environment. Bonds sold-off and equities rallied with commodities. On the 17th of March I reviewed Euro Bund & 10 Year T-Note prices and concluded that it is still early to call for an inflationary environment and a major correction in govt. bonds. Both govt. bonds were testing their long-term moving averages (200-day) and were likely to rebound from these levels.

http://techcharts.wordpress.com/2012/03/17/euro-bund-us-10-year-t-note-2/

Since the last update bonds have rebounded sharply and deflation and RISK OFF environment is back again. Equities are weak and bonds are strong. Long-term uptrends are still intact BUT with one major warning; weekly RSI divergences! Though bonds are moving higher, momentum is not supportive of the last 8 months price action. Price is trying to move higher with weaker momentum. Watch govt. bonds with a positive bias and place an intermediate/long-term stop at the 200 day moving averages. For Euro Bund strong support is at 136 and for U.S. 10 Year T-Notes strong support is at 129 levels.

LIGHT CRUDE OIL

In my previous post on Light Crude Oil, I wrote about a possible flag formation forming on the price chart. It looks like I was a bit optimistic with my bullish forecast.

http://techcharts.wordpress.com/2012/03/26/light-crude-oil-4/

Price continued lower, broke down the 103.75 support level and reached the lower boundary of the trend channel at 100.8 level. This is the 3rd test of the strong support level at 100.80. In the first trading session after the holiday light crude is testing the strong support and trying to rebound. It is important to note that $98-$100 area is strong support where 100 & 200 day moving averages meet. Light crude oil continues to make higher highs and higher lows. Uptrend should remain intact as long as price holds above the 200 day moving average. In the next few days, we would like to see the price rebounding from the lower boundary of the trend channel to call for more strength.

SPAIN IBEX 35 INDEX & EUROPE

While most of the european markets are recovering or have been performing much better since the beginning of 2012, some had extremely poor performance. In this post I’m analyzing Spain’s IBEX 35 index and comparing it with other European country indices to see the ones that are recovering, performing better and worse. This should give us an intermediate-term overview of European equities performance. I believe if we need to rank the countries from poor performance to better performance (Spain, Portugal, Italy & Greece) should be in the poor performance category, (Switzerland, Sweden, Netherlands, Ireland, France, Finland, Belgium and Austria) should be in the recovering category and (Norway, Denmark, UK and Germany) should be in the better performance category.

If we analyze Spain’s IBEX 35 index, it has been pressured by the long-term moving average (200 day) and is now testing the lower side of its 8 months-long consolidation range. RSI failed to move above 50 levels in the past three attempts and price also failed to breach the long-term average. Now the question is will the index also break down the intermediate-term consolidation range? This will be answered by the market in the next few weeks. Unless we see a sharp reversal from the support at 7,800 level IBEX 35 can fall back to 2009 low levels at 6,700. Index should clear 8,800-9,200 area to be ranked in the recovering category.

WHEAT

On the 18th of March I analyzed Wheat continuous price and drew attention to a possible symmetrical triangle.

http://techcharts.wordpress.com/2012/03/18/wheat/

In the past one week price resumed its consolidation in this tight trading range. Volatility is still at an extreme low reading and price is now closer for a major breakout from a 2 month-long consolidation range. Keep wheat on your watch list for a possible breakout in the next few days. Boundaries of the consolidation range are 670 and 635. A breach above 670 will be extremely bullish for Wheat and target 700-750 area in a short period of time. Failure to reverse from 635 will put pressure on the downside.

COPPER

Since my last update on Copper on the 19th of March price resumed its consolidation in a tight range.

http://techcharts.wordpress.com/2012/03/19/copper-3/

This has increased the likelihood of a strong breakout from the possible symmetrical triangle. Given that Dr. Copper held above its long-term moving average (200 day moving average) and rebounded after each test, I would expect this breakout to occur on the upside. Current technical outlook suggests higher prices but again I would like to see the market confirming the direction of the breakout. For now we can conclude that we are very close to a major breakout. Boundaries of the symmetrical triangle should be watched closely. Breach above 395 will confirm an upward breakout and price will target 415-420 area in the short-term. Breach below 375 will be negative for Copper in the short-term.

LIGHT CRUDE OIL

Followers of Tech Charts who are interested in energy prices would remember my earlier posts on Light Crude Oil in February. I always like to use same templates on price charts while analyzing historical data. Looking at the same indicators puts you in sync with price movements. Band width indicator is a perfect example of repetitive cycles. Analyzing price data with this volatility indicator helped me to forecast strong trend periods on crude oil.

http://techcharts.wordpress.com/2012/02/10/light-crude-oil-3/

Technical conditions are suggesting another strong trend period for oil prices. Given that the price consolidated above 103.75 levels and formed a bullish flag, possibility of an upward spike is higher. In the short-term volatility  will increase. As we always do, we are going to wait for a confirmation of the breakout in one direction. An upward break above 109 levels will push prices towards $115 levels. Strong support is currently standing at $103.75 levels.

COPPER

Copper is now closer to a major breakout. Since my last analysis on Dr. Copper on the 26th of February, price remained in a tight consolidation range without any directional movement.

http://techcharts.wordpress.com/2012/02/26/copper-2/

As price have spent more time in this congestion area with low volatility readings, a breakout in the following days should occur. The fact that copper price held above its 200 day moving average, chances of an upward breakout is higher. Though we would like to see decisive breakout in either direction for confirmation. Two important levels to watch as a support; 370 level and as a resistance 400 level.

DOW JONES INDUSTRIAL AVERAGE

In the past few weeks we have been reading divided opinions on equity market performance. There is definitely no consensus on the bull market or the bear market. I read several articles suggesting it’s time for a stock market correction supported by reasonable arguments and several suggesting it’s time to buy equities. When public opinion is divided as it is in today’s market conditions, it means the markets are actually in a “corrective period”. Because it is the bull or bear market that has a direction and as a result a consensus. A trendless market doesn’t create a firm public opinion. You might ask what kind of “corrective period” is this that took us from 7,000 levels to 13,000 levels? Well the chart above puts these arguments into perspective and helps you understand and calculate the odds of both arguments happening in the following months.

Dow Jones Industrial Average is in a long-term correction. It is a similar correction to the one the index experienced between 1965 and 1982. At that time Dow Jones Industrial Average consolidated between 1,067 and 570 levels for 17 years! Dow Jones Industrial has been consolidating in a wide range since the beginning of 1999. And in this consolidation period it is now approaching to the upper side of its range. When compared with 2009 levels when the index was around 7,000 levels, market is now overextended and close to 14,000 levels.

So the arguments suggesting higher prices are betting that Dow Jones Industrial Average has completed its long-term correction and is likely to break above historical high levels and move to new all time highs.

Arguments suggesting a possible stock market correction are betting that the long-term consolidation is not over yet and the index is closer to its upper boundary which should eventually push prices lower.

If you were to make a decision by looking at this long-term chart  which argument would you give more weight?