US DOLLAR/INDONESIAN RUPIAH
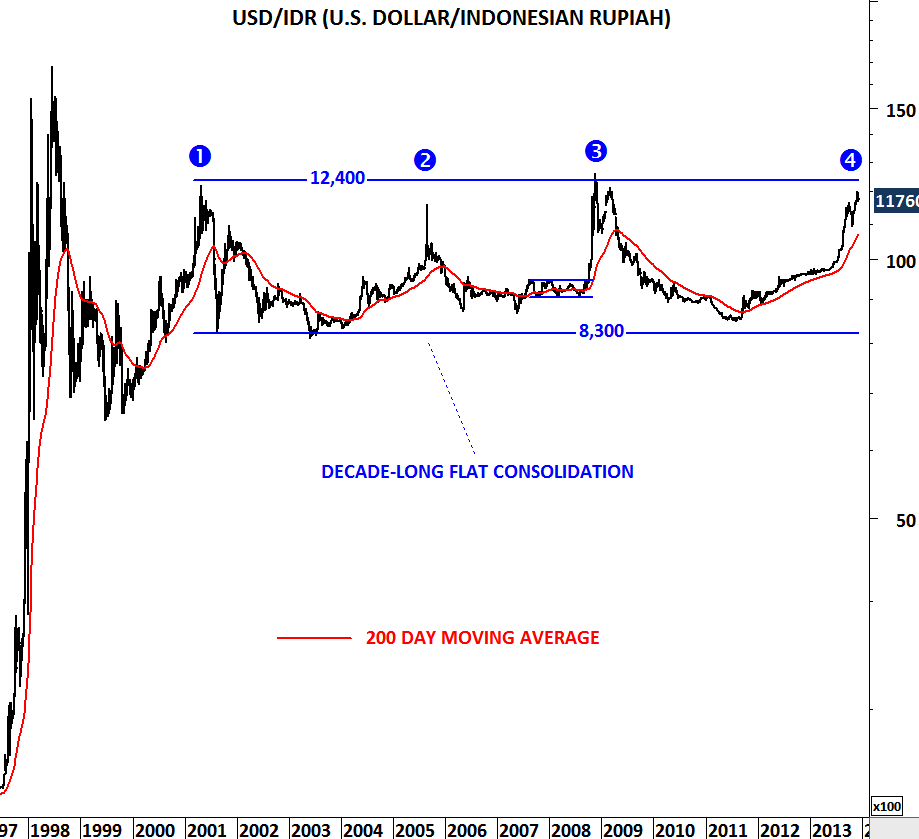
Indonesian rupiah had its share from the weakness in emerging market currencies. Over the past two years Rupiah weakened against the U.S. dollar similar to earlier price depreciation that took the cross rate from the lower boundary of its long-term consolidation to test the upper boundary. Fluctuations were between 8,300 and 12,400 levels. It is now the 4th time that the USD/IDR is testing its decade-long trend resistance. Price chart suggests Rupiah strength against the U.S. dollar, should the history repeats itself. Until we see a decisive breakout above 12,400 levels, we should expect reversion to the mean – a breath-taking period after the sharp depreciation in IDR.