GLOBAL EQUITY MARKETS – September 26, 2020
Announcement:
On the 27th of September I will be making a presentation at the Online Traders Summit. I will discuss long-term aspects of classical charting principles with examples from Global Equity & FX markets. If you want to register (FREE) for the 2 day event, you can find the link here. I hope you can make it. I'm excited to hear and learn from several other great presenters.

REVIEW
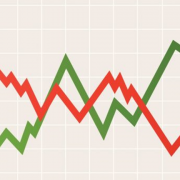
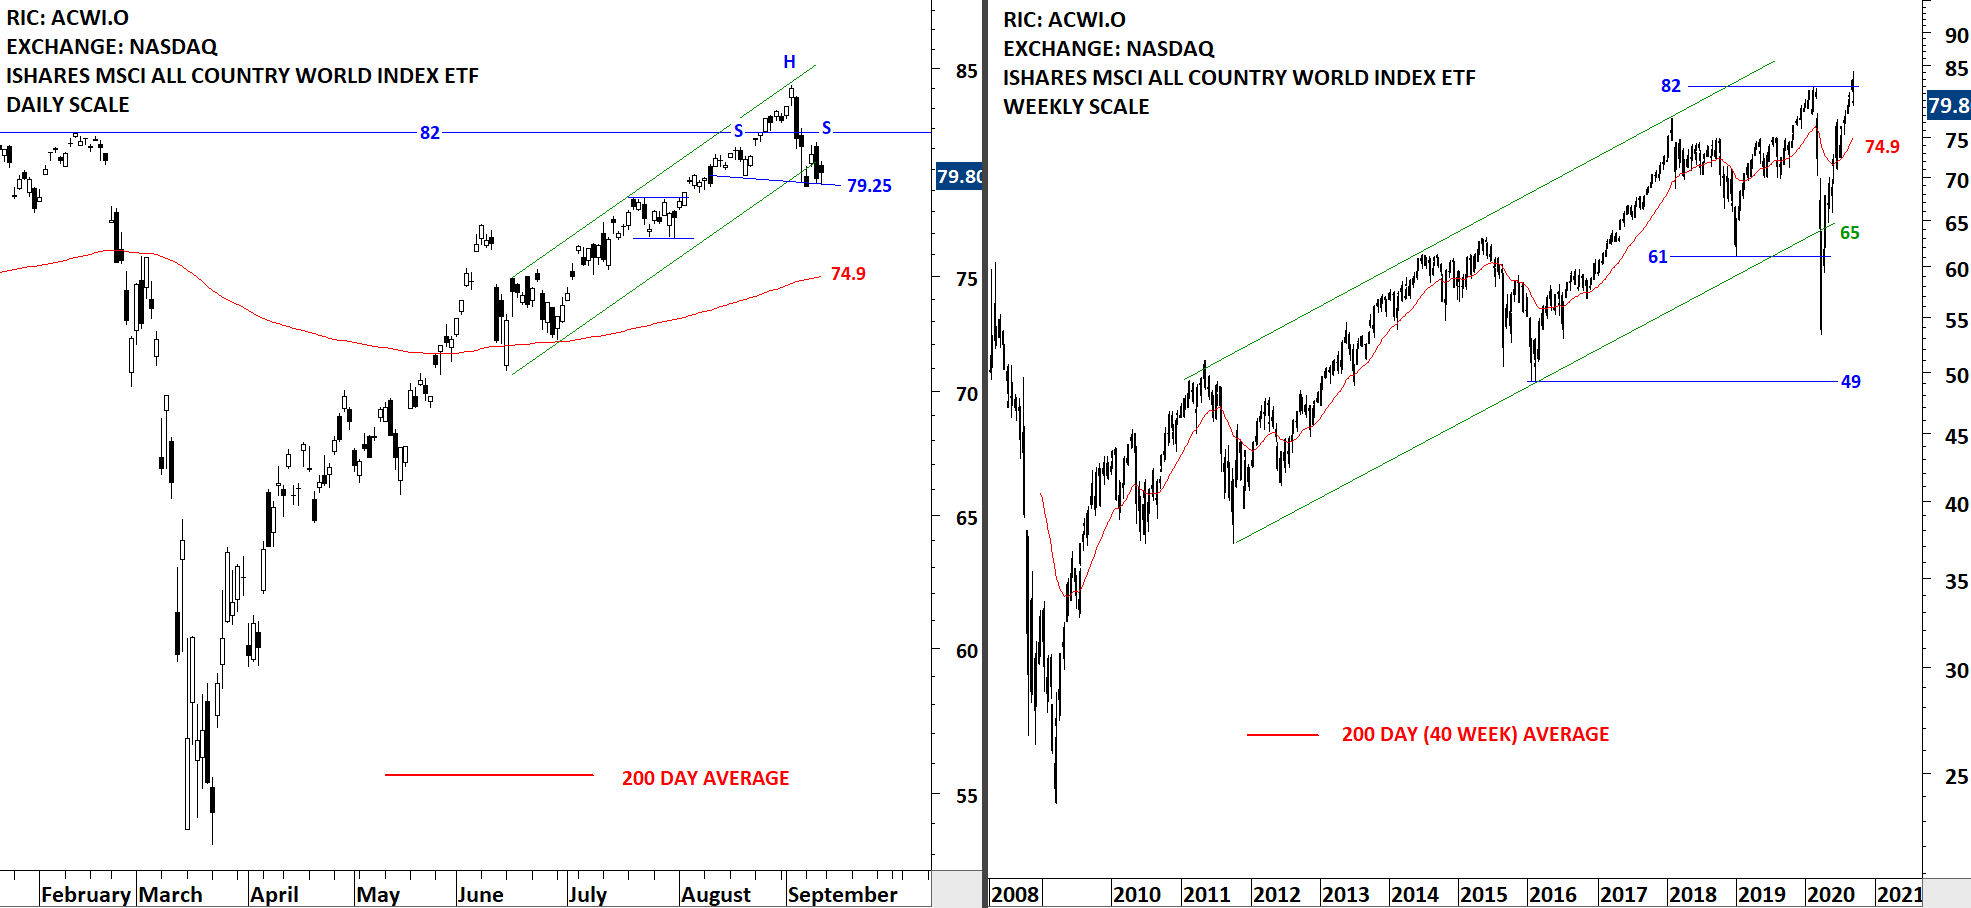
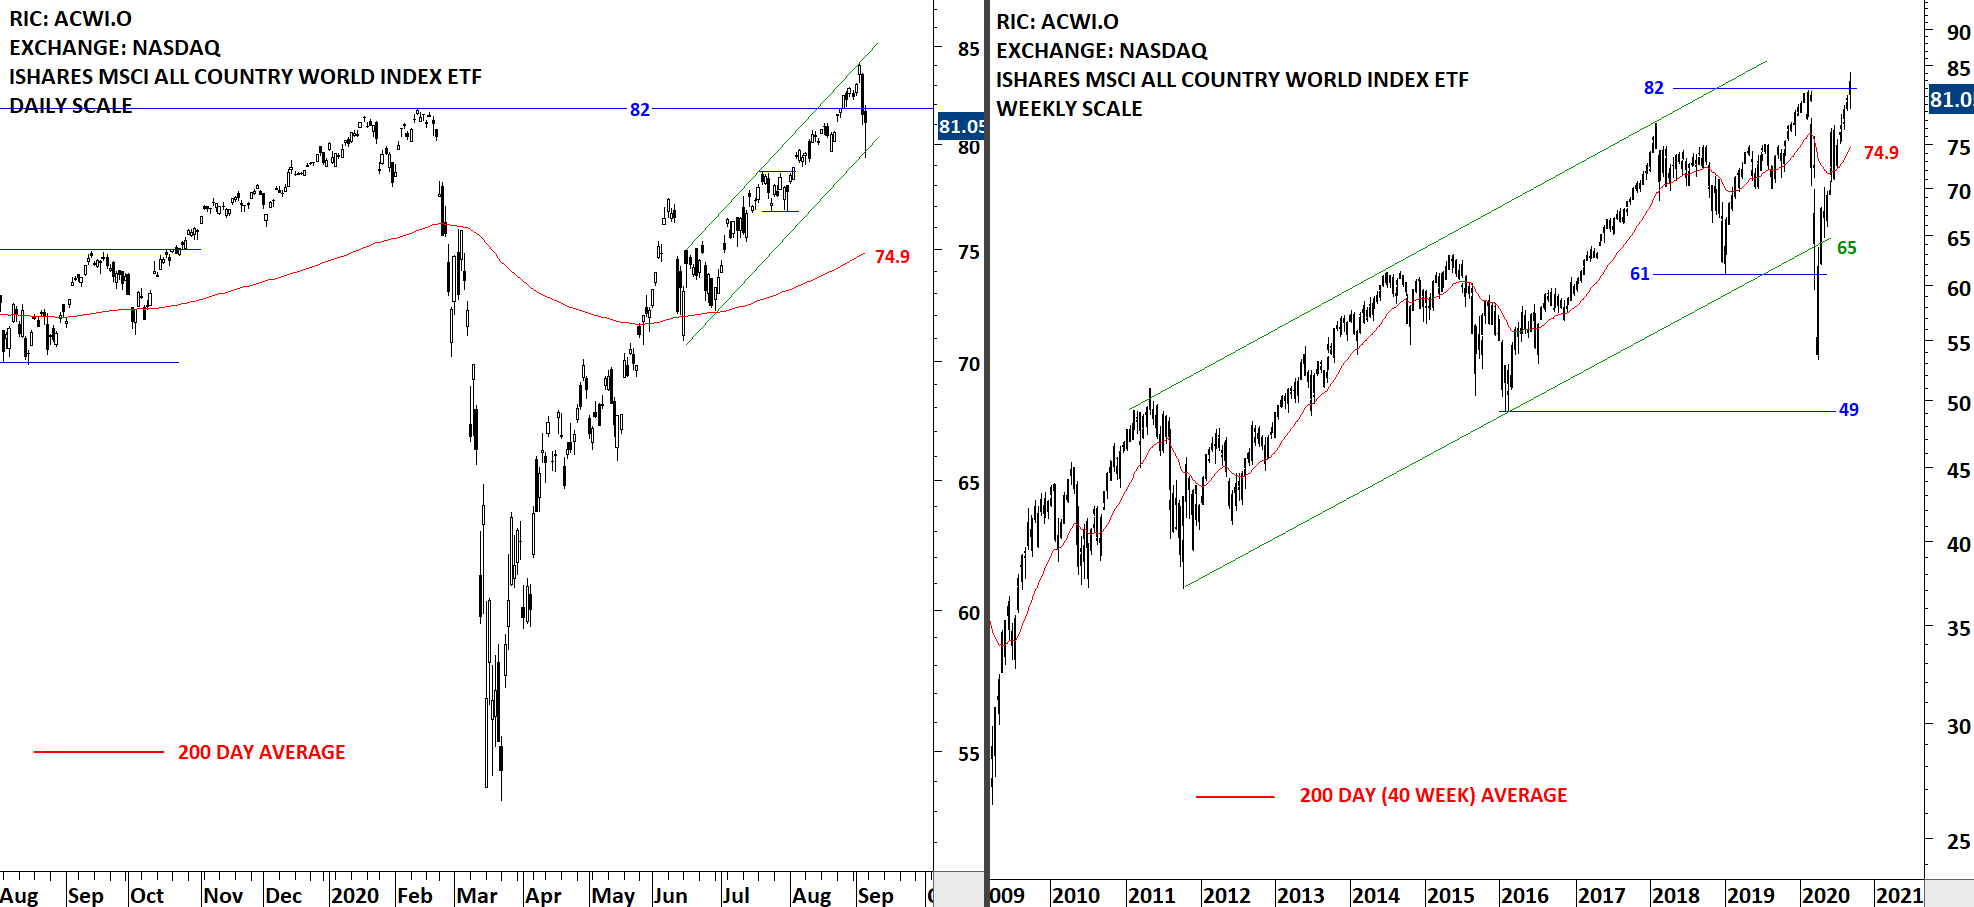
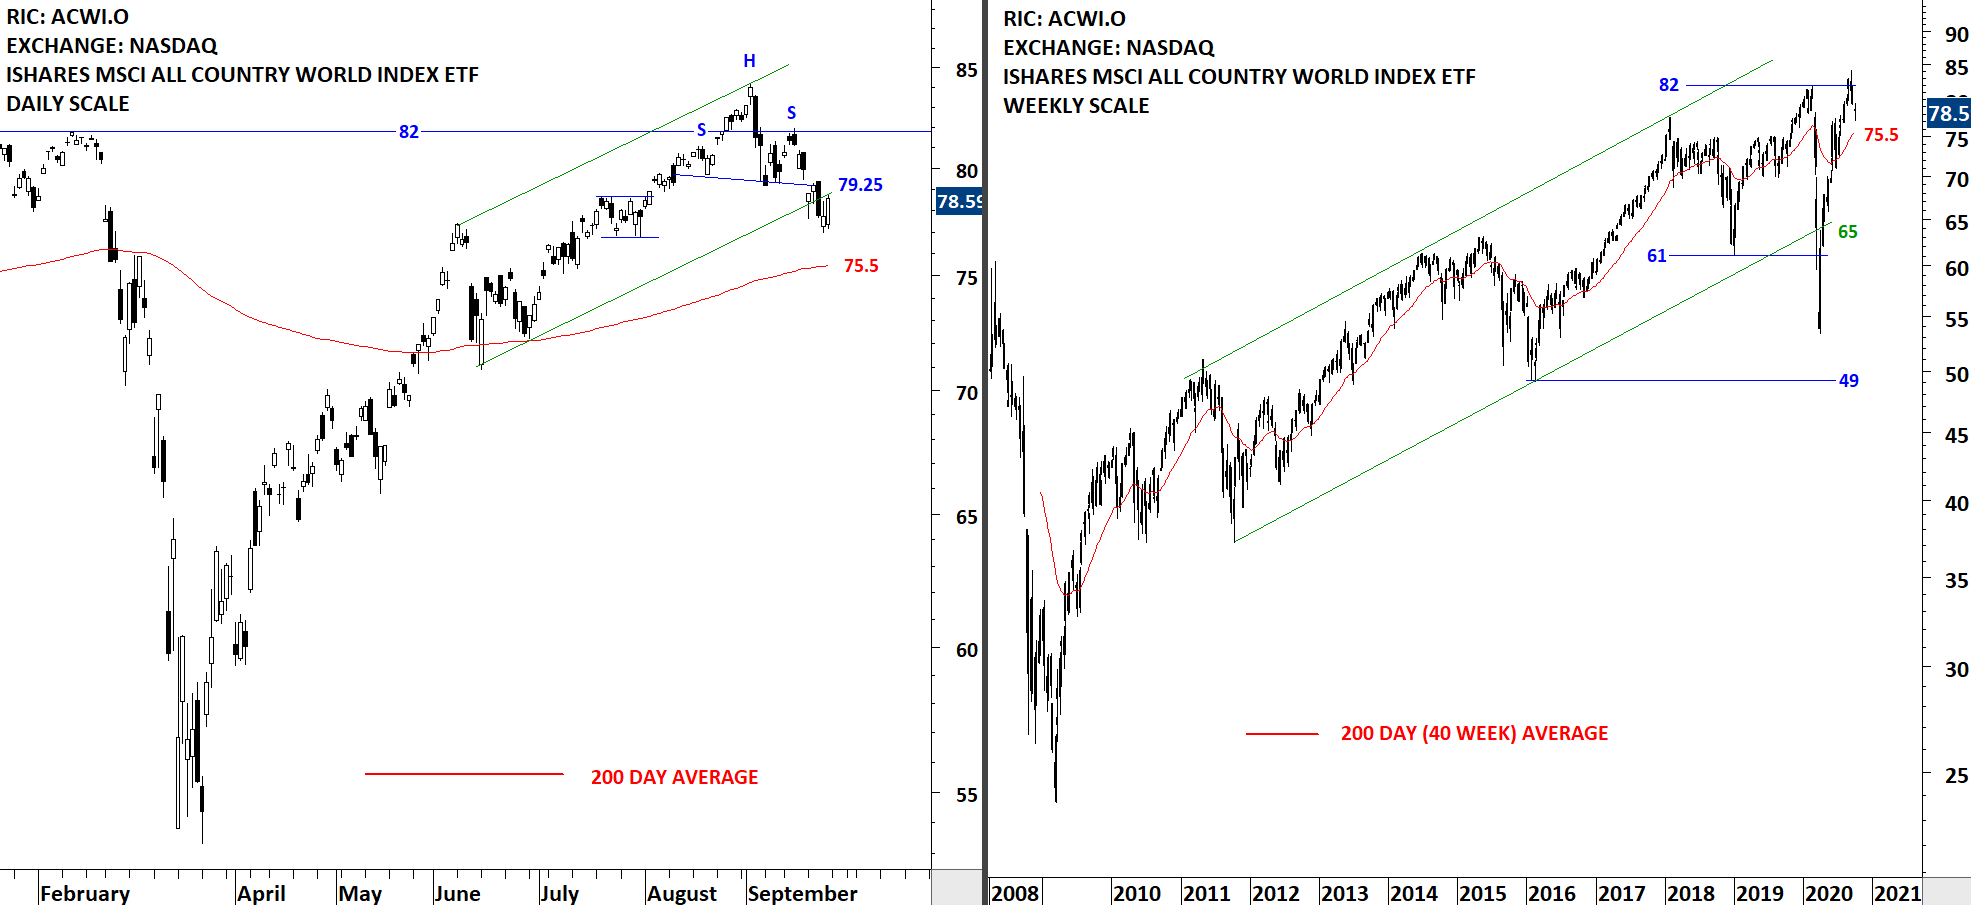
The benchmark for the Global equity markets performance, the iShares MSCI All Country World Index ETF (ACWI.O) broke down the neckline of a possible short-term H&S top. The 200-day average is acting as support at 75.5 levels. Please note that this is a short-term chart pattern and the shorter -term the chart pattern the more prone it is to failure or morphing (eventually becoming part of a larger scale chart pattern). Friday's price action was strong and reversed back to close slightly below the neckline. The following week will offer more insight of the H&S is successful and price will test the 200-day average. Several equity benchmarks have already reached their 200-day averages during the latest correction. As we are still above the 200-day average for the ACWI ETF, It is difficult for me to put my bear market cap on. I continue to view any correction or weakness in the market as reversion to the mean.
 Read More