GLOBAL EQUITY MARKETS – January 9, 2021
REVIEW
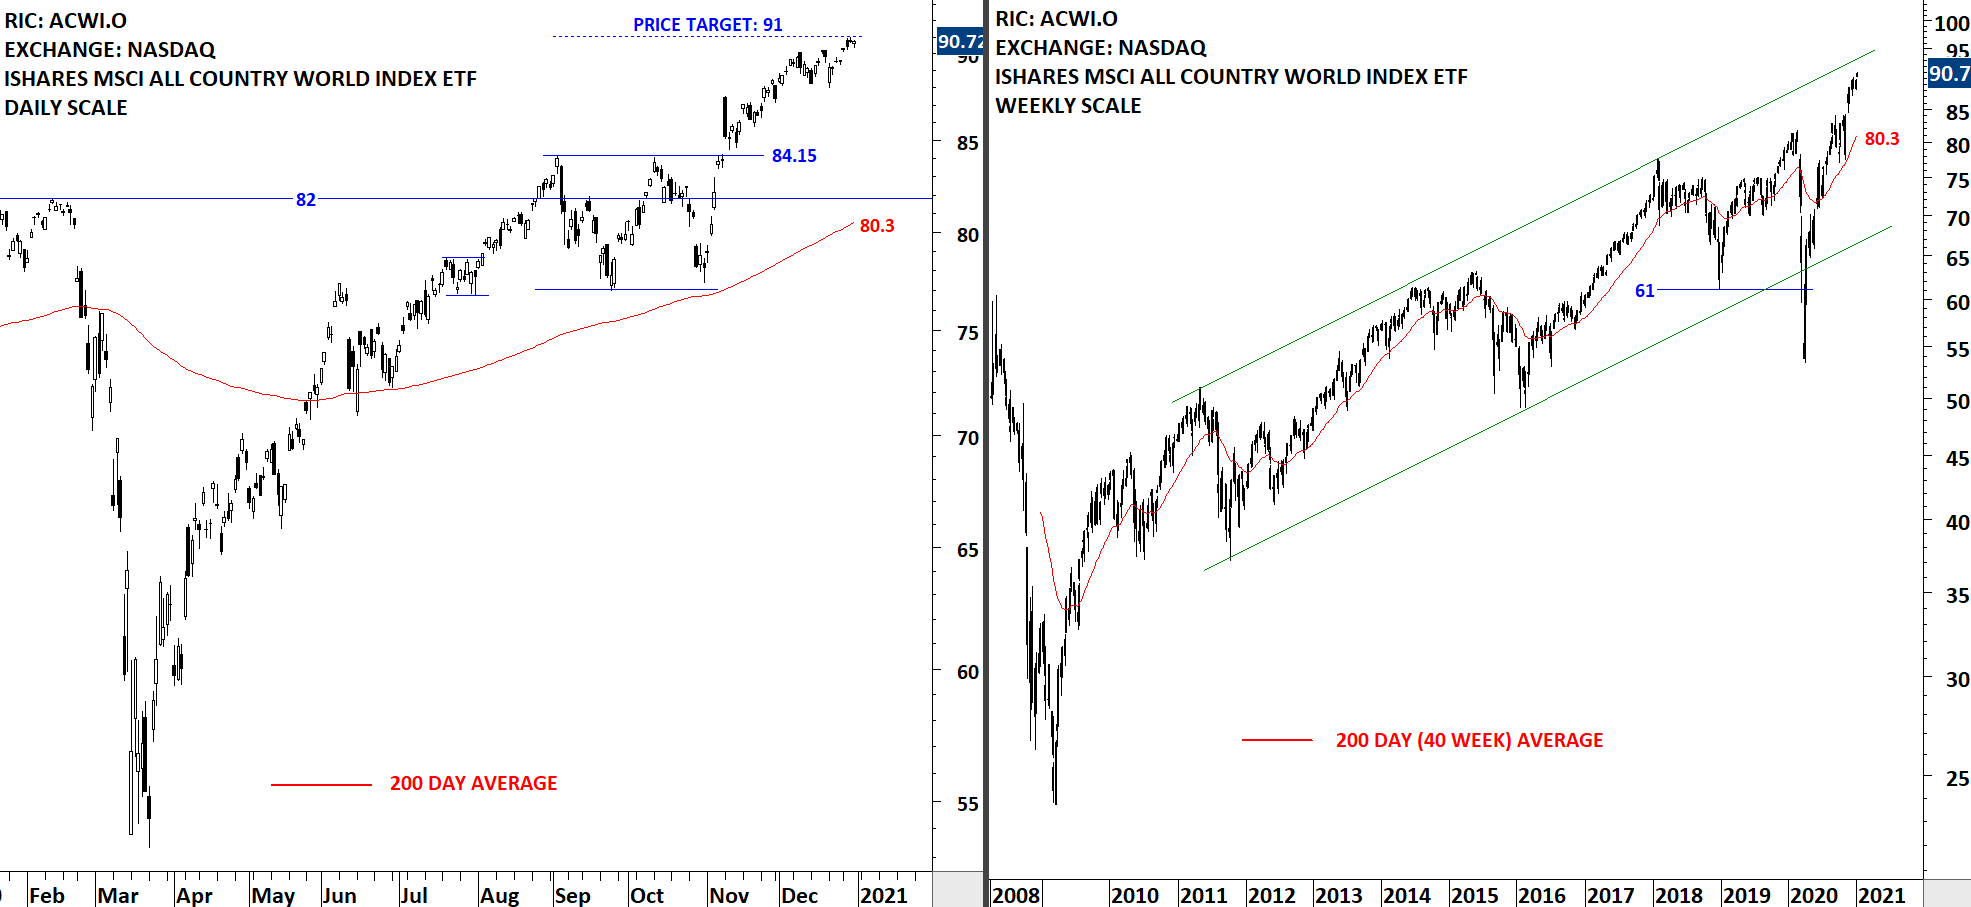
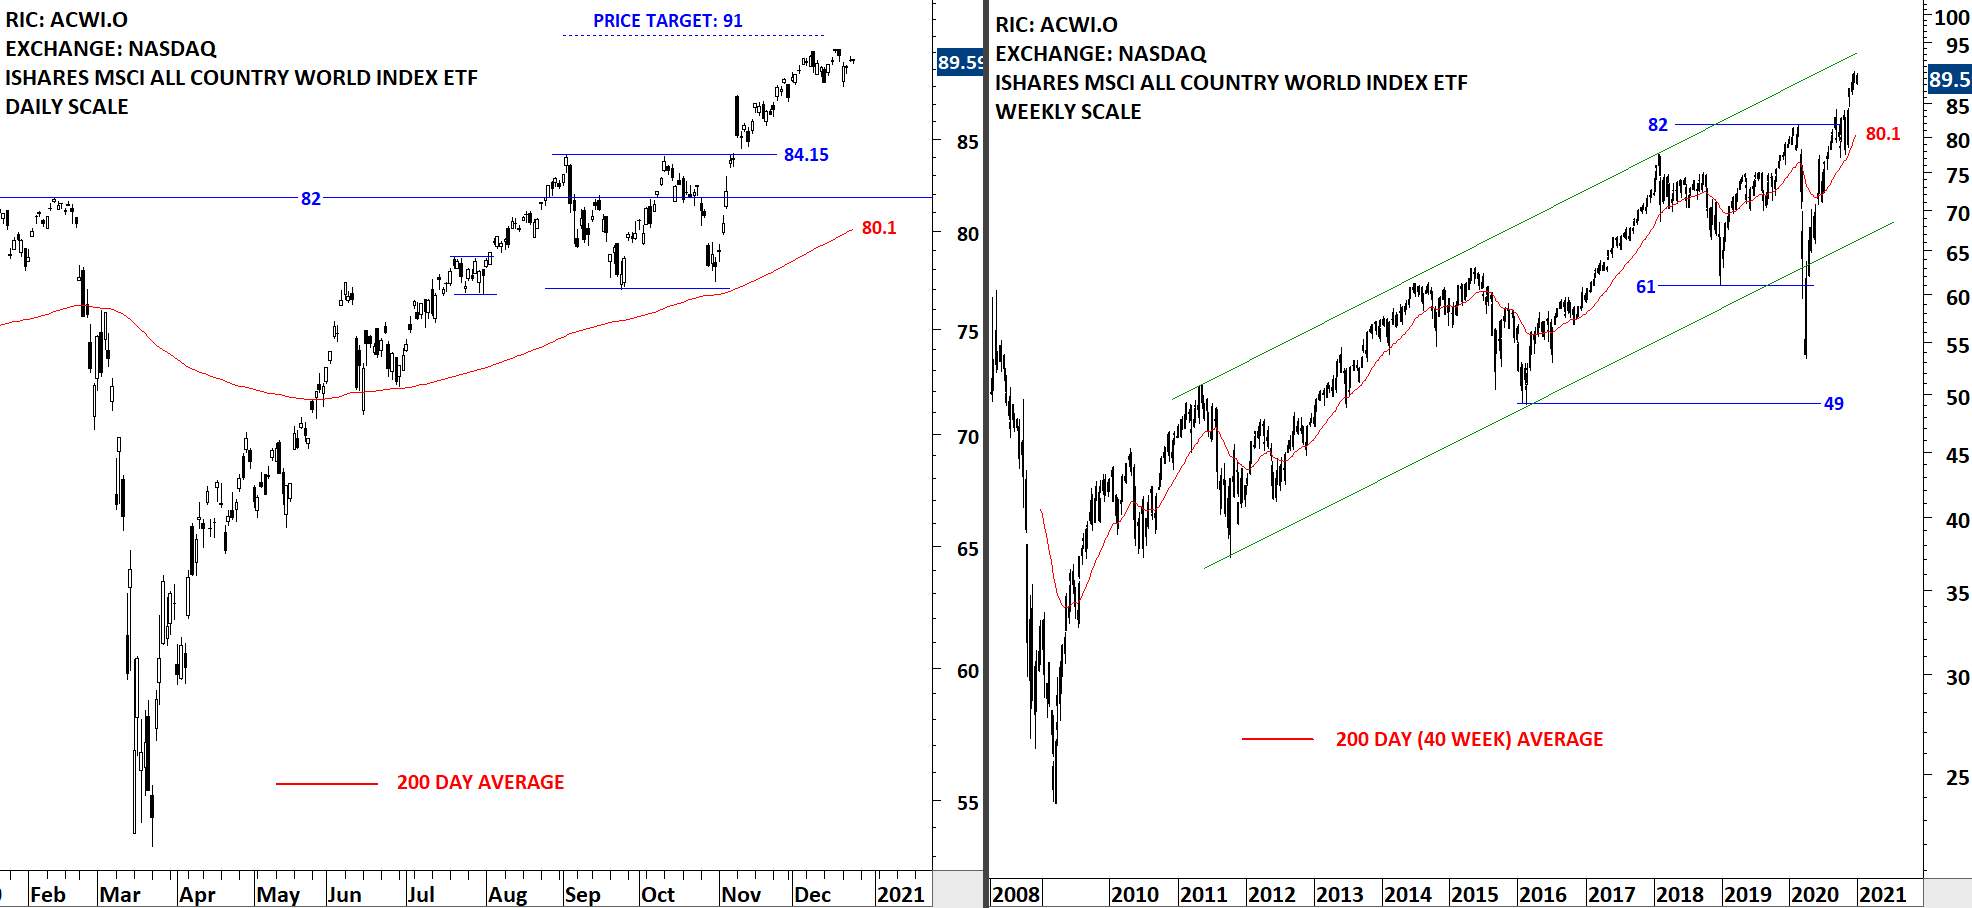
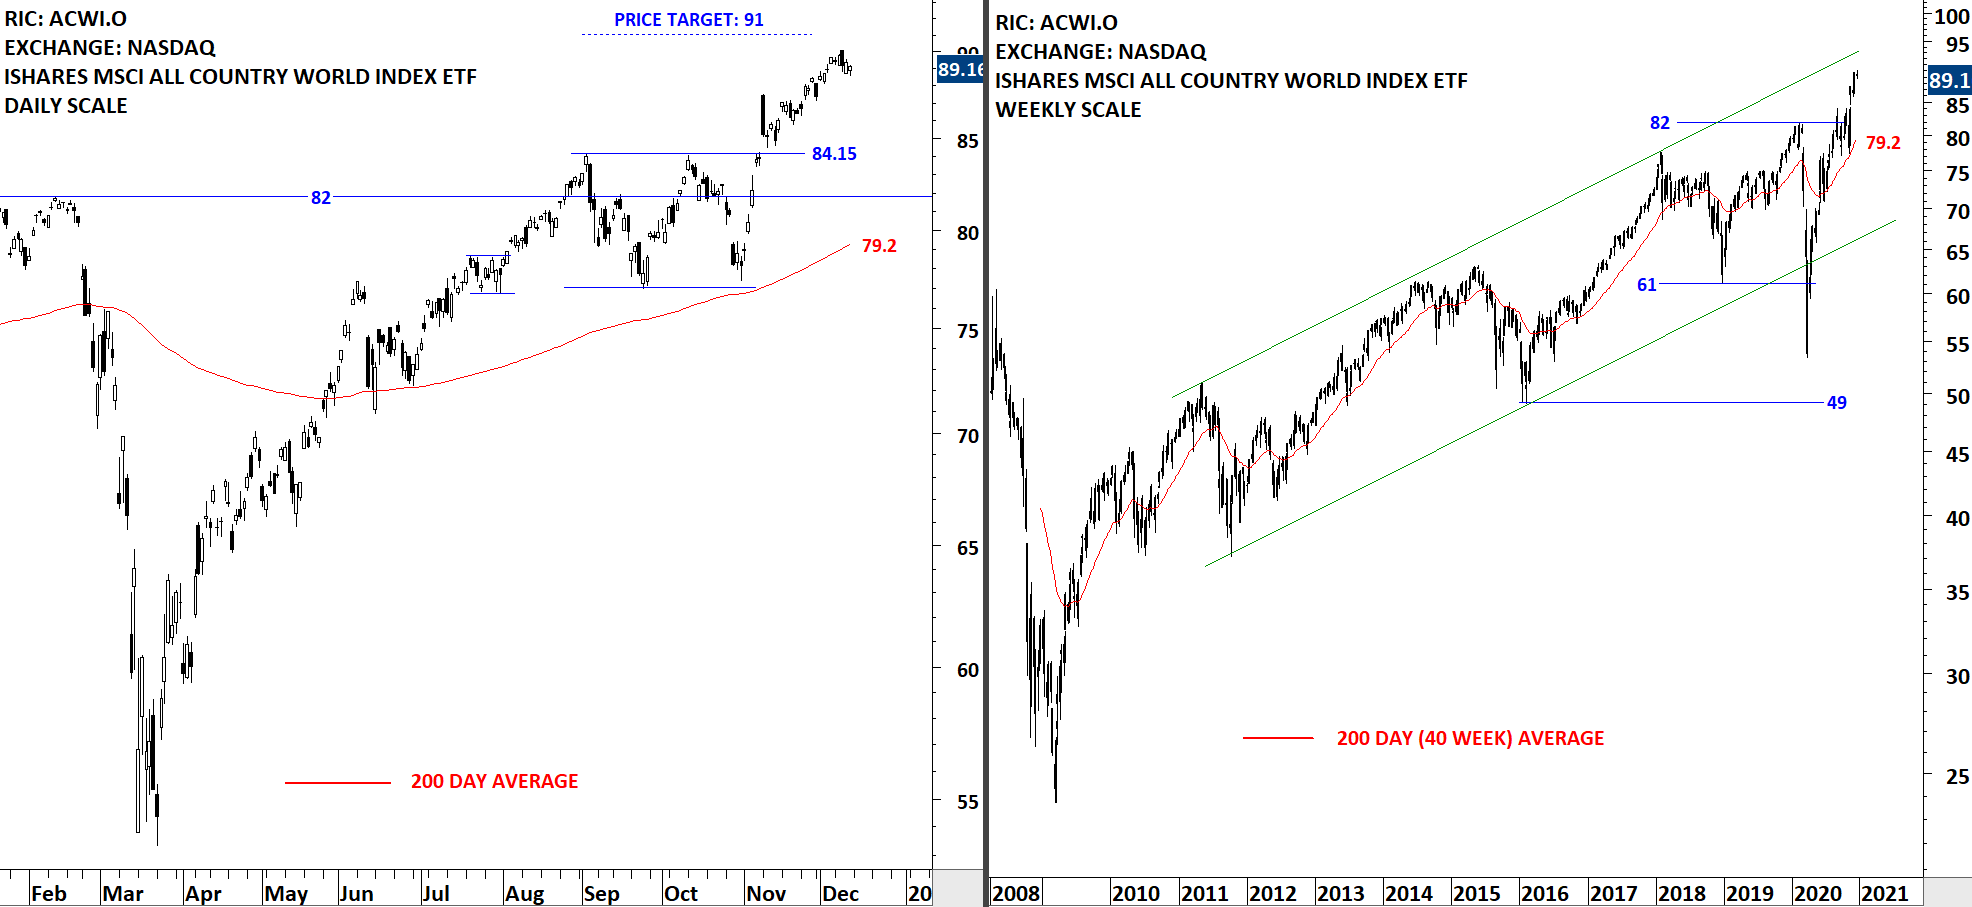
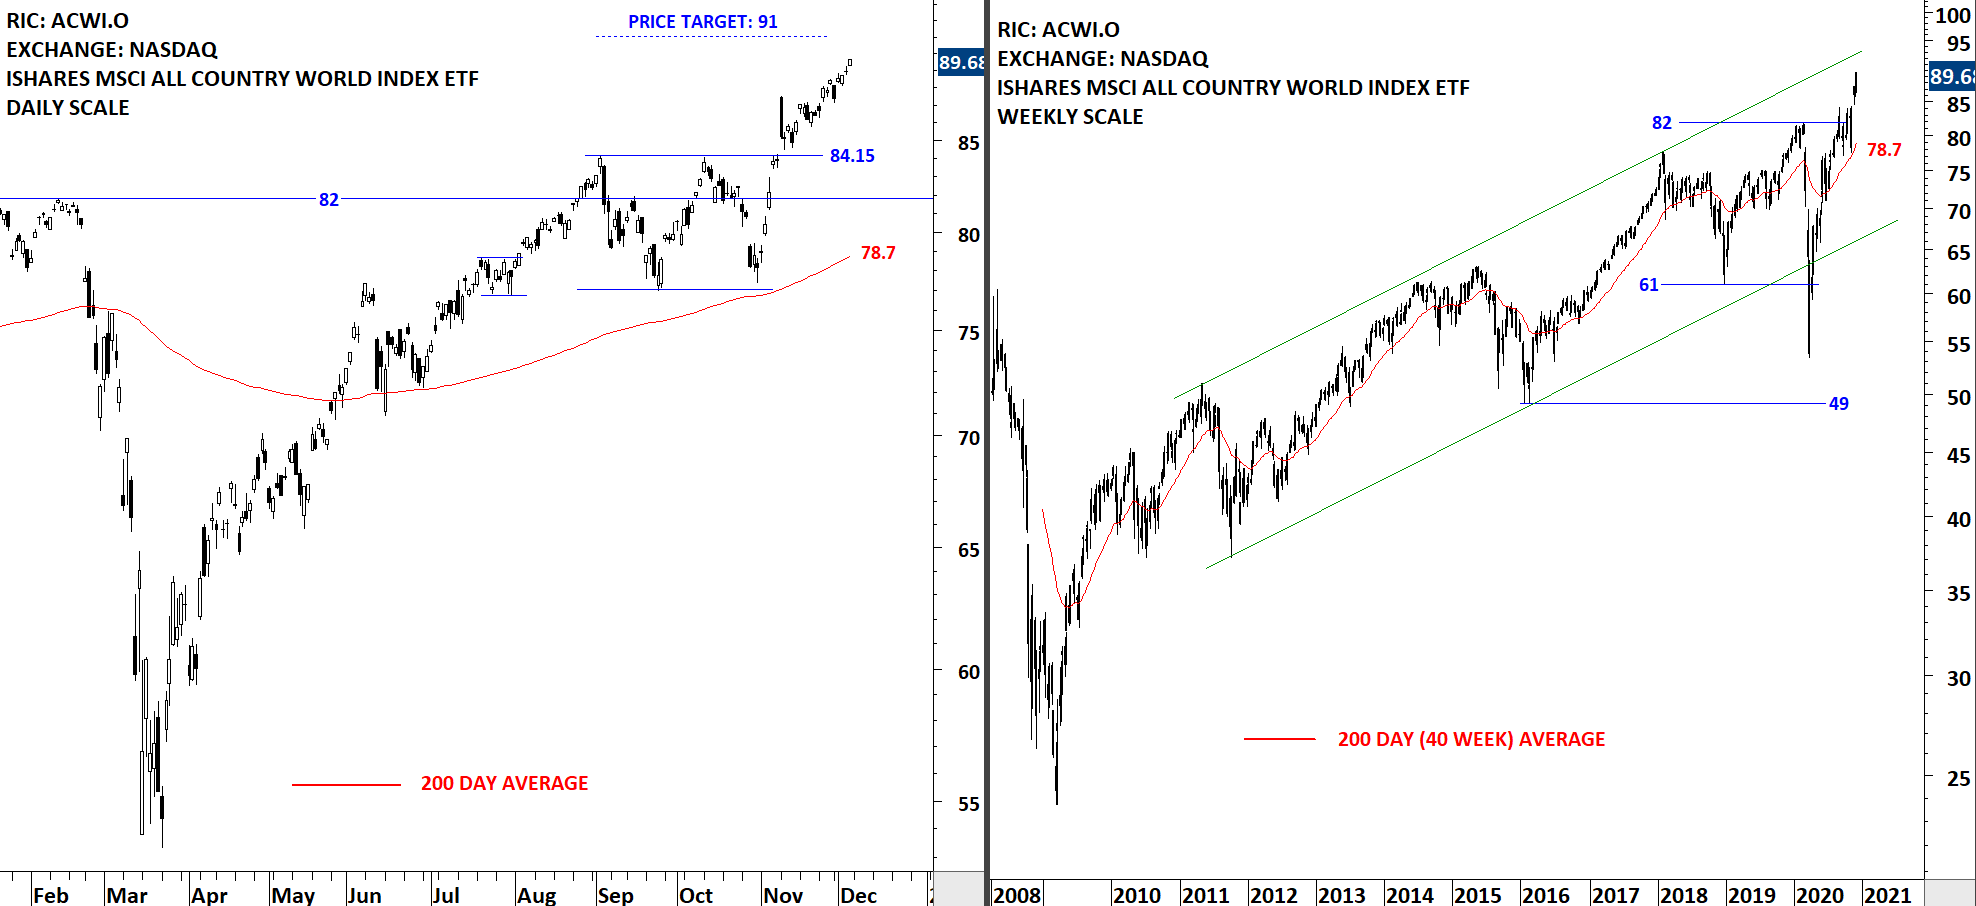
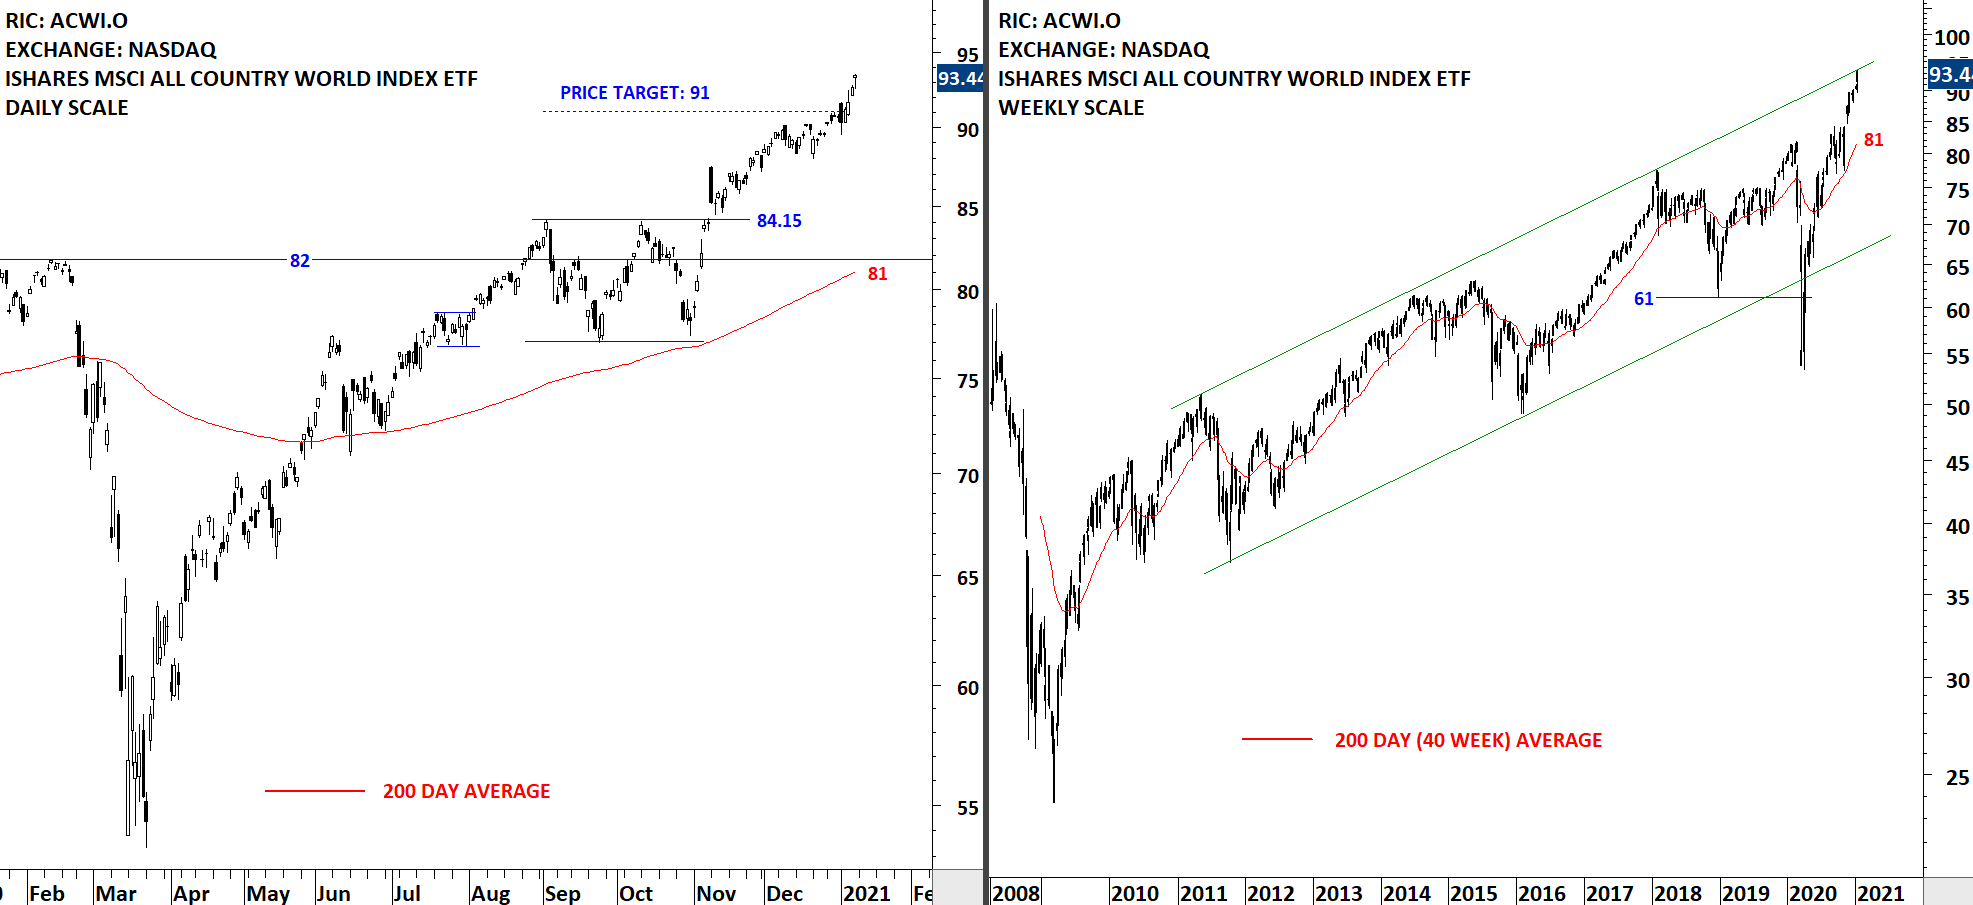
The benchmark for the Global equity markets performance, the iShares MSCI All Country World Index ETF (ACWI.O) resumed its uptrend past the rectangle chart pattern price target at 91 levels. On the weekly scale price chart of the ETF is also close to the upper boundary of the long-term uptrend channel. During any pullback 84.15 will act as support. The 200-day moving average, which I utilize as a trend filter, is rising as well, now at 81 levels. Volatility is picking up from low levels. Volatility does not have direction. Acceleration of the uptrend or a sharp correction; both can result in an increase in volatility. Uptrend is intact and there is no reversal chart pattern on daily scale price chart.
 Read More