GLOBAL EQUITY MARKETS – July 4, 2020
REVIEW
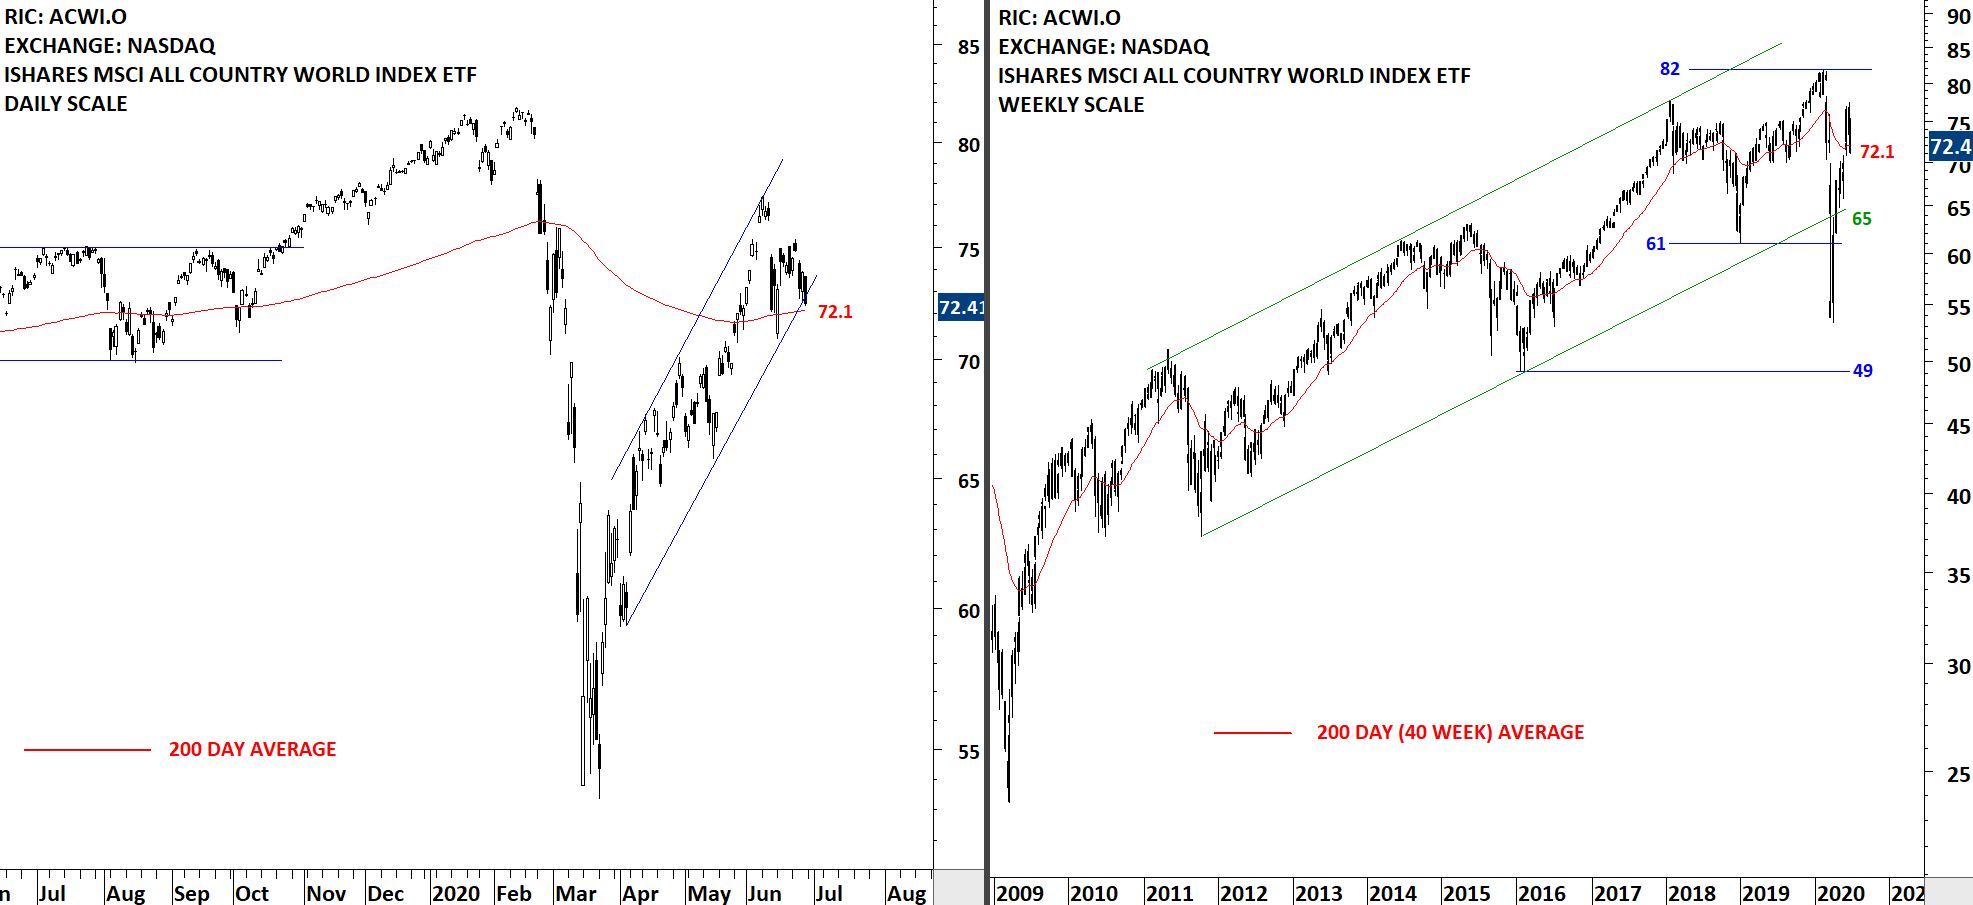
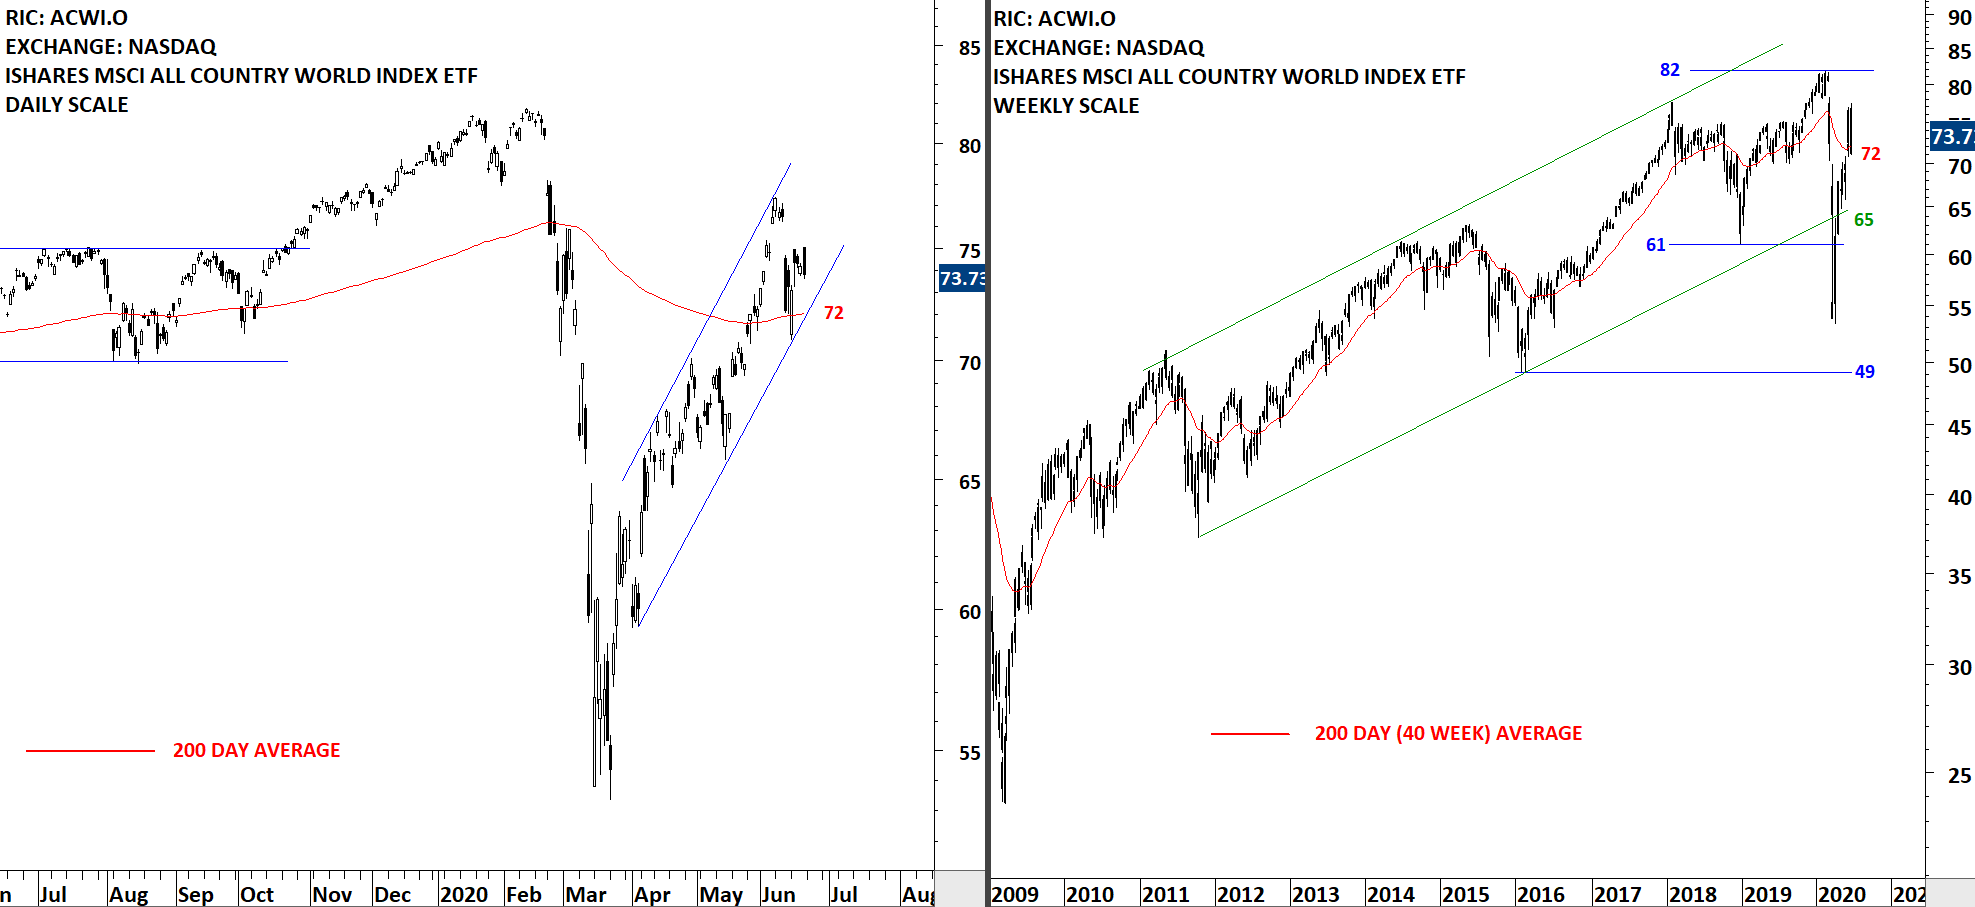
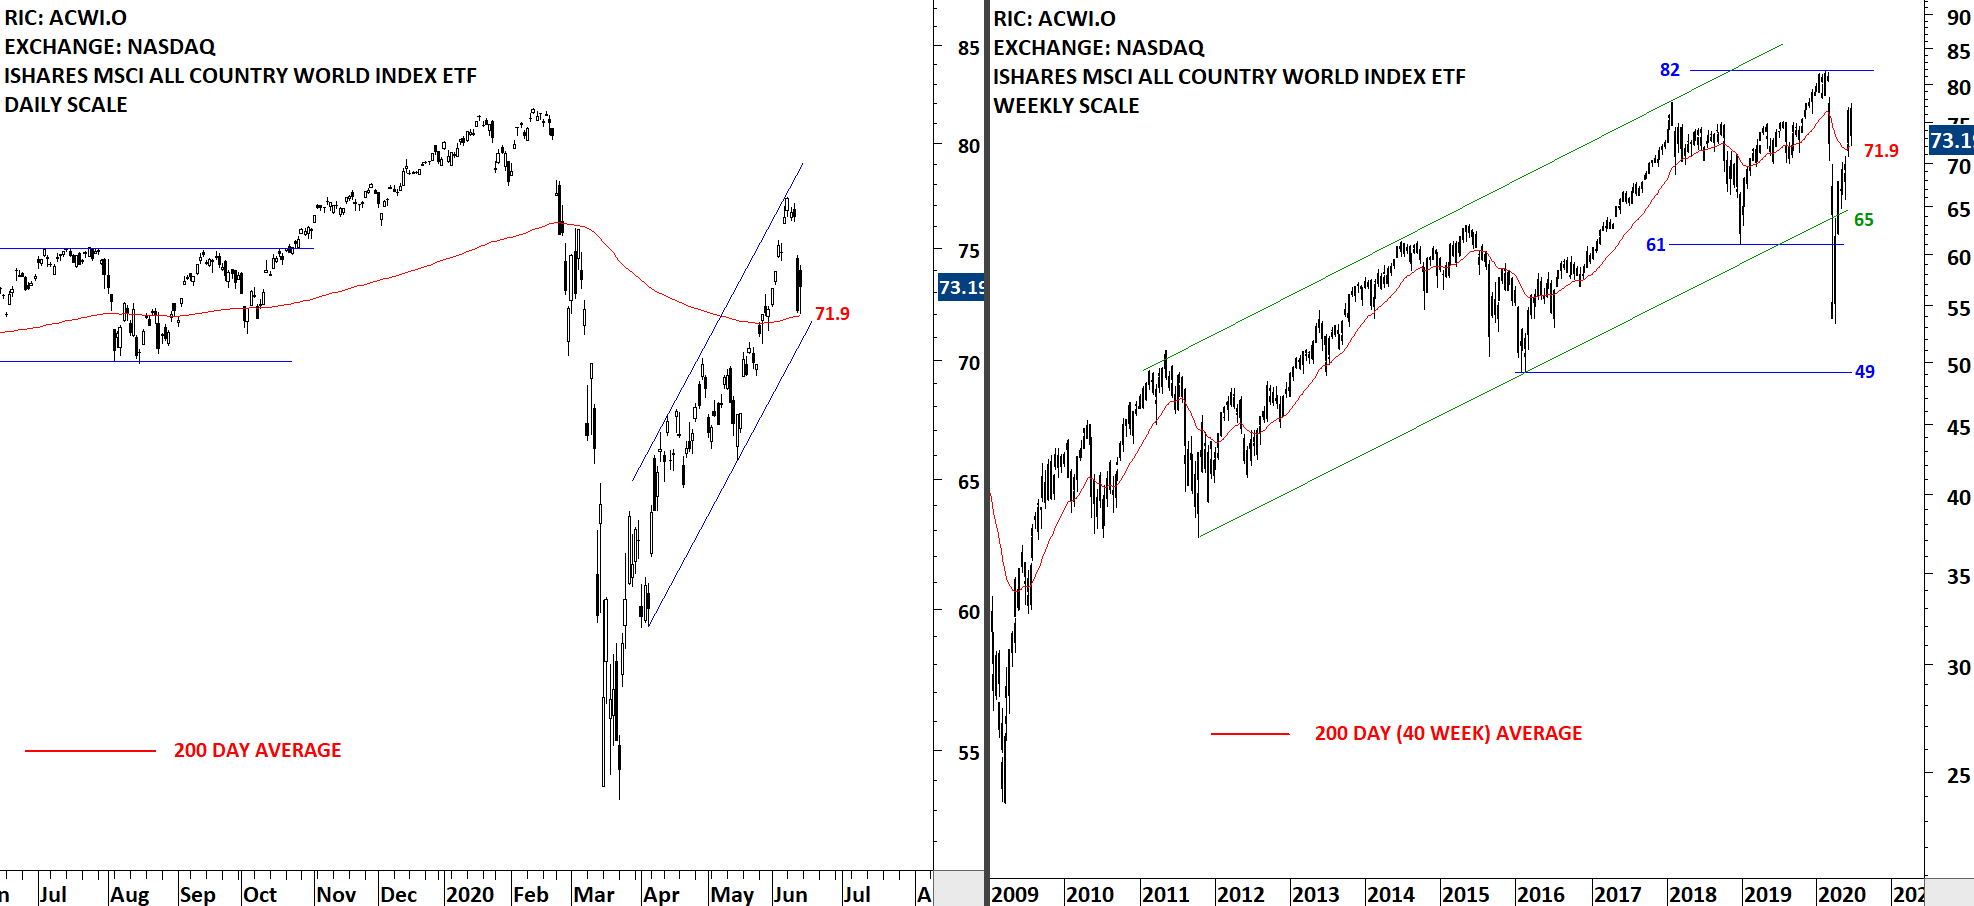
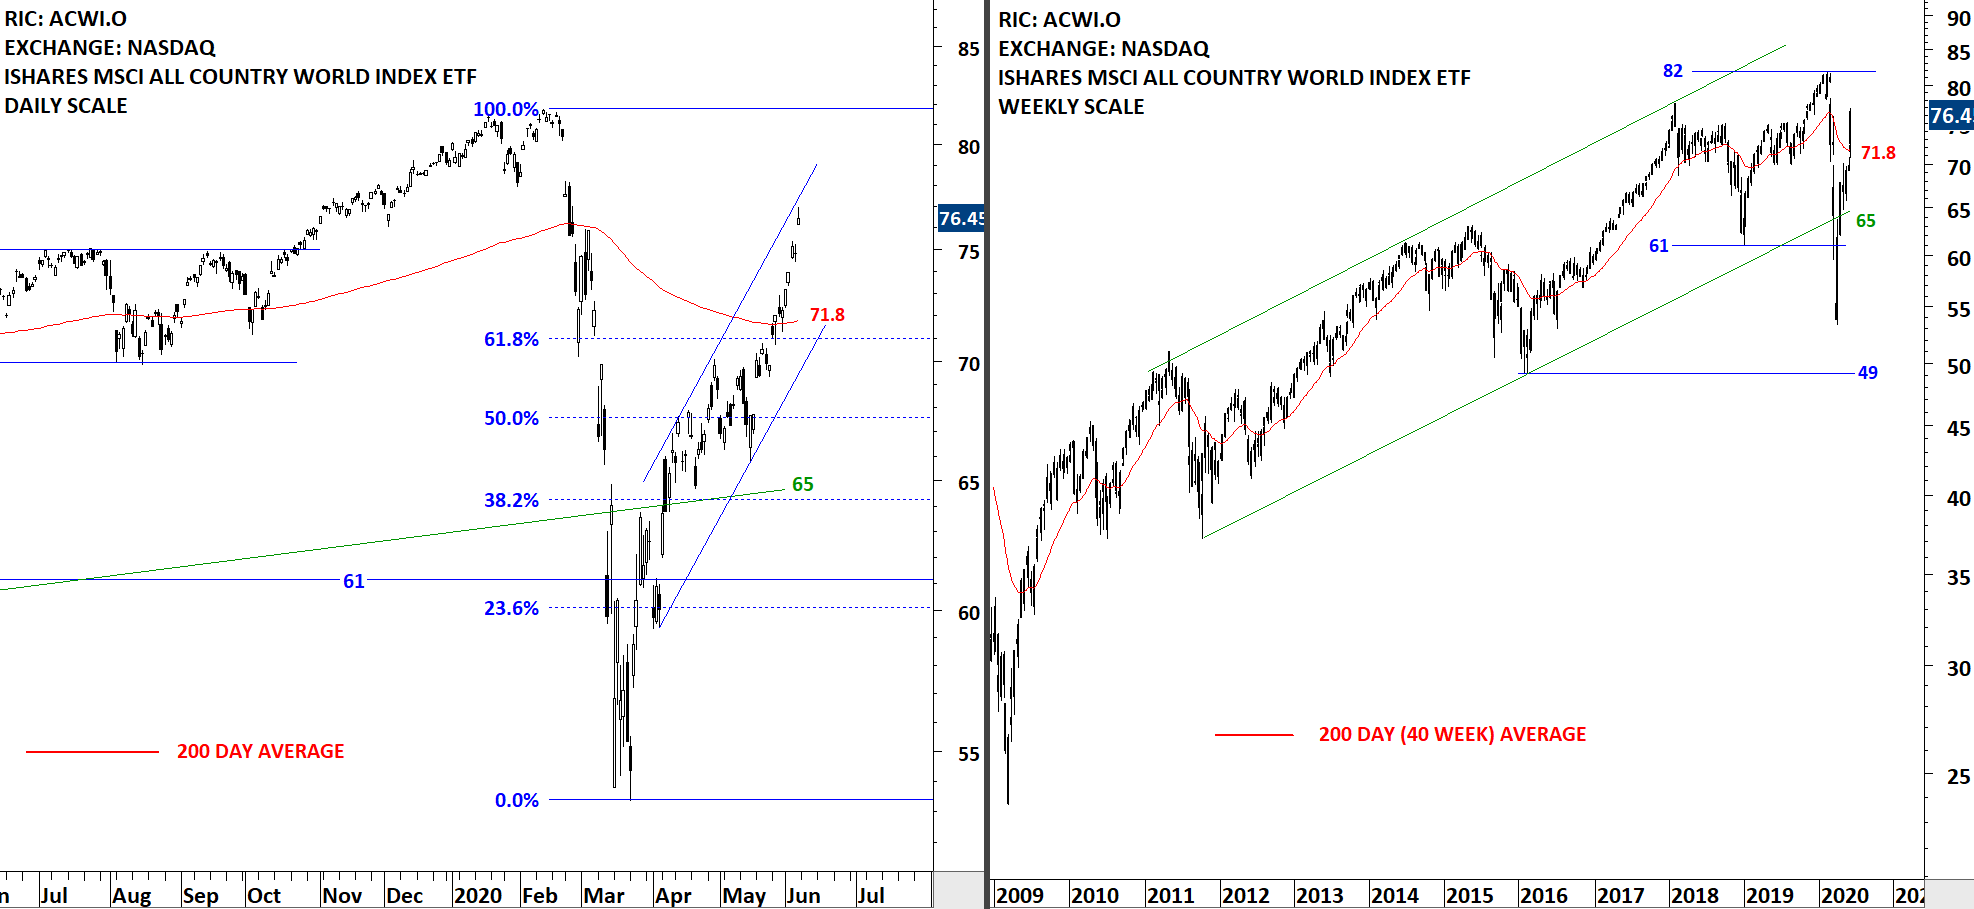
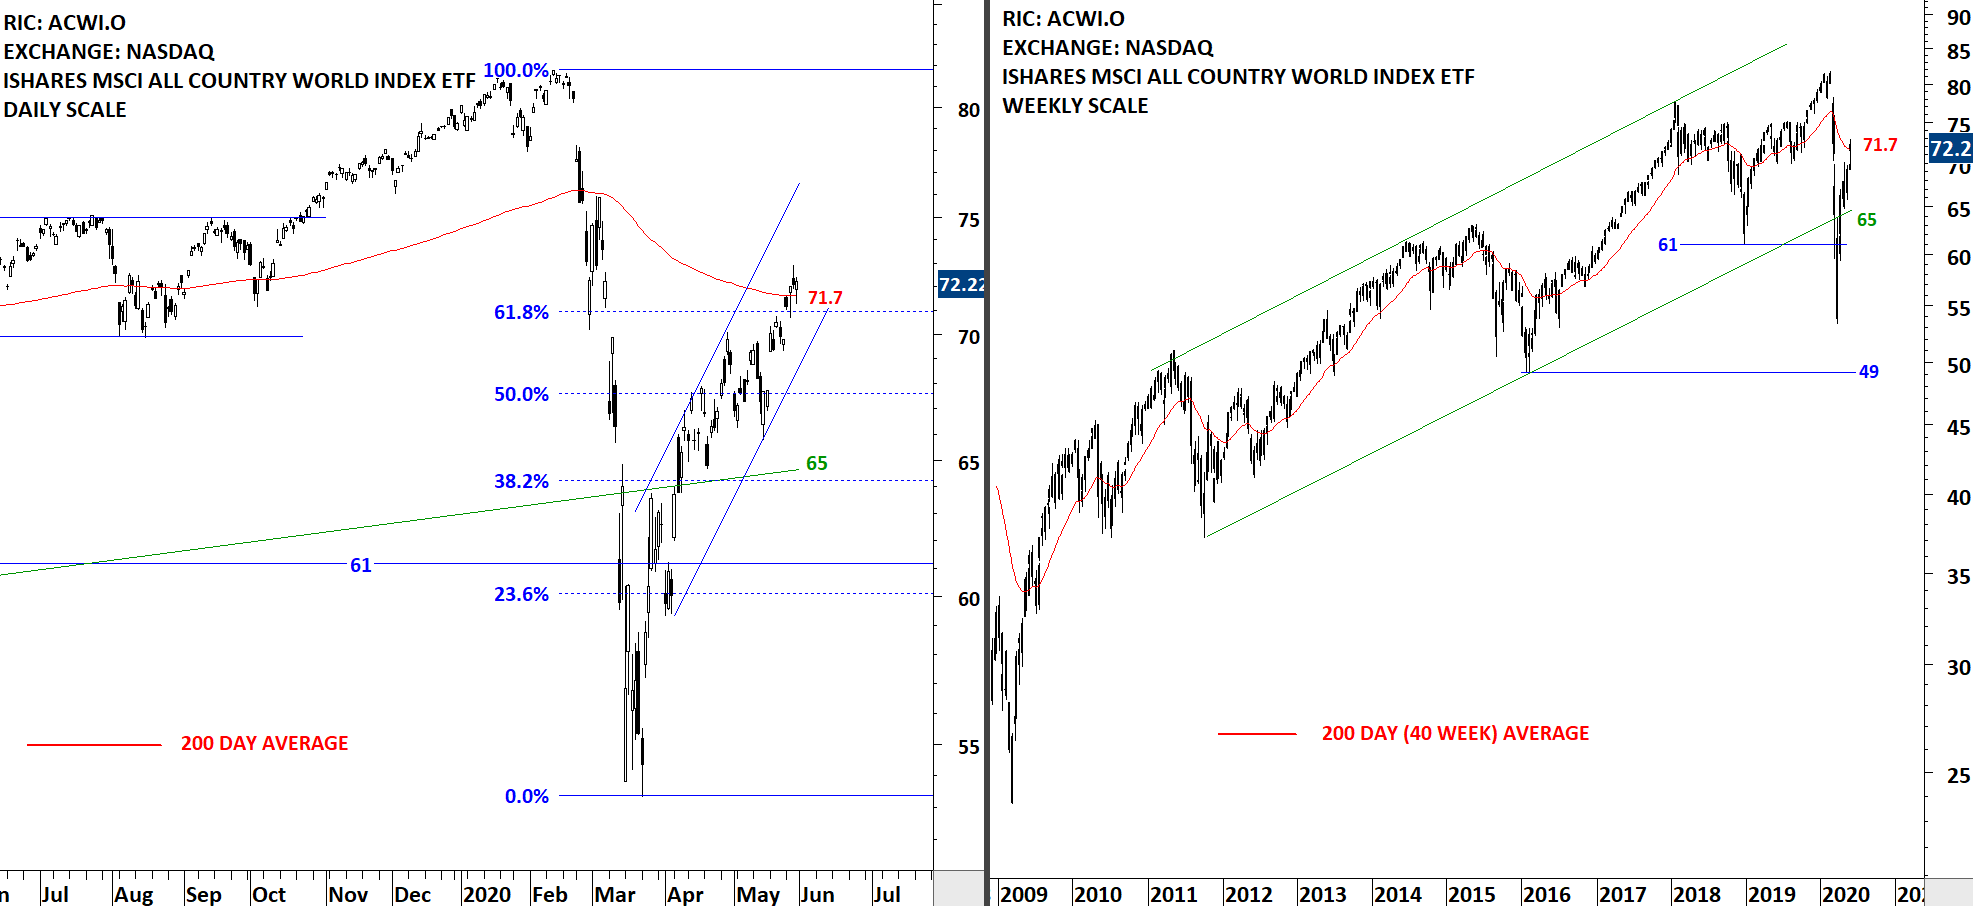
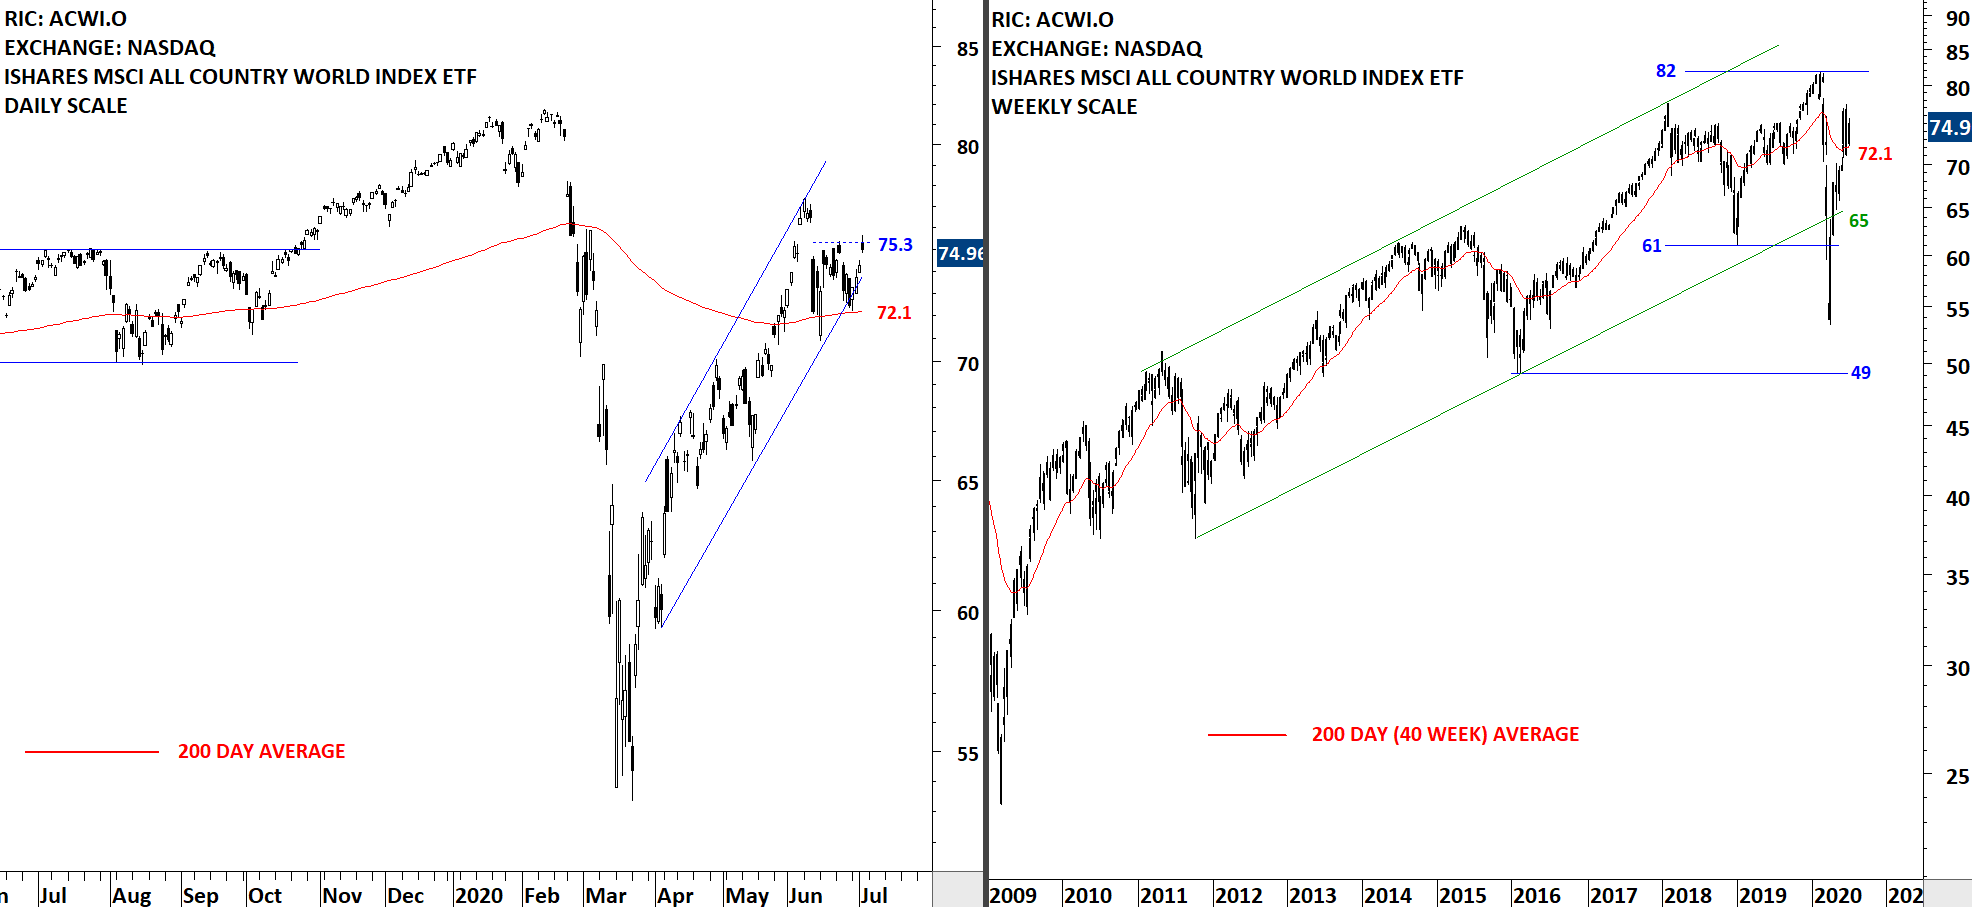
The benchmark for the Global equity markets performance, the iShares MSCI All Country World Index ETF (ACWI.O) rebounded from its 200-day moving average that was acting as support at 72.1 levels. Last two month's price action can be identified as a rising channel. Price can remain inside the trend channel. Both the lower boundary of the trend channel and the 200-day average were forming support around the same area. So far the price remained above the 200-day average. Thursday's price action found resistance at the minor high at 75.3 levels. Breakout above the minor high at 75.3 can resume the uptrend. Failure to breakout above the short-term resistance can result in a sideways trading range between 72.1 and 75.3.
 Read More