GLOBAL EQUITY MARKETS – May 16, 2020

REVIEW


The benchmark for the Global equity markets performance, the iShares MSCI All Country World Index ETF (ACWI.O) is possibly forming a short-term consolidation after its strong rebound from the March lows. The ETF recovered close to 62% of the decline that started in February. Price came close to its 200-day moving average which is now at 71.7 levels. The ETF is in a downtrend below the 200-day average.

Read More

GLOBAL EQUITY MARKETS – May 9, 2020

REVIEW


The benchmark for the Global equity markets performance, the iShares MSCI All Country World Index ETF (ACWI.O) continued to hold on to its gains after the ETF experienced a setback. The ETF recovered close to 62% of the decline that started in February. Price came close to its 200-day moving average which is now at 71.9 levels. The ETF is in a downtrend below the 200-day average. I continue to monitor this ETF for a possible short-term chart pattern development.

Read More

GLOBAL EQUITY MARKETS – May 2, 2020

REVIEW


The benchmark for the Global equity markets performance, the iShares MSCI All Country World Index ETF (ACWI.O) experienced a setback after the ETF recovered close to 62% of the decline that started in February. Price came close to its 200-day moving average which is now at 72.1 levels. The ETF is in a downtrend below the 200-day average. The chart is in the process of moving to low volatility conditions. It is looking for a balance between demand and supply. A short-term chart pattern that can take the form of a flag/pennant or symmetrical triangle can offer the low risk long/short opportunity. There is no clear chart pattern development on the daily scale price chart.

Read More

INTERIM UPDATE – April 28, 2020

After rebounding from the lows many indices continued to remain strong. While some individual equities re-tested and even moved to new lows, many formed higher lows and over the past month possible bullish short-term continuation chart patterns. There are several stocks with the same setups. One important thing to mention, those are short-term chart patterns and are more prone to failure than long-term chart pattern developments. Also many stocks that are forming those short-term consolidations are trading below their 200-day averages. So if we see continuations, at best I will treat them as swing trading opportunities and not for position trading. Below are some of those good looking setups.

Read More

Breakout with a pullback – Application of ATR trailing stop-loss

This content is for members only

GLOBAL EQUITY MARKETS – April 25, 2020

REVIEW


The benchmark for the Global equity markets performance, the iShares MSCI All Country World Index ETF (ACWI.O) continued to hold on to its gains after its rebound that started in Mid-March. From the lows, the ETF recovered 50% of the decline that started in February. The 200-day moving average is far from the price at 72.3 levels. There is no clear chart pattern development on daily and weekly scale price charts. The ETF is in a downtrend below the 200-day average.

Read More

GLOBAL EQUITY MARKETS – April 18, 2020

REVIEW


The benchmark for the Global equity markets performance, the iShares MSCI All Country World Index ETF (ACWI.O) recovered above the lower boundary of a possible upward trend channel at 64 levels. Support area between 61-64 area was broken down and now price is above this area. From the lows, the ETF recovered 50% of the decline that started in February. The 200-day moving average is far from the price at 72.6 levels. There is no clear chart pattern development on daily and weekly scale price charts. The ETF is in a downtrend below the 200-day average.

Read More

GLOBAL EQUITY MARKETS – April 11, 2020

REVIEW


The benchmark for the Global equity markets performance, the iShares MSCI All Country World Index ETF (ACWI.O) recovered above the lower boundary of a possible upward trend channel at 64 levels. Support area between 61-64 area was broken down and now price is above this area. From the lows, the ETF recovered 50% of the decline that started in February. The 200-day moving average is far from the price at 72.9 levels. There is no clear chart pattern development on daily and weekly scale price charts. The ETF is in a downtrend below the 200-day average.

Read More

GLOBAL EQUITY MARKETS – April 4, 2020

REVIEW


The benchmark for the Global equity markets performance, the iShares MSCI All Country World Index ETF (ACWI.O) found resistance at 64 levels, the lower boundary of a possible upward trend channel. Support area between 61-64 area was broken down and now it is acting as resistance during the rebound. The minor low of 2016 stands as the next support at 49 levels. I will continue to monitor short-term price charts for a possible bottom reversal chart pattern. Patterns I'm looking for are double bottom, rectangle and H&S bottom. A re-test of the lows or another down leg to test 49 levels can offer a short/medium-term bottom opportunity. There is a gap opening between 55.5 and 57.2 levels. I will monitor next week, if any weakness develops, the GAP area as a possible support.

Read More

4 Types of Breakouts – March 2020 Tech Charts Webinar

4 Types of Breakouts - March 2020 Tech Charts Webinar

We are continuing our Member webinar series with a review of 4 types of breakouts. 

Type 1 are breakouts that immediately rally to price target. Type 2 are breakouts that pullback to chart pattern boundary after the breakout but do not challenge the previously broken support/resistance. These two breakouts are relatively easier to manage when compared with the breakouts that experience a hard re-test (penetrating the chart pattern boundary after a breakout) and those that fail (Type 3 & Type 4).

We will review all 4 types of breakouts with recent examples and discuss strategies to manage each condition.

Webinar Outline
  • We will review some of those chart pattern breakouts that rally to their price objective without any pullback
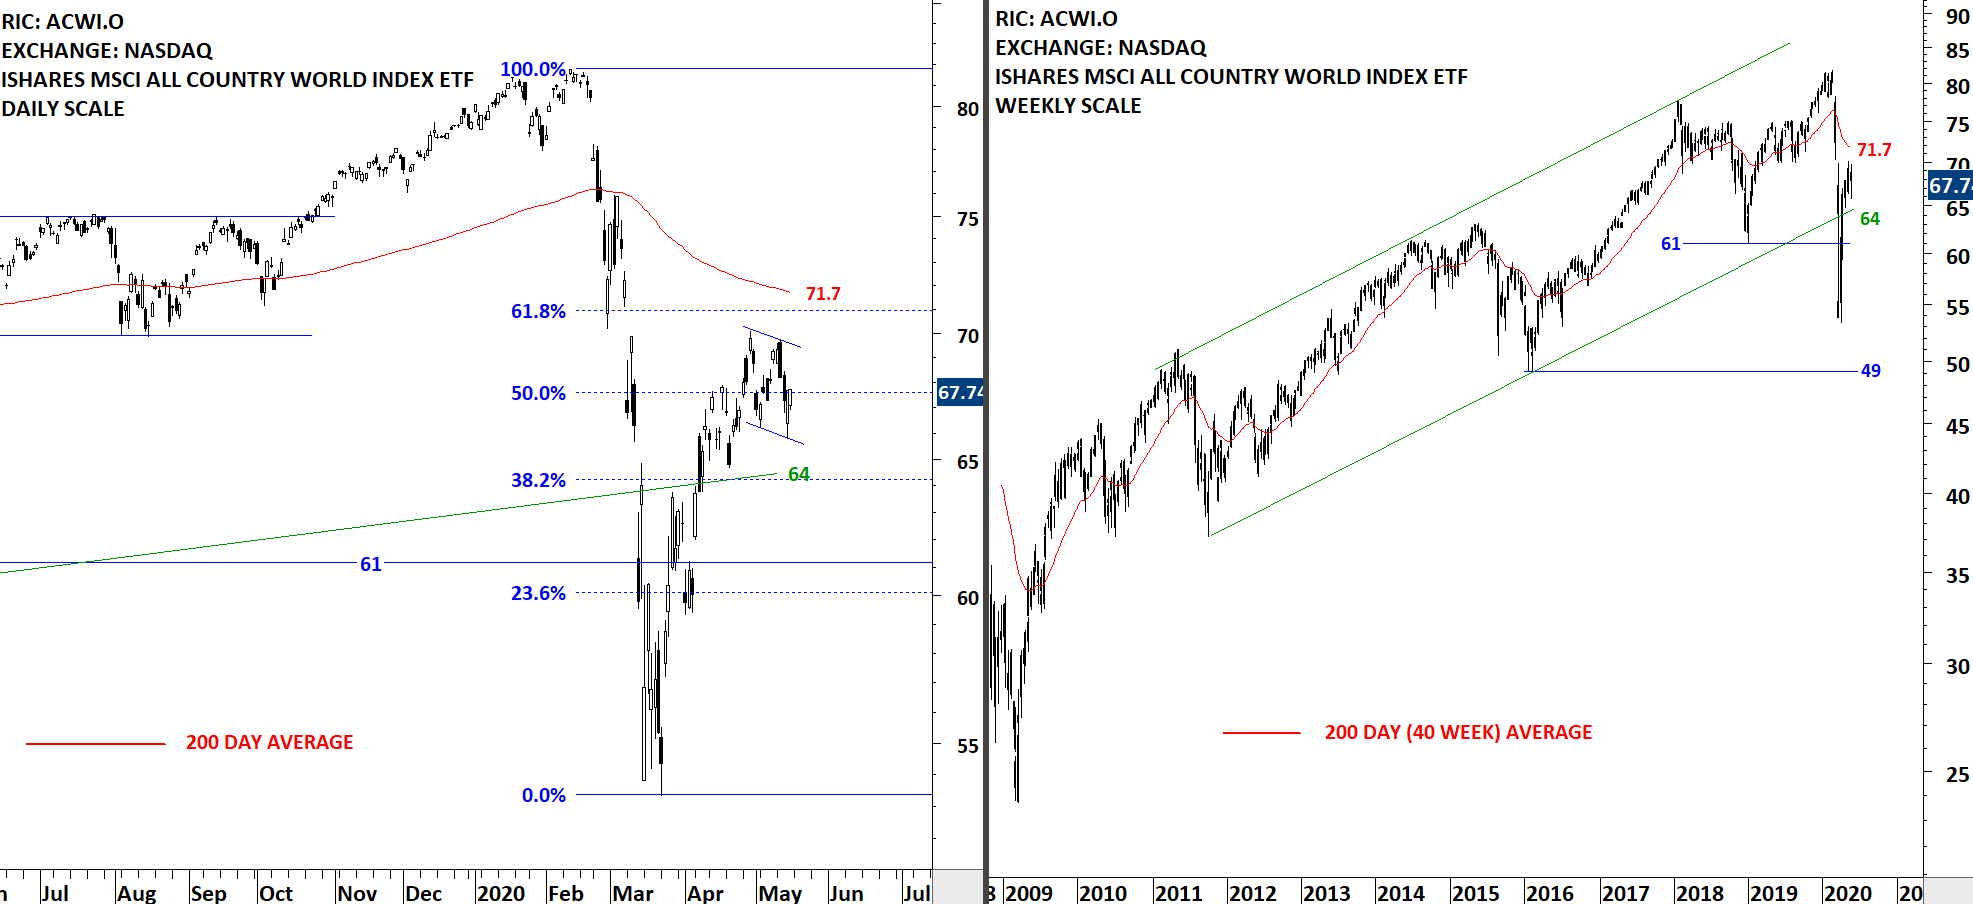
  • We will review some of the breakouts that complete an orderly pullback to chart pattern boundary
  • We will look at some of the breakouts that experience hard re-test and challenge chart pattern boundaries
  • We will review some of the breakouts that failed off of the starting gate.
  • We will have a member Q&A at the end of the webinar.
Live questions from Members  
  1. I know you're a classical market technician, but with such a severe one-sided breakdown, are you ever tempted to trade something for a pullback even though you don't have a classical pattern? 36:21
  2. Does the speed with which a pattern breakout achieves the target price indicate that you should let the trade run? 37:24
  3. Can you find signs in the chart that could indicate what type of breakout is going to occur? 38:02
  4. Do you reduce your position sizing (i.e., instead of 1% risk per trade, 0.50% risk) during extended volatility like we're seeing? 39:42
  5. Can you explain how to calculate the trailing stop loss again? 40:10
    1. Additional links ATR Trailing Stop-Loss – H&S Top & ATR plug-in
  6. How do you incorporate sentiment measures (COT DSI etc.) into your decision making? 40:48  
  7. Do you think that in market conditions such as these, the probability of a failed chart occurring is higher? 41:02
  8. Do you ever circumvent your ATR trailing stop and place it below a newly formed chart pattern negation level that's above the initial entry position? 42:32
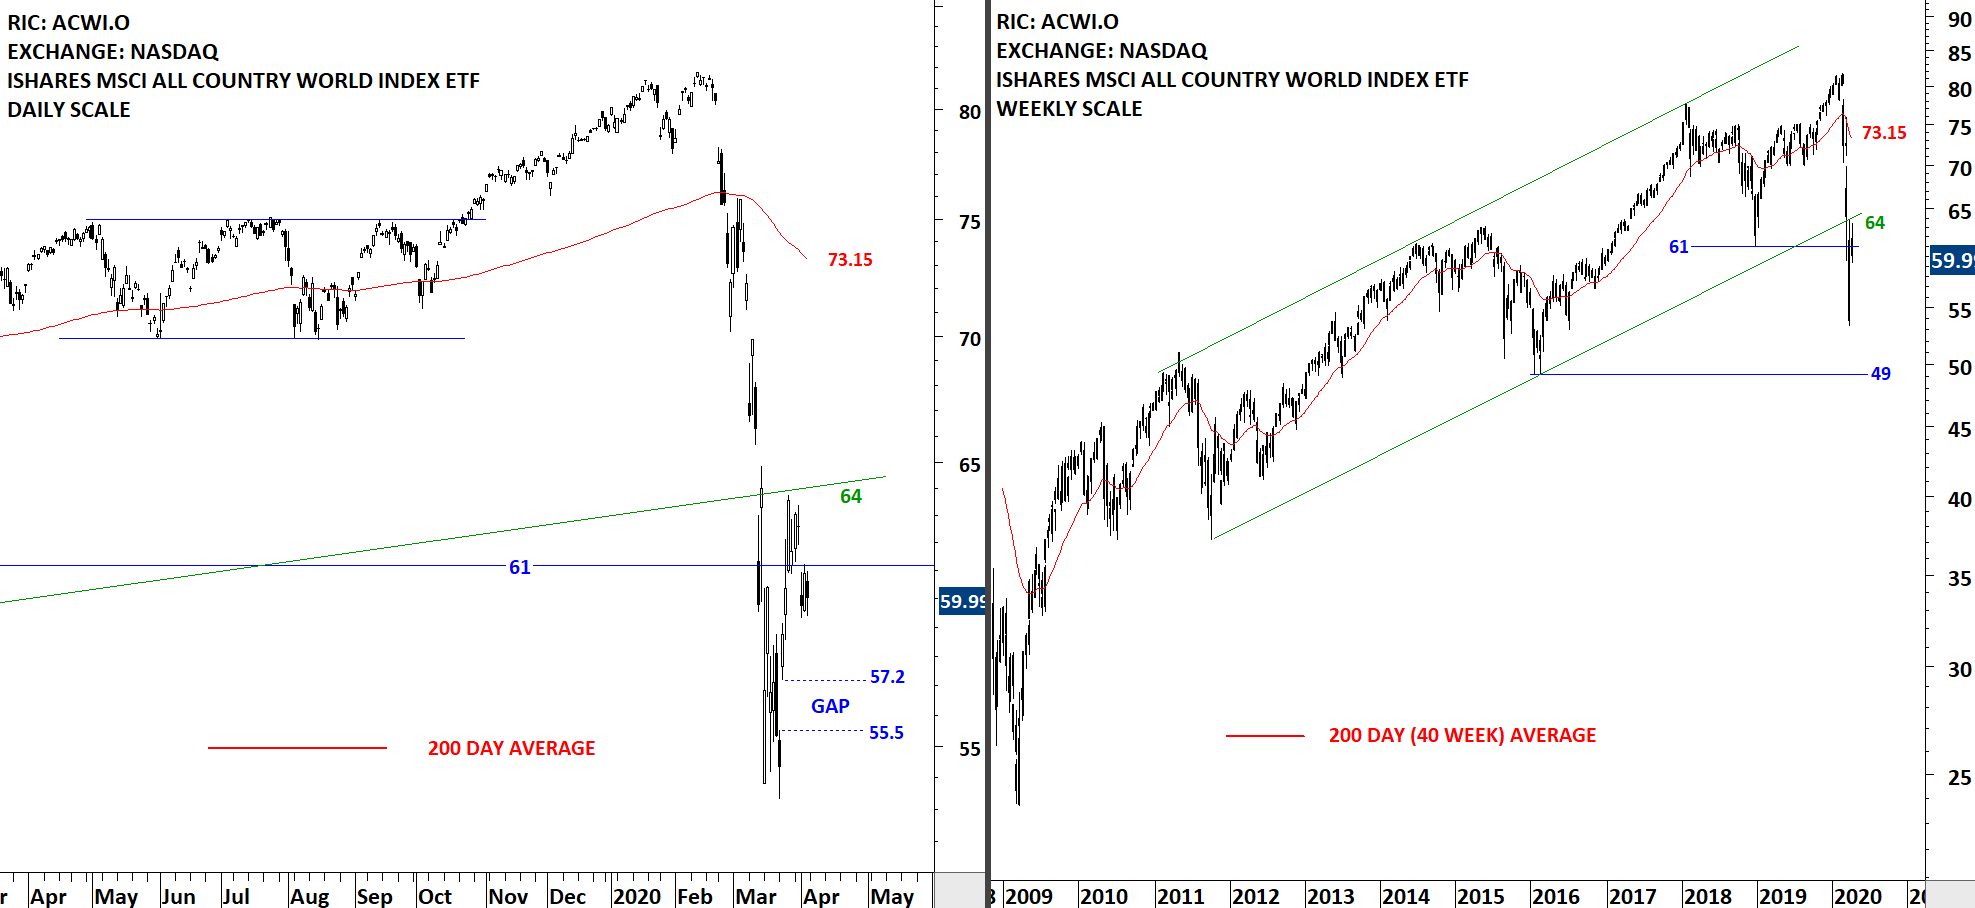
  9. I noticed that on one trade, you placed an SL at the bottom of a gap, but on another, you placed it at the top of a GAP. Do you have rules for deciding this? 43:50
  10. Is it possible to use this method for long term investing? If yes, would you use the same trailing method? 45:13
  11. Can the ATR stop rule be implemented in a trading platform? 46:19
  12. How do you determine your ATR length and multiplier number? Is it historical chart based and specific to a specific chart? Are commodities different than stock charts? 47:13
  13. As volatility during the day can be larger, have you used one ATR multiple for intra-bar & a lesser ATR multiple near the close, whereby one cancels the other OCO? 49:20
  14. Over the years, the ratio between reversal patterns vs. continuation patterns? Do you cap that ratio, or you let the patterns dictate what you have currently? 50:08
  15. Do you always trade long? Never short? 51:13
Recorded live 03.26.2020    Read More