GLOBAL EQUITY MARKETS – March 28, 2020
REVIEW
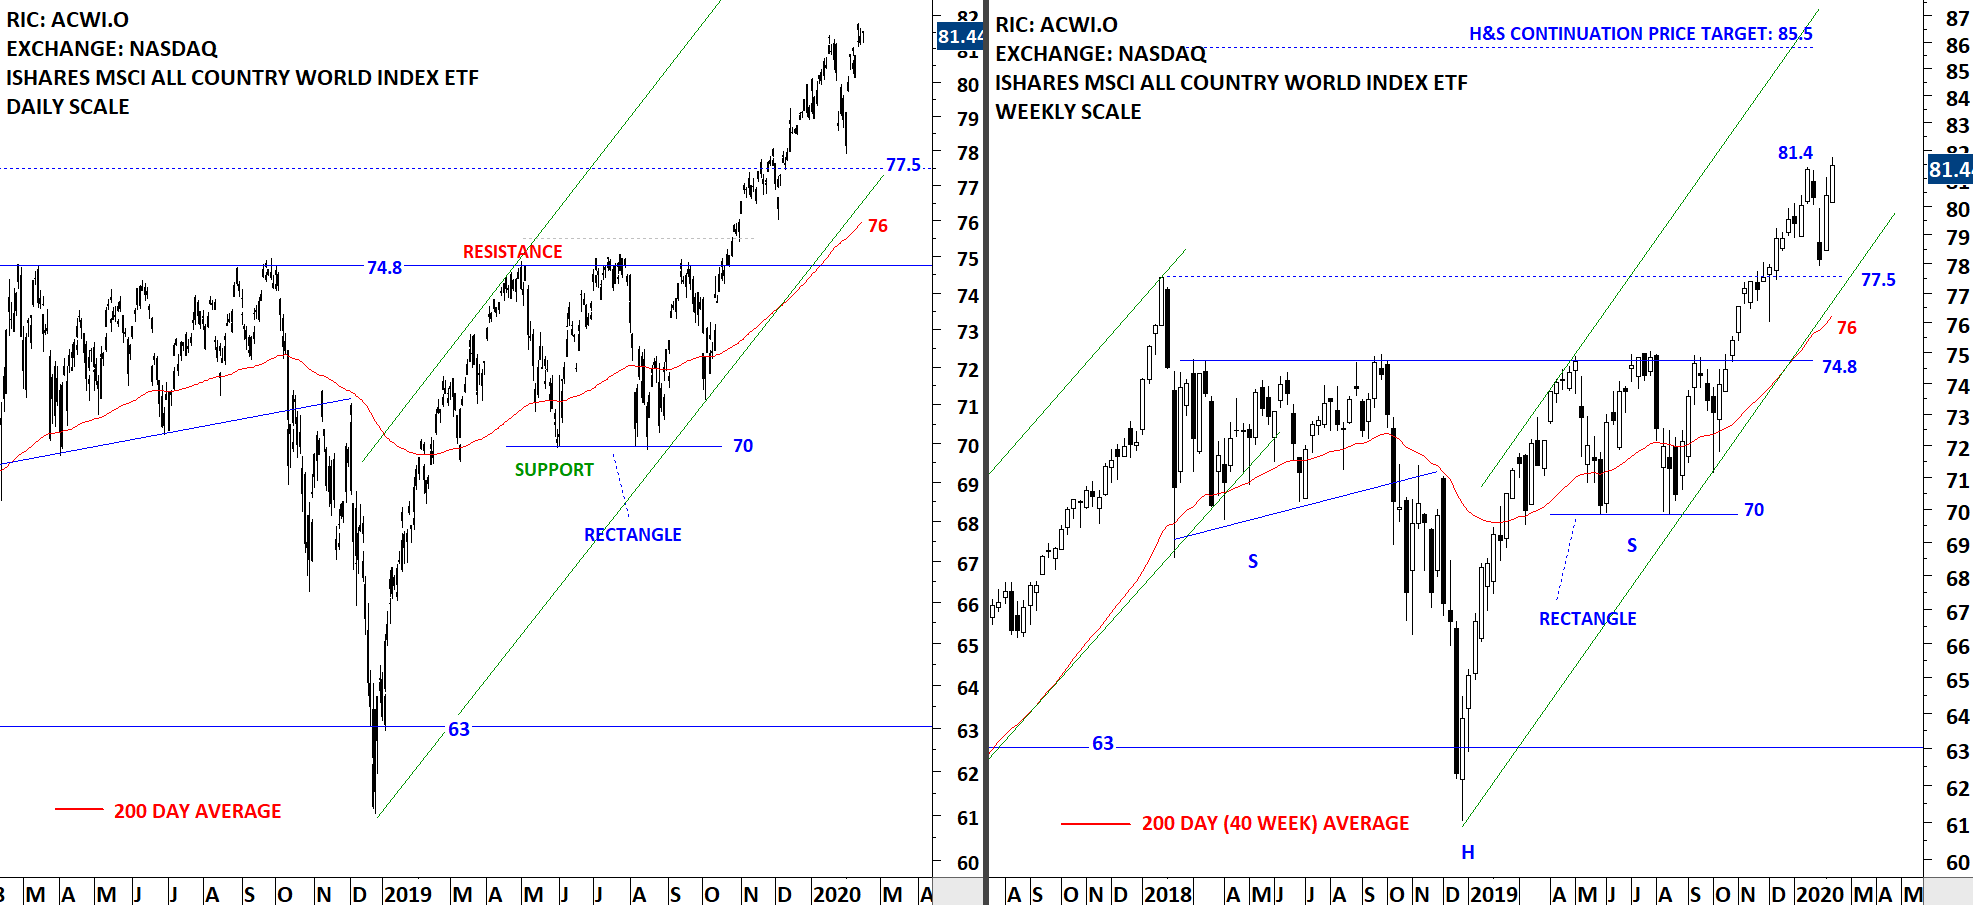
The benchmark for the Global equity markets performance, the iShares MSCI All Country World Index ETF (ACWI.O) had a sharp rebound. 61 levels was the low that was recorded in late 2018. 64 levels is the lower boundary of a possible upward trend channel. Support area between 61-64 area was broken down and now it is acting as resistance during the rebound. The minor low of 2016 stands as the next support at 49 levels. I will continue to monitor short-term price charts for a possible bottom reversal chart pattern. Patterns I'm looking for are double bottom, rectangle and H&S bottom. A re-test of the lows or another down leg to test 49 levels can offer a short/medium-term bottom opportunity.
 Read More