GLOBAL EQUITY MARKETS – November 30, 2019

REVIEW


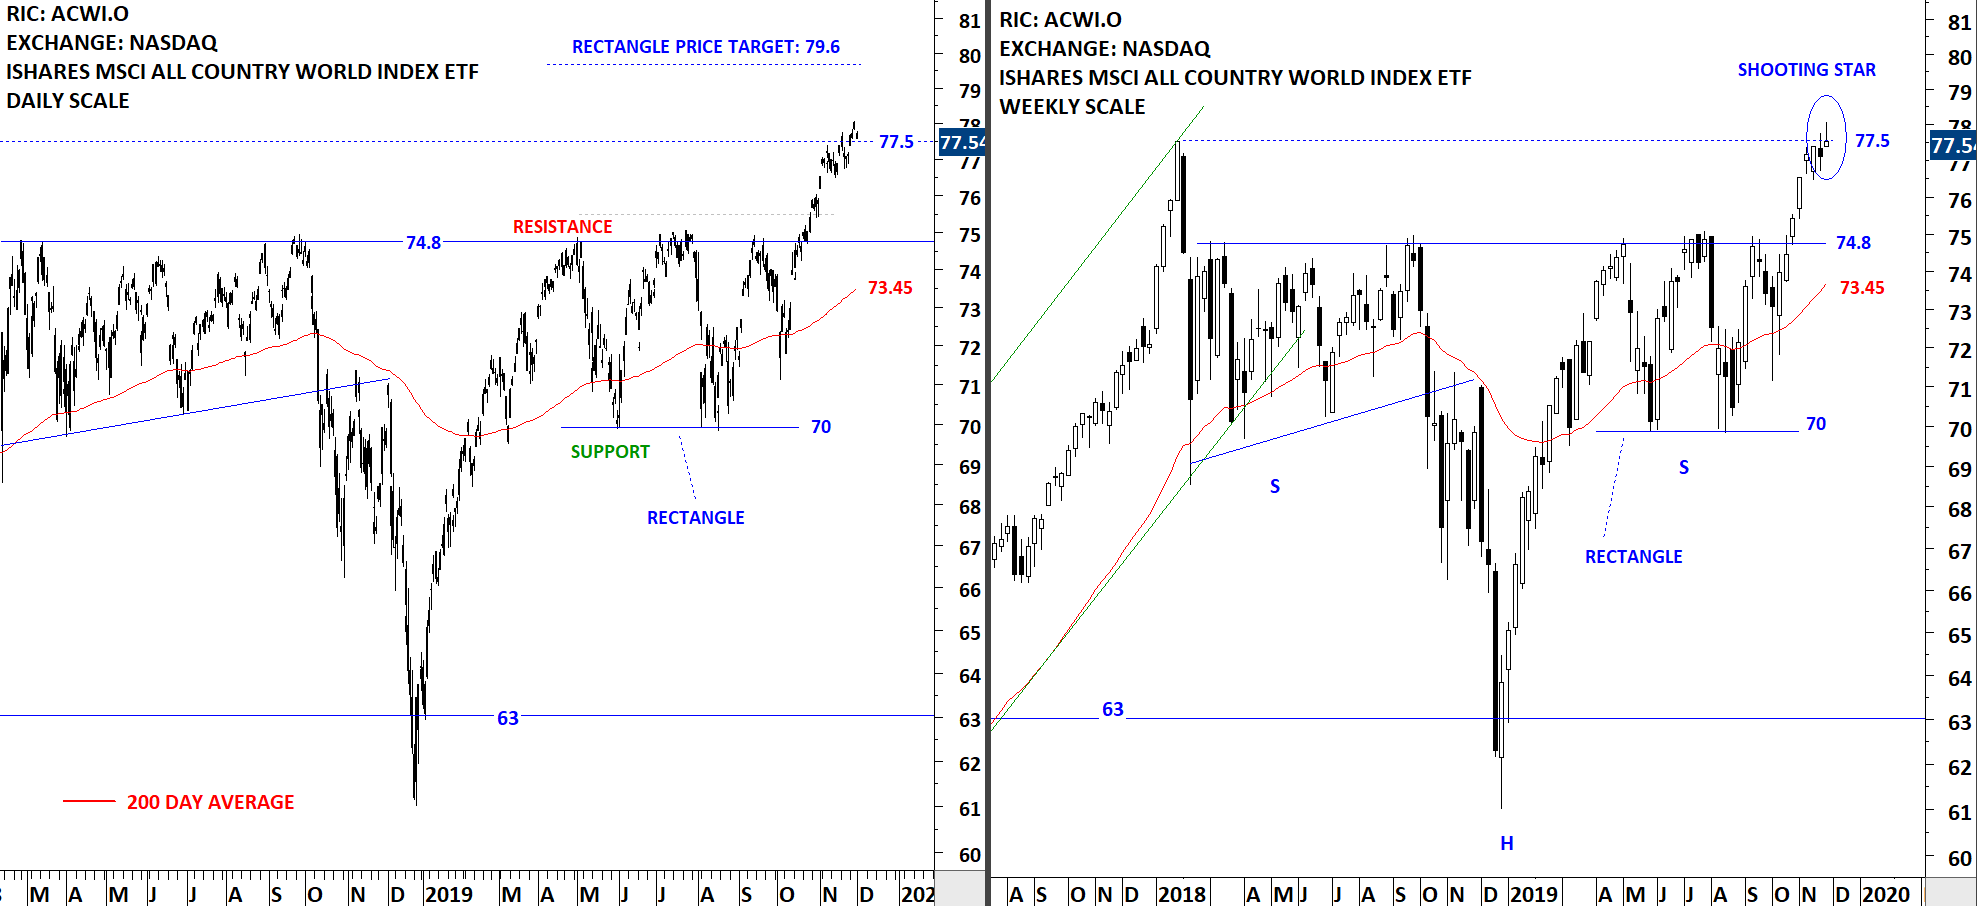
The benchmark for the Global equity markets performance, the iShares MSCI All Country World Index ETF (ACWI.O) found resistance at 77.5 levels. This week's price action formed a shooting star candlestick around the resistance area. The shooting star is common candlestick that indicates the potential for a bearish reversal. This candlestick is characterized by a small body with a long upper wick and a short or nonexistent lower wick. In order to be classified as a shooting star, the upper wick of the candlestick should be at least twice as long as its body. The shooting star candlestick looks very similar to the inverted hammer candlestick. The defining difference is that shooting stars are bearish reversal signals at the top of of uptrends, while inverted hammers are bullish reversal signals at the bottom of downtrends.

The 5 month-long rectangle price target stands at 79.6 levels. Breakout above the minor resistance can push the ETF towards the price target at 79.6. Both the daily and weekly price charts show a steady uptrend. Unless we see a strong breakout above this week's high, ACWI ETF can trade between 74.8 and 77.5 levels in the following weeks.
Read More

INTERIM UPDATE – November 29, 2019

Dear Tech Charts members,

As mentioned in our previous communications I've been working on bringing more short-term chart pattern setups into your attention from the Global equity markets. In doing so I'm paying close attention to have liquid names. Tech Charts Global Equity markets report featured mostly chart pattern in duration between 4 months - 24 months. We are now focusing as well on chart patterns in duration between 2 months - 4 months featured on daily scale. I will continue to bring those opportunities either via Interim Updates or the weekly Global Equity Markets report. Below are 3 additions to Tech Charts watchlist that may experience breakouts in the last trading day of the week even though it will be a short session. These charts will also be included in the weekly update.

Read More

GLOBAL EQUITY MARKETS – November 23, 2019

REVIEW


The benchmark for the Global equity markets performance, the iShares MSCI All Country World Index ETF (ACWI.O) continued to trade close to the resistance level at 77.5 levels. The ETF found short-term resistance around 77.5 levels. The 5 month-long rectangle price target stands at 79.6 levels. Breakout above the minor resistance can push the ETF towards the price target at 79.6. Both the daily and weekly price charts show a steady uptrend. 74.8 levels will act as support during any pullback.

Read More

GLOBAL EQUITY MARKETS – November 16, 2019

REVIEW


The benchmark for the Global equity markets performance, the iShares MSCI All Country World Index ETF (ACWI.O) remained strong and close to the resistance level at 77.5 levels. The ETF found short-term resistance around 77.5 levels. The 5 month-long rectangle price target stands at 79.6 levels. Breakout above the minor resistance can push the ETF towards the price target at 79.6. Both the daily and weekly price charts show a steady uptrend. 74.8 levels will act as support during any pullback.

Read More

GLOBAL EQUITY MARKETS – November 9, 2019

REVIEW


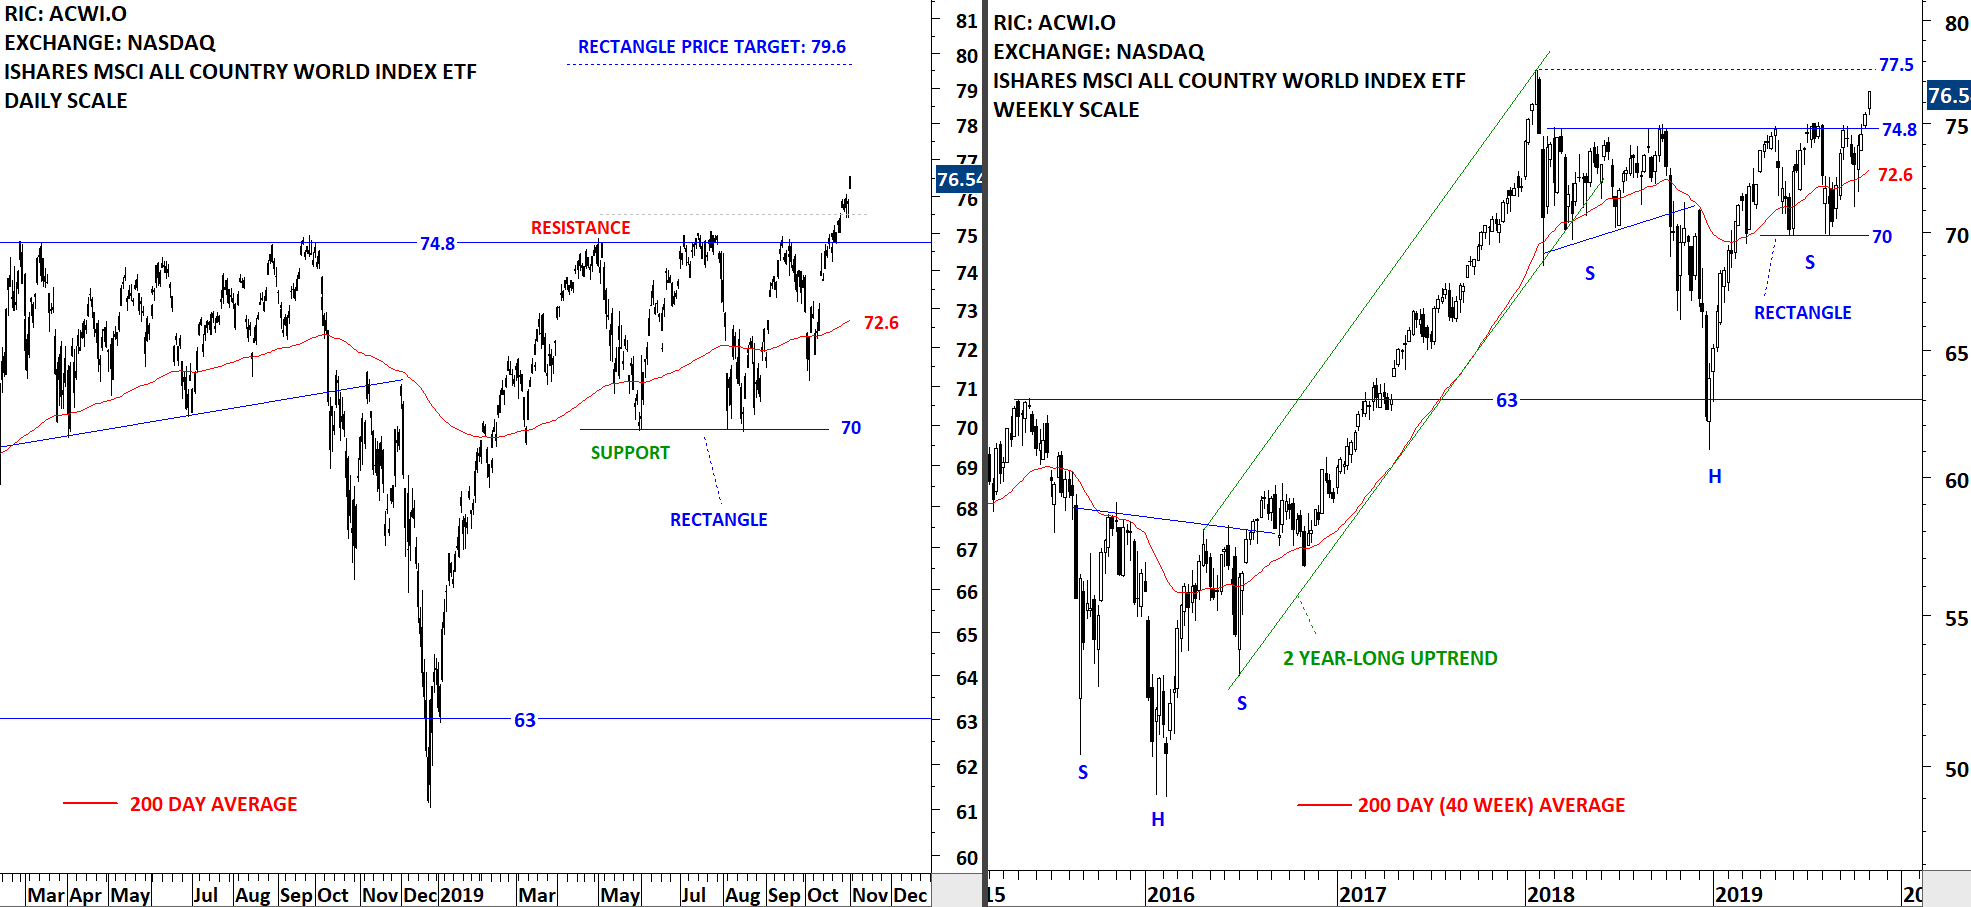
The benchmark for the Global equity markets performance, the iShares MSCI All Country World Index ETF (ACWI.O) continued higher after breaking out from the 5 month-long rectangle. While the long-term chart pattern can be identified as a H&S continuation and has a much higher price objective the short-term chart pattern is possibly a rectangle and the short-term price target stands at 79.6 levels. This week's price action found resistance at the minor high that stands at 77.5 levels. The ETF might find short-term resistance around 77.5 levels. 74.8 levels will act as support during any pullback.

Read More

GLOBAL EQUITY MARKETS – November 2, 2019

REVIEW


The benchmark for the Global equity markets performance, the iShares MSCI All Country World Index ETF (ACWI.O) confirmed the breakout from the 5 month-long rectangle. While the long-term chart pattern can be identified as a H&S continuation and has a much higher price objective the short-term chart pattern is possibly a rectangle and the short-term price target stands at 79.6 levels. There is another hurdle that the ACWI ETF needs to overcome before reaching all-time highs and that is the minor high that stands at 77.5 levels. The ETF might find short-term resistance around 77.5 levels. 74.8 levels will act as support.

Read More

GLOBAL EQUITY MARKETS – October 26, 2019

REVIEW


The benchmark for the Global equity markets performance, the iShares MSCI All Country World Index ETF (ACWI.O) breached the  resistance at 74.8 levels. While the long-term chart pattern can be identified as a H&S continuation, the short-term chart pattern is possibly a rectangle. With ETFs and indices a breakout confirmation level of 1% can be sufficient.  I will take a daily close above 75.5 levels as a breakout confirmation. I monitor this ETF for another day of strength. Possible chart pattern price target for the rectangle stands at 79.6 levels.

Read More

GLOBAL EQUITY MARKETS – October 19, 2019

REVIEW


The benchmark for the Global equity markets performance, the iShares MSCI All Country World Index ETF (ACWI.O) found resistance at the famous horizontal 74.8 resistance. It is now almost 2 year that the ETF has been trading below the strong resistance with several tests. The rebound from the 200-day average at 72.5 took place with a gap opening. If we see further consolidation and pullback the ETF can fill the gap between 73 and 73.6 levels. The ACWI ETF is still trading in a wide range and the strong resistance continues to remain at 74.8 levels. Only after a breakout above the strong horizontal resistance we will conclude the completion of a multi-month long bullish chart pattern. The right shoulder of a possible H&S continuation is now well-defined and can be labelled as a rectangle.

Read More

INTERIM UPDATE – October 16, 2019

Dear Tech Charts members,

As mentioned in our previous communications I've been working on bringing more short-term chart pattern setups into your attention from the Global equity markets. In doing so I'm paying close attention to have liquid names. Tech Charts Global Equity markets report featured mostly chart pattern in duration between 4 months - 24 months. We are now focusing as well on chart patterns in duration between 2 months - 4 months featured on daily scale. I will continue to bring those opportunities either via Interim Updates or the weekly Global Equity Markets report. Below are 4 additions to Tech Charts watchlist.

Read More