GLOBAL EQUITY MARKETS – October 12, 2019
REVIEW
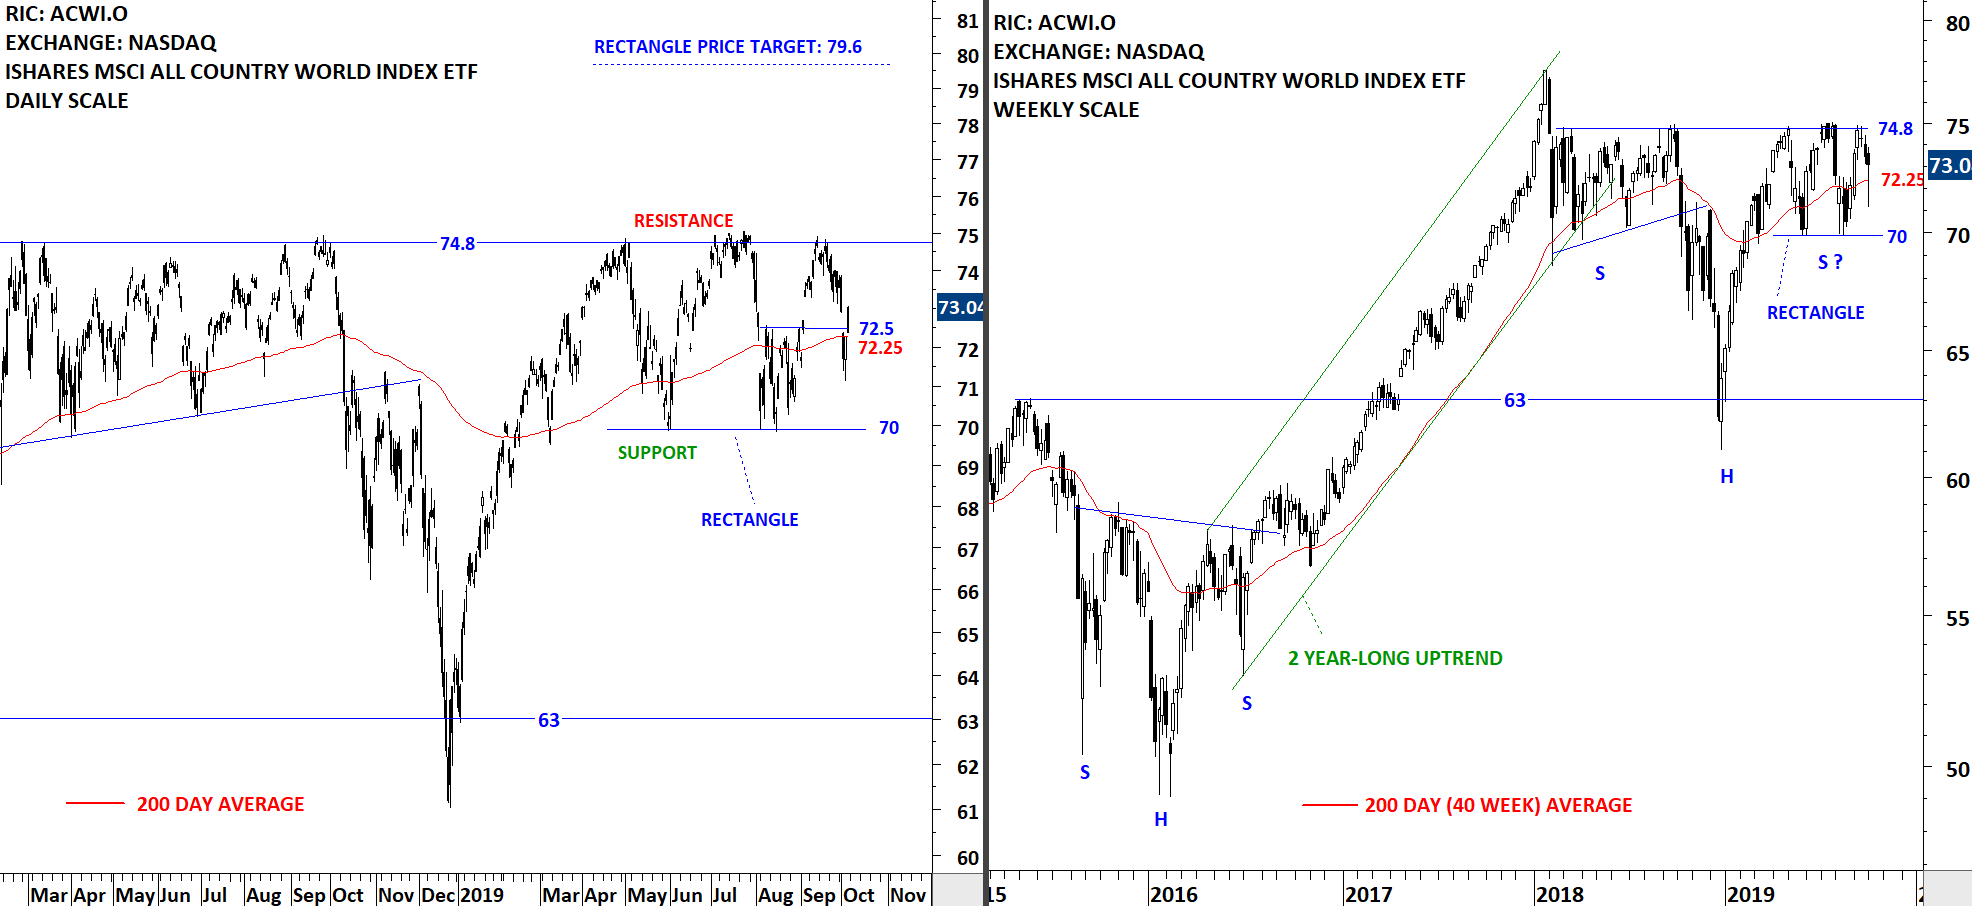
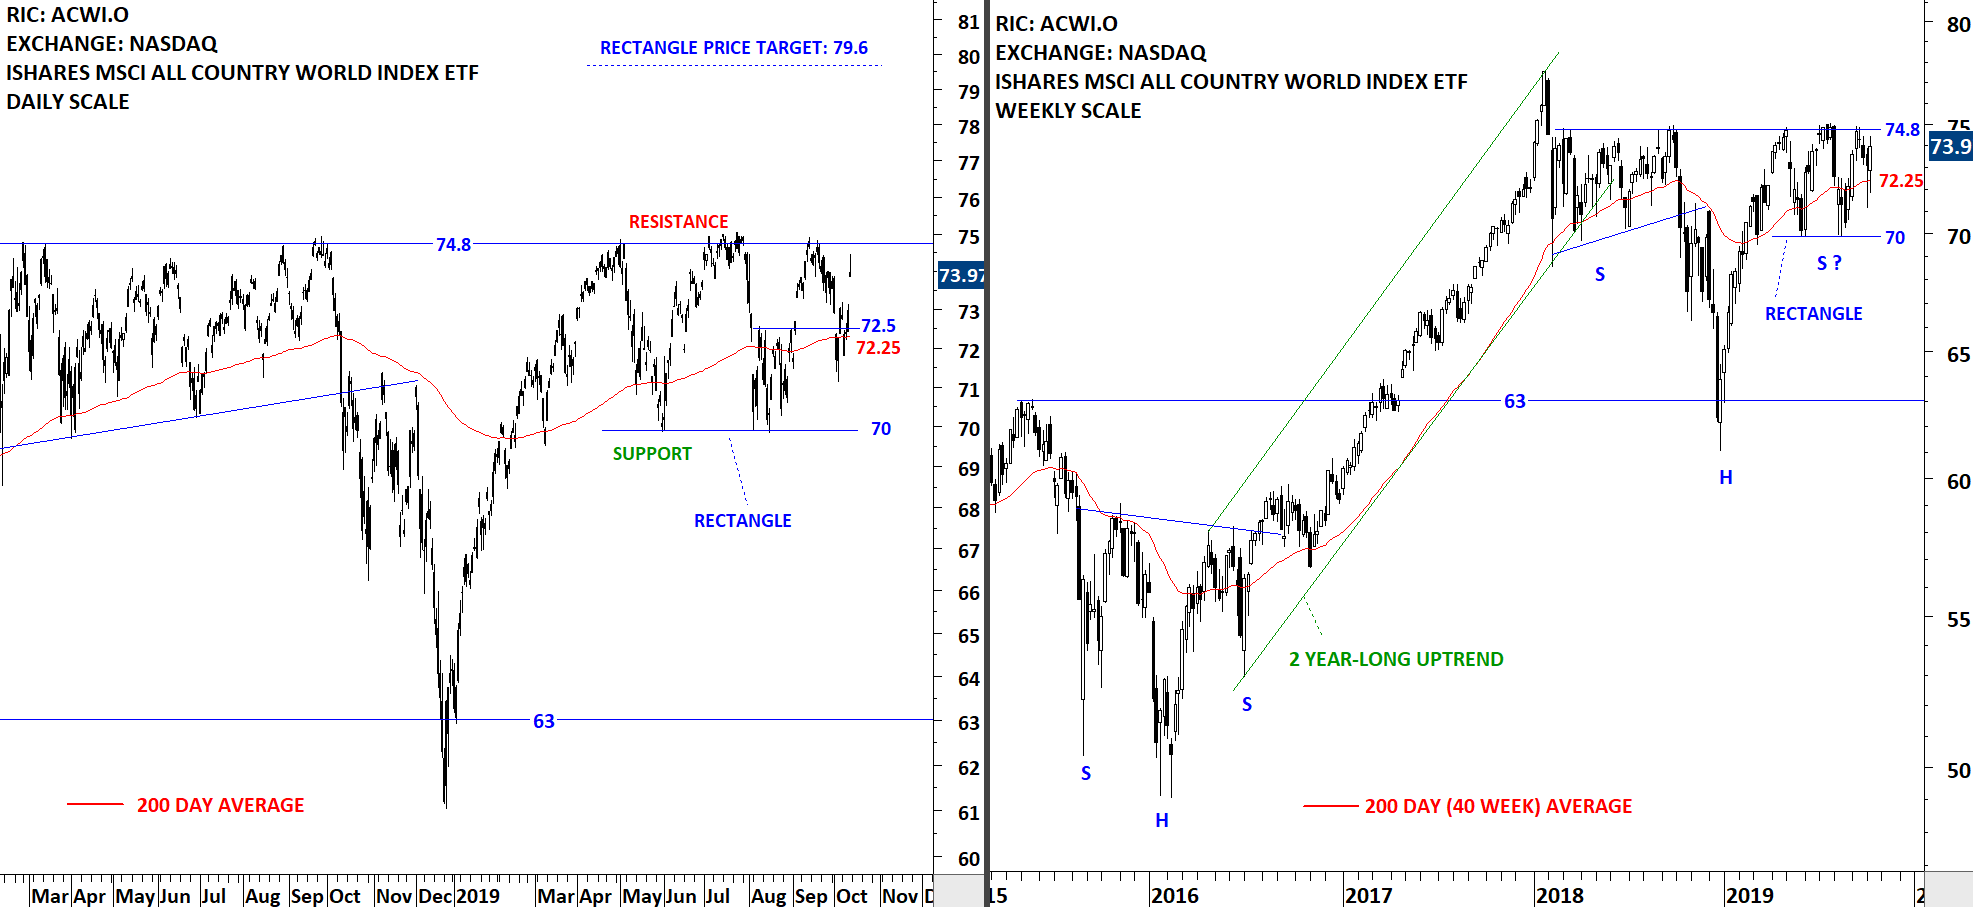
The benchmark for the Global equity markets performance, the iShares MSCI All Country World Index ETF (ACWI.O) rebounded strong from the support area formed by the horizontal minor support and the 200-day moving average between 72.25 and 72.5 levels. The weekly close was close to the multi-month long resistance at 74.8 levels. The ETF is still trading in a wide range and the strong resistance continues to remain at 74.8 levels. Only after a breakout above the strong horizontal resistance we will conclude the completion of a multi-month long bullish chart pattern. The right shoulder of a possible H&S continuation is now well-defined and can be labelled as a rectangle.
 Read More