Tech Charts
  • Blog
  • About Aksel
  • Premium Members
    • Premium Reports
    • Breakouts
    • Educational Videos
    • Tech Charts Study
  • Support
    • Contact
    • FAQ
    • My Account
    • Forgot Password
    • TradingView
    • MetaStock
    • Reading List
    • Terms of Service
    • Privacy Policy
  • Search
  • Menu Menu
  • Twitter
  • LinkedIn
  • Youtube
Blog - Latest News
You are here: Home1 / HOME2 / EMERGING MARKET EQUITIES3 / EMERGING MARKETS and SOUTH AFRICA

EMERGING MARKETS and SOUTH AFRICA

November 15, 2015/0 Comments/in EMERGING MARKET EQUITIES, Uncategorized/by Aksel Kibar

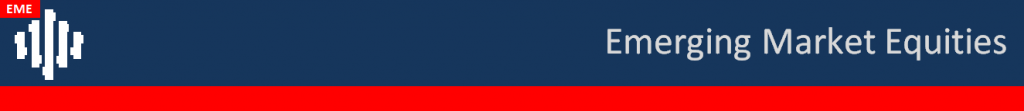
Following one month of positive price action, weakness resumed in the emerging market equities. Until previously broken support levels are breached on the upside, strength in emerging market equities will be classified as counter-trend move. In other words, MSCI Emerging Markets index should clear 860-900 area on the upside to reverse the larger-scale downtrend.

MSCI EMERGING MARKETS INDEX

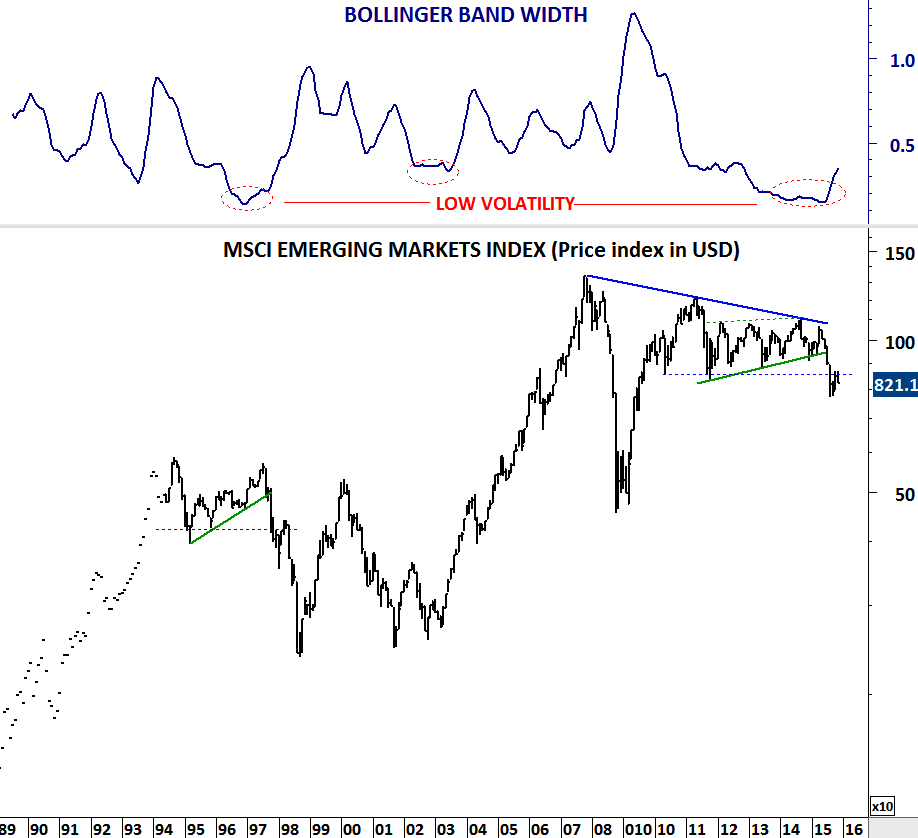
Since the beginning of 2011, emerging market equity weakness has been mainly due to sharp depreciation in the local currencies. Some of the emerging market equity indices reached all-time high levels while the U.S. dollar denominated MSCI Emerging Markets index recorded lower lows. One good example is the South Africa All Share Index (with local currency). Since the beginning of 2011, South Africa All Share index resumed its multi-year uptrend, reaching all-time high levels while the MSCI South Africa index (price index in U.S. dollar) trended lower.

SOUTH AFRICA ALL SHARE INDEX

MSCI SOUTH AFRICA

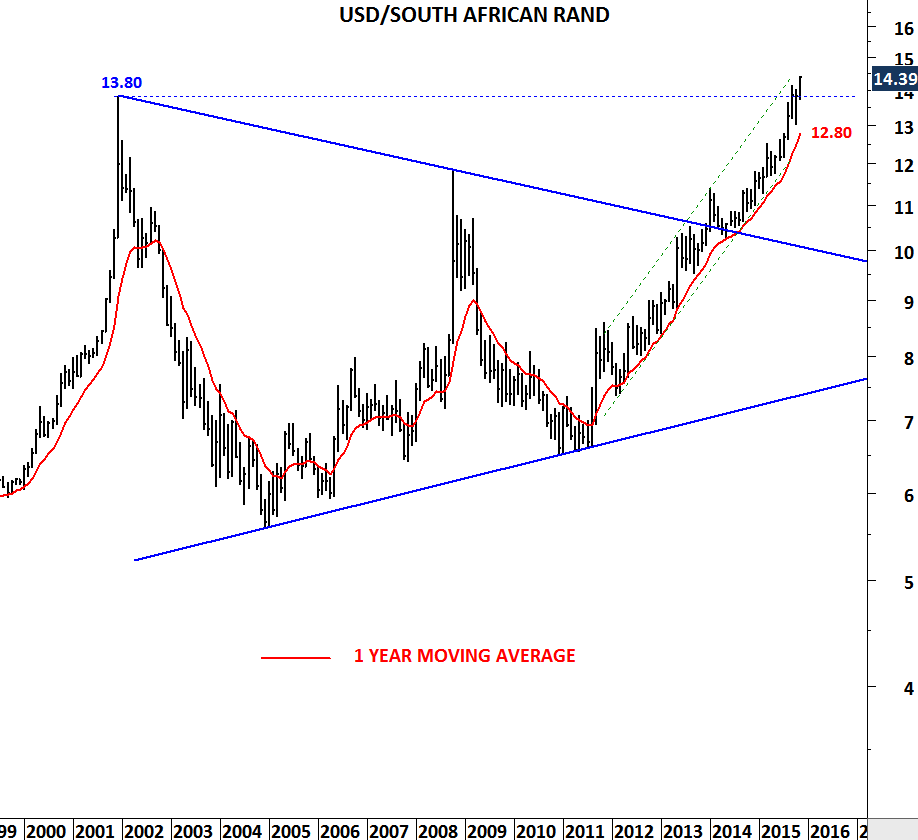
Weakness in emerging market currencies are likely to continue. USD/ZAR is breaking out to all-time high levels. Supported by the FED rate hike we might see acceleration in those currency trends.

Any thoughts on how U.S. dollar denominated equity indices such as MSCI South Africa will perform if we see South Africa All Share index testing lower levels with U.S. dollar strength?

USDZAR

Tags: MSCI EMERGING MARKETS INDEX, MSCI SOUTH AFRICA, SOUTH AFRICA ALL SHARE INDEX, SOUTH AFRICAN RAND, US DOLLAR
Share this entry
  • Share on Facebook
  • Share on Twitter
  • Share on Pinterest
  • Share on LinkedIn
  • Share on Tumblr
  • Share on Vk
  • Share on Reddit
  • Share by Mail
https://blog.techcharts.net/wp-content/uploads/2014/11/eme-header-1.png 143 1325 Aksel Kibar https://blog.techcharts.net/wp-content/uploads/2017/05/Tech-Charts-logo-FINAL-CLEAN-340w.png Aksel Kibar2015-11-15 20:59:182017-03-17 13:45:14EMERGING MARKETS and SOUTH AFRICA
You might also like
EUROSTOXX 600, MSCI ACWI and MSCI EM
GLOBAL EQUITY MARKETS – May 6, 2017
DJIA, RUSSELL 2000, ACWI
USD/ZAR & USD/IDR
EURO STOXX 600, NIKKEI and MSCI ACWI
GLOBAL EQUITY MARKETS – September 30, 2017
TURKEY, SOUTH AFRICA and BRAZIL
U.S. DOLLAR/TURKISH LIRA

Search Site

Join Free Newsletter

Print:

Print This Post Print This Post

Latest Blog Posts

  • BLOOMBERG ALL COMMODITY STRATEGY ETF (BCI)October 6, 2025 - 6:33 am
  • PINE SCRIPT CODE FOR ATR TRAILING STOP-LOSSAugust 17, 2025 - 6:40 pm
  • GLOBAL EQUITY MARKETS – May 24, 2025June 7, 2025 - 5:50 am
  • GATX CORP (GATX.K)March 2, 2025 - 2:55 pm

CHARTS DRAWN USING


Post Archive

Charts Drawn Using

MetaStock Techcharts

In Association with:

CHARTS DRAWN WITH:


Latest Posts

  • BLOOMBERG ALL COMMODITY STRATEGY ETF (BCI)October 6, 2025 - 6:33 am
  • GLOBAL EQUITY MARKETS – October 4, 2025October 4, 2025 - 10:26 am
  • CRYPTOCURRENCIES – September 29, 2025September 29, 2025 - 11:12 am
  • GLOBAL EQUITY MARKETS – September 27, 2025September 27, 2025 - 10:33 am

Search

As Seen On:

© Copyright - Tech Charts
  • Twitter
  • LinkedIn
  • Youtube
SMALL CAPS vs. LARGE CAPSKUWAIT, NIGERIA and SAUDI ARABIA
Scroll to top