Posts

UK FTSE, ACWI, NETFLIX, VOLKSWAGEN

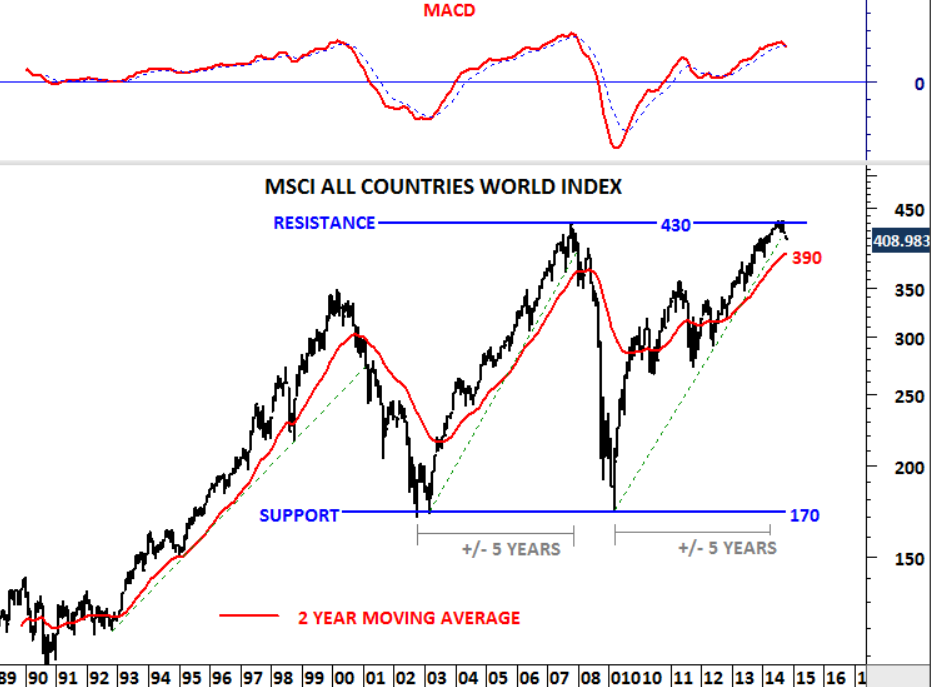
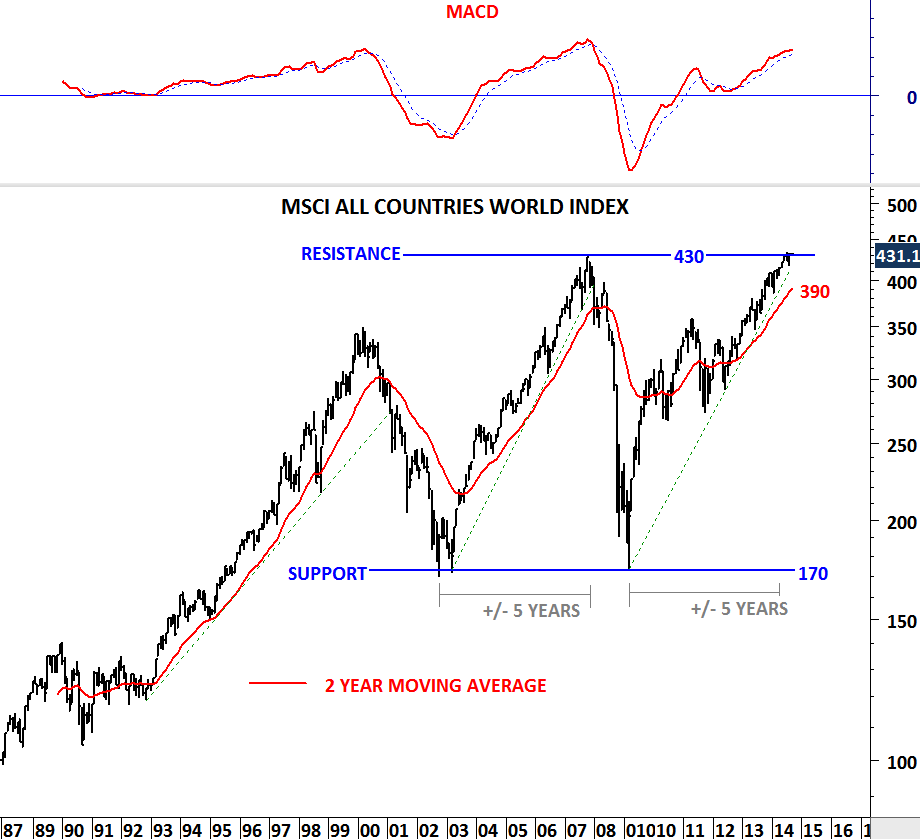
In the first week of the new year global equities had renewed strength. In the first half of December 2016, benchmark for the global equities, ISHARES MSCI ACWI had a strong breakout which was followed by three weeks of pullback. Price action in the first week of January pushed ISHARES MSCI ALL COUNTRIES WORLD INDEX to December 2016 highs suggesting the continuation of the uptrend in the following weeks.

ISH ACWI ETF - WEEKLY SCALE

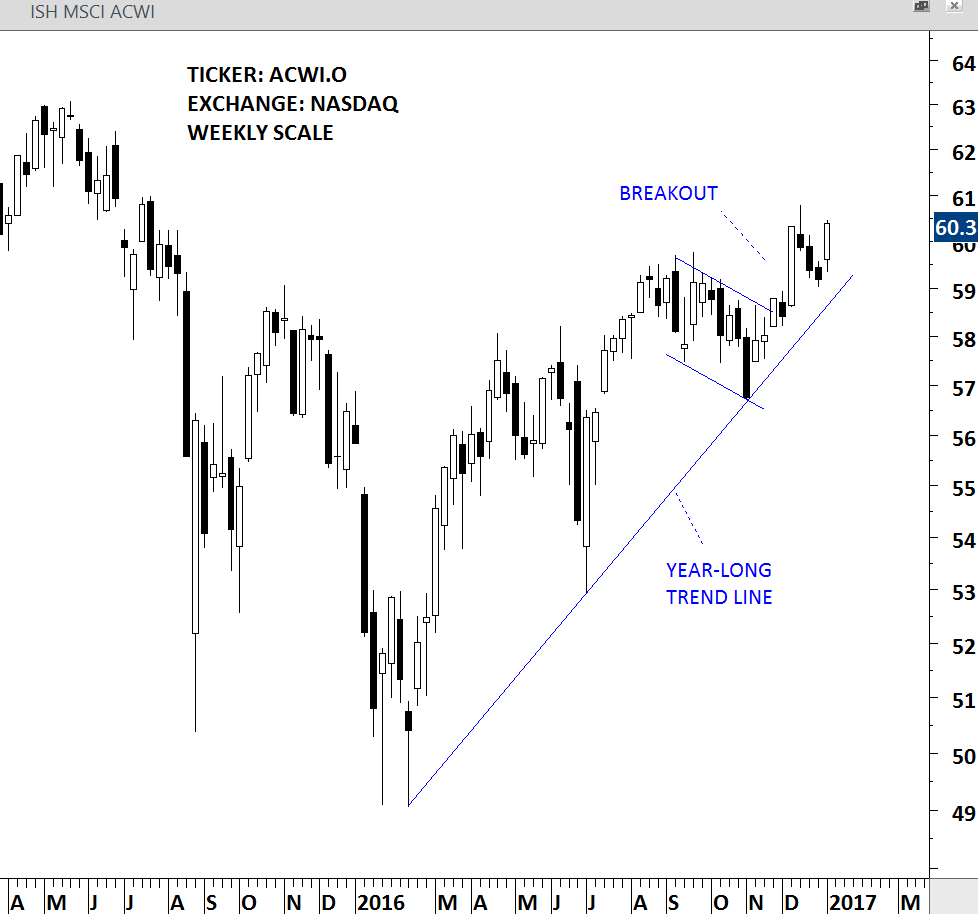
ISH ACWI ETF – WEEKLY SCALE

ISHARES GLOBAL INDUSTRIALS ETF (EXI)

ISHARES GLOBAL INDUSTRIALS ETF that broke out of 2 year-long consolidation in the beginning of December 2016 and possibly completed its pullback to its horizontal support at 74.80 levels. This week’s long white candle also shows the renewed strength in the global industrial equities. EXI is an ETF listed in the NYSE.
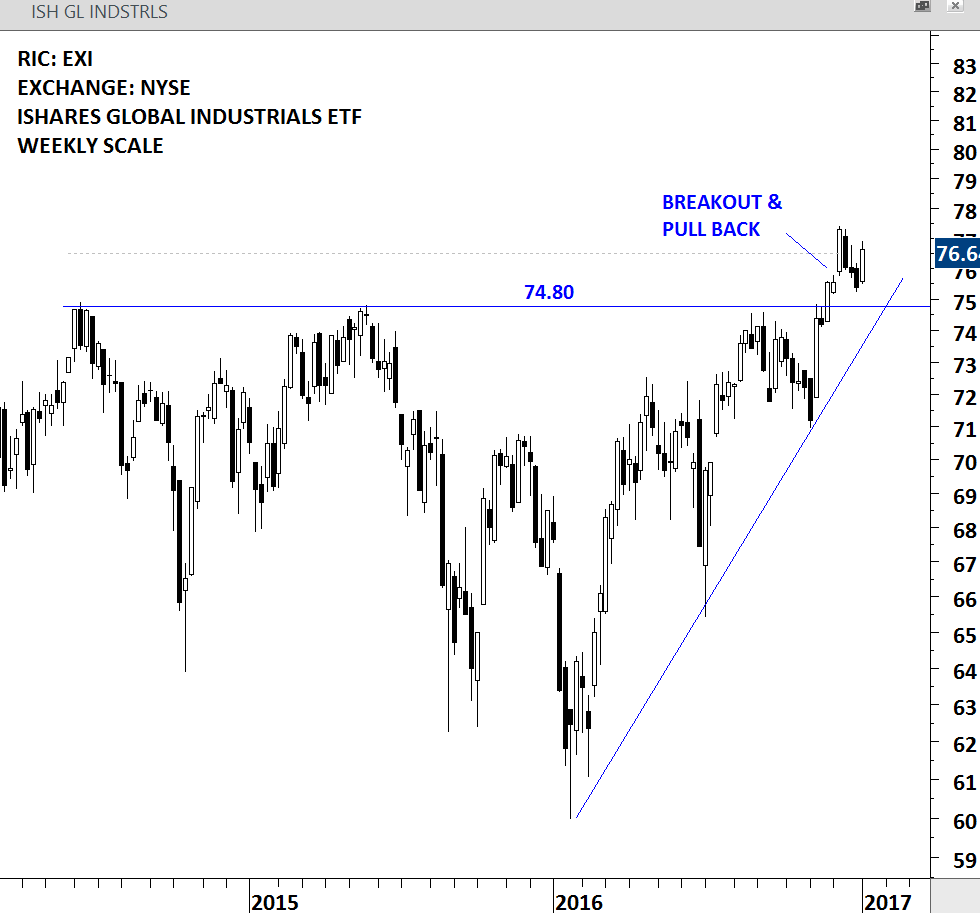
EXI - WEEKLY SCALE

EXI – WEEKLY SCALE

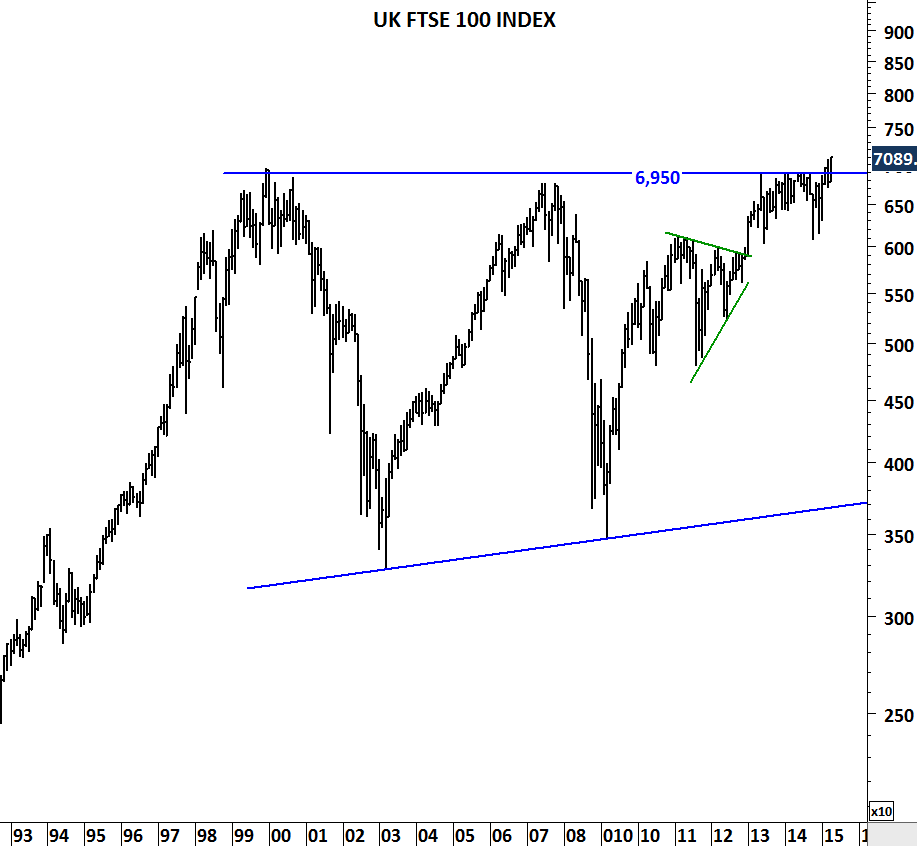
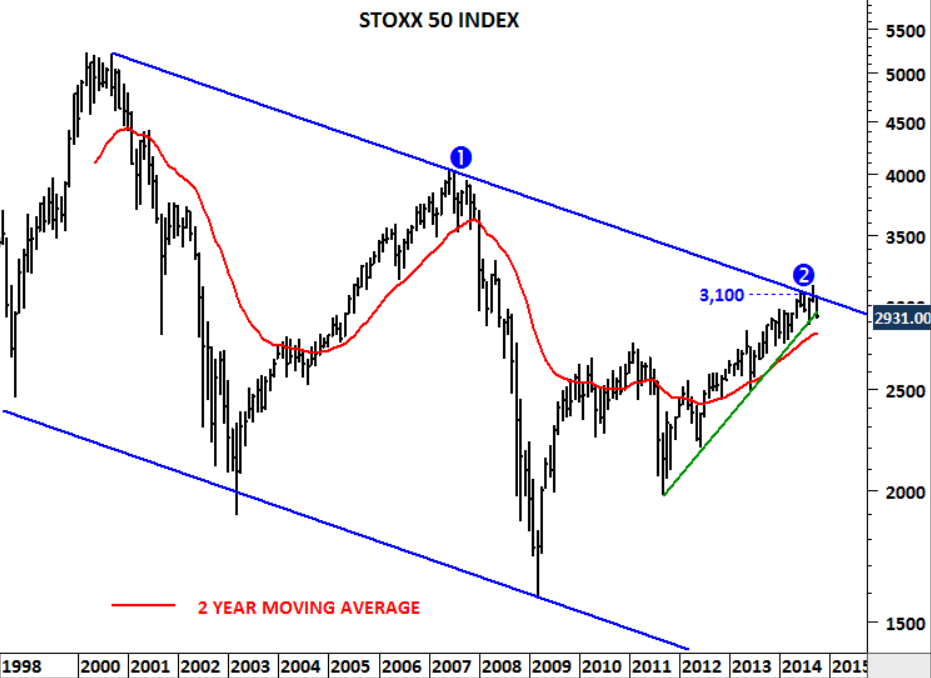
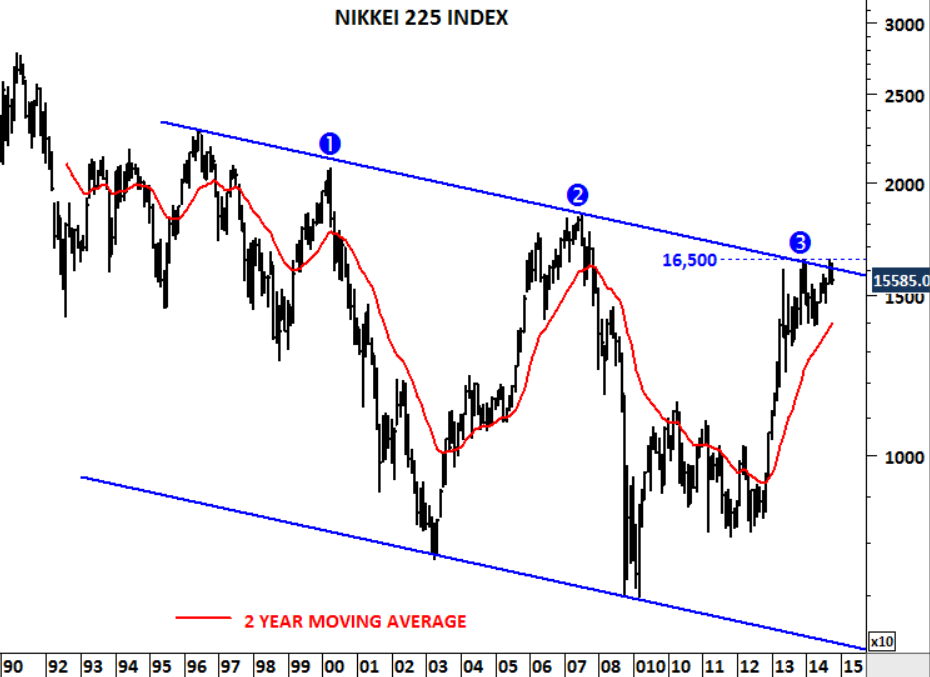
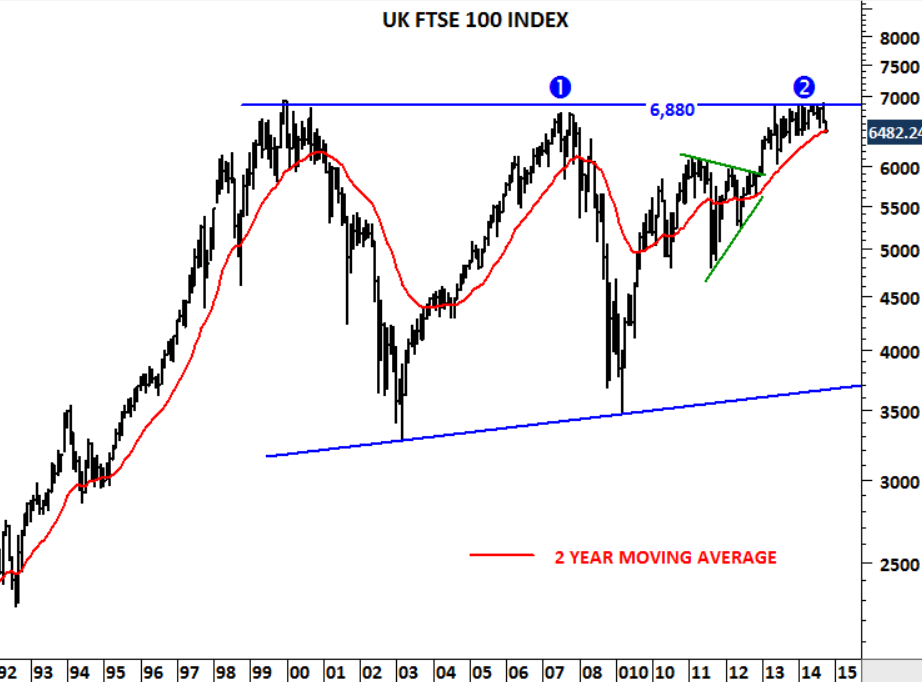
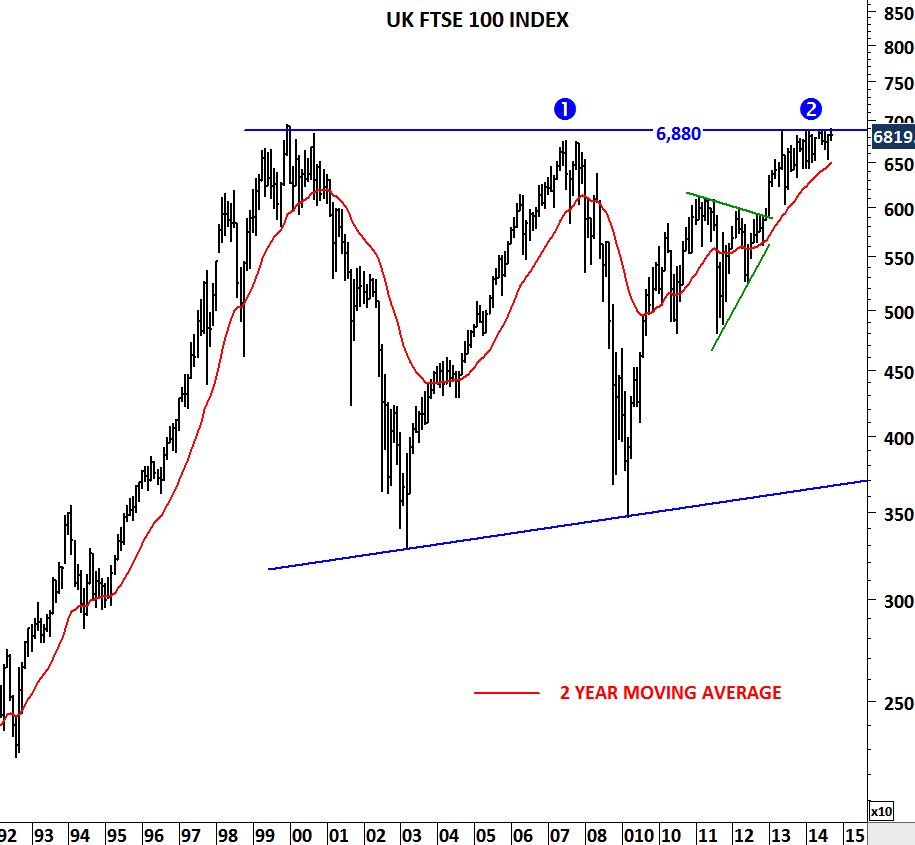
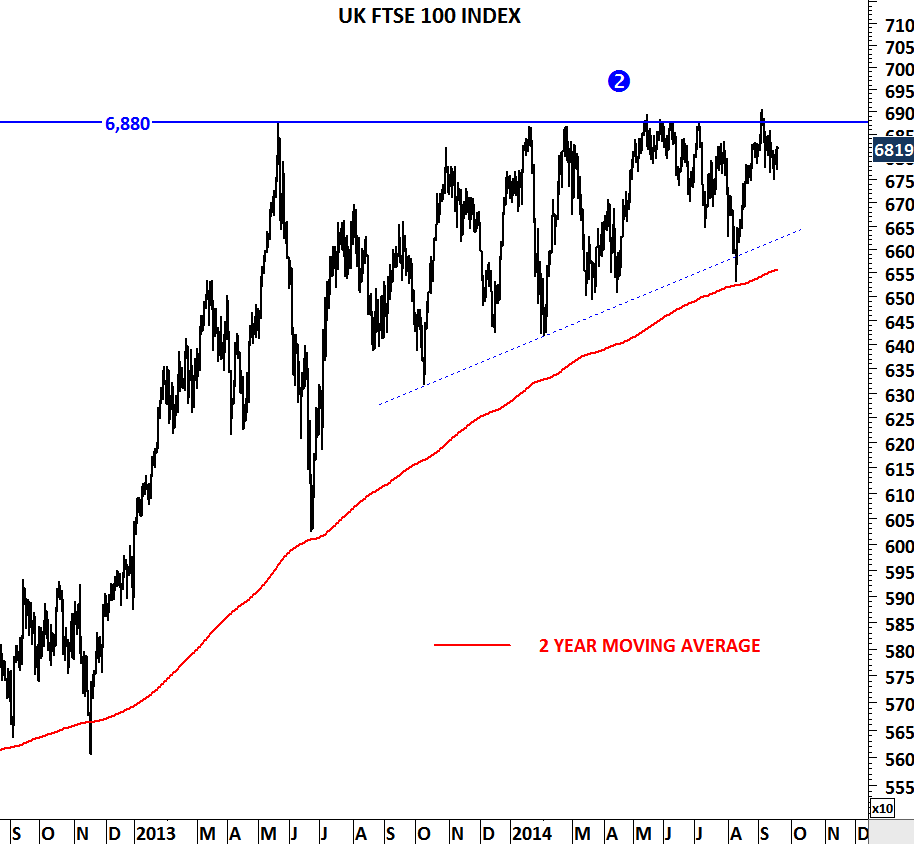
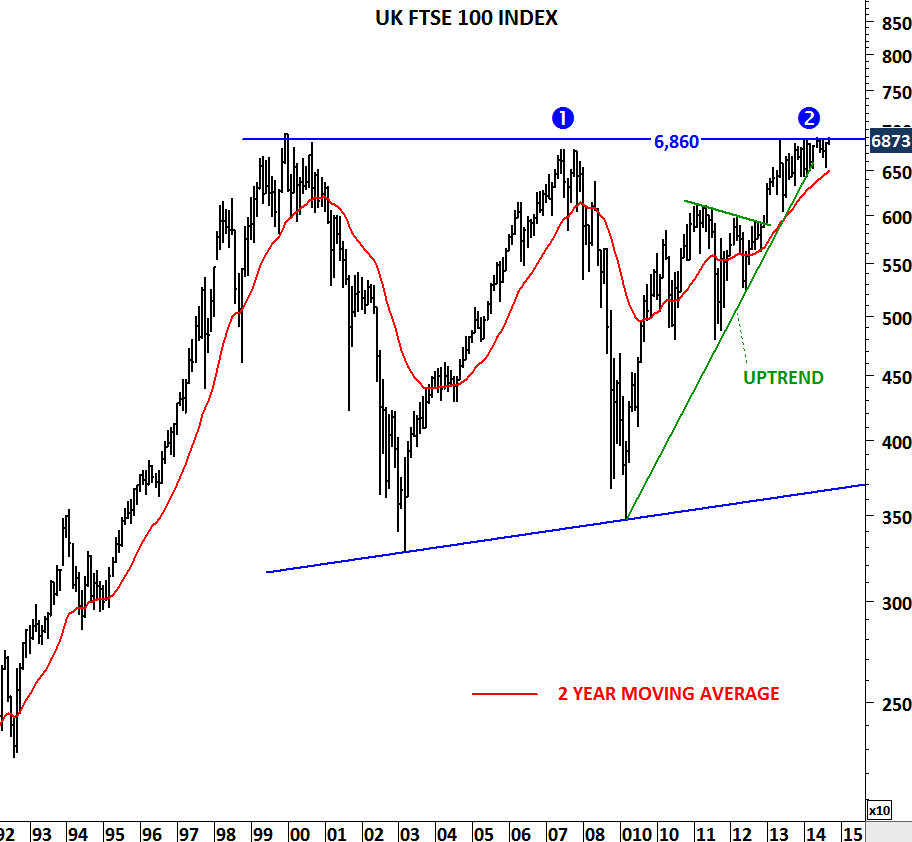
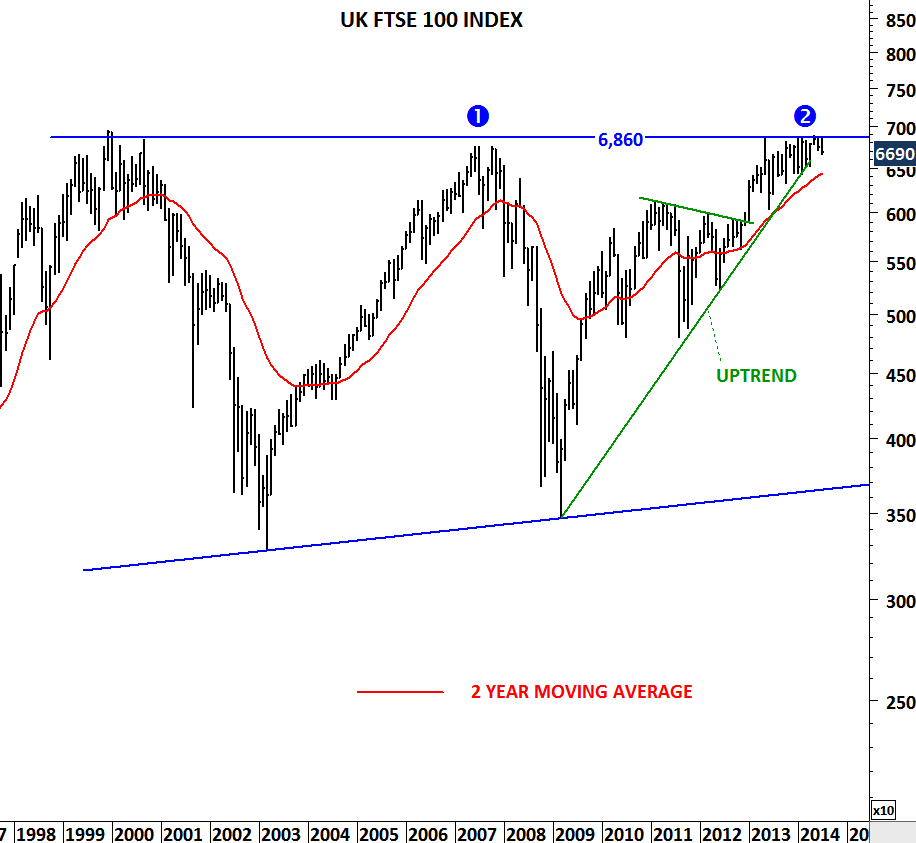
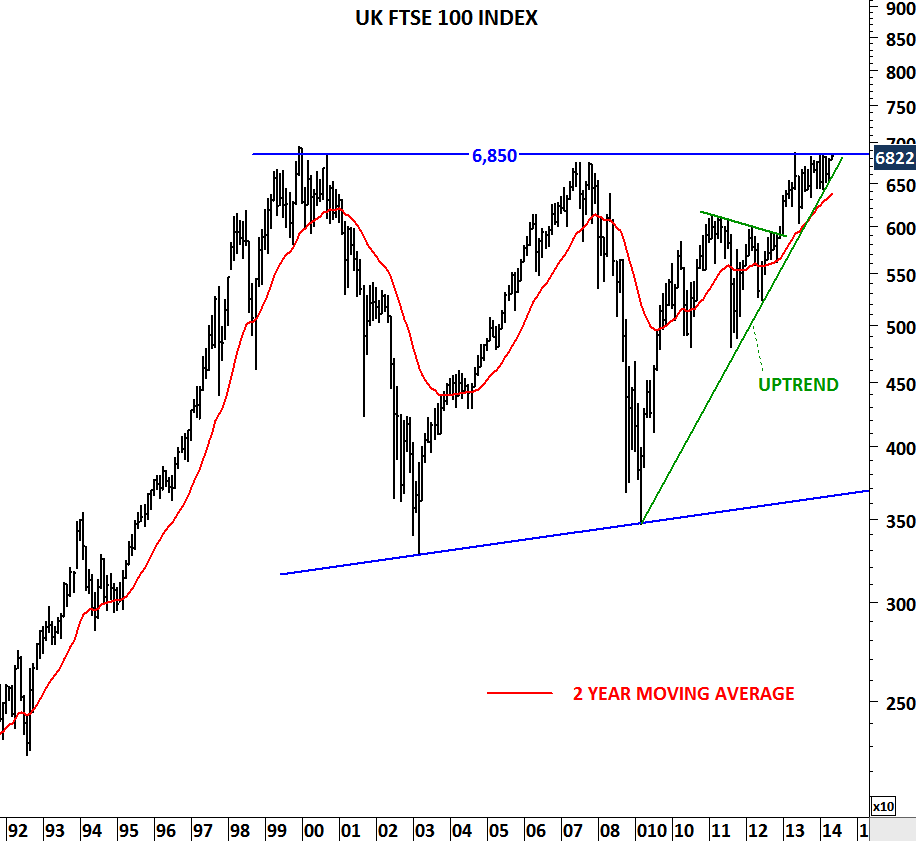
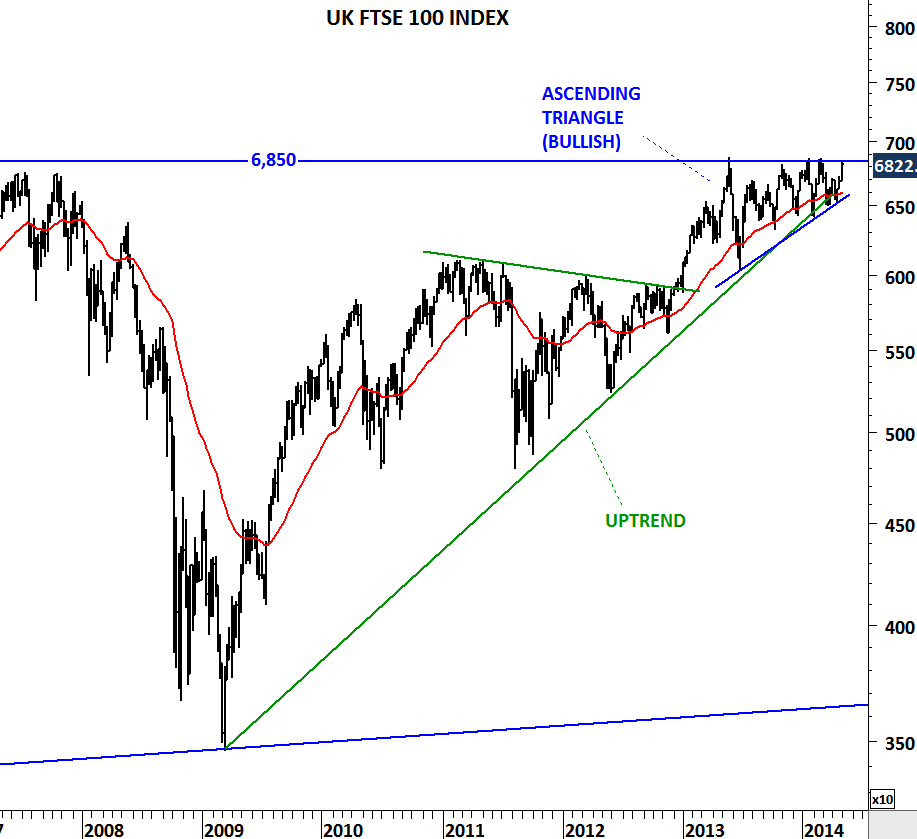
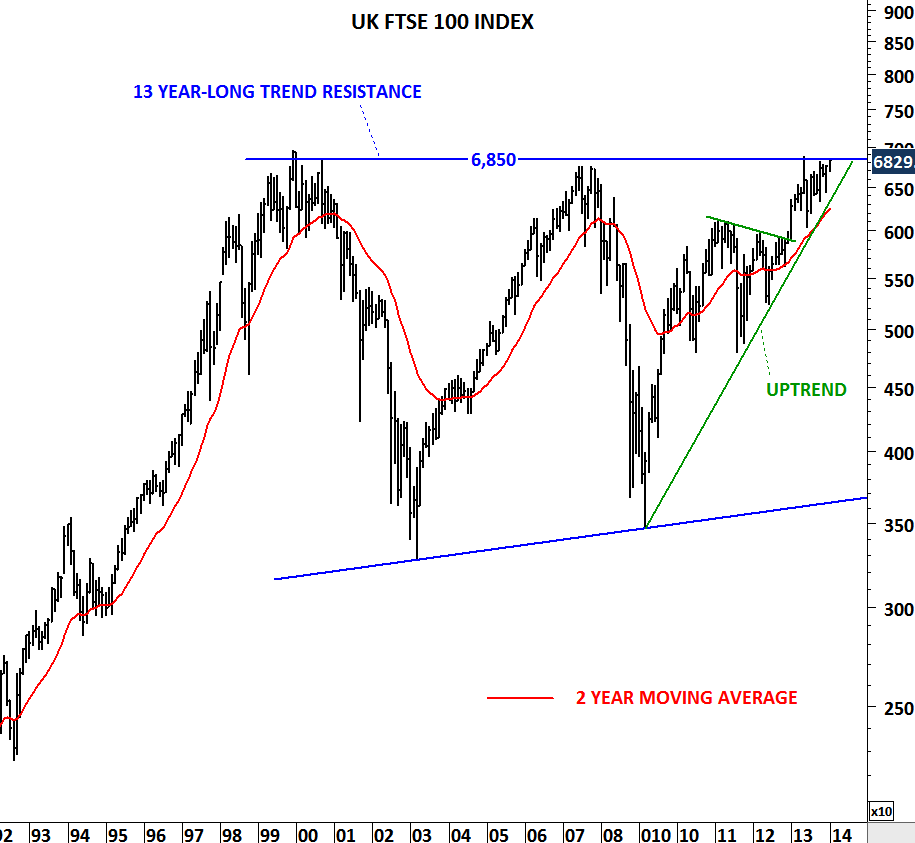
UK FTSE 100 INDEX (.FTSE)

UK FTSE 100 INDEX is setting up for a breakout to all-time high levels. Given the multi-decade long consolidation below 6,950 levels, breakout to all-time high levels above the horizontal resistance can be extremely positive for UK equities.

UK FTSE 100 - QUARTERLY SCALE

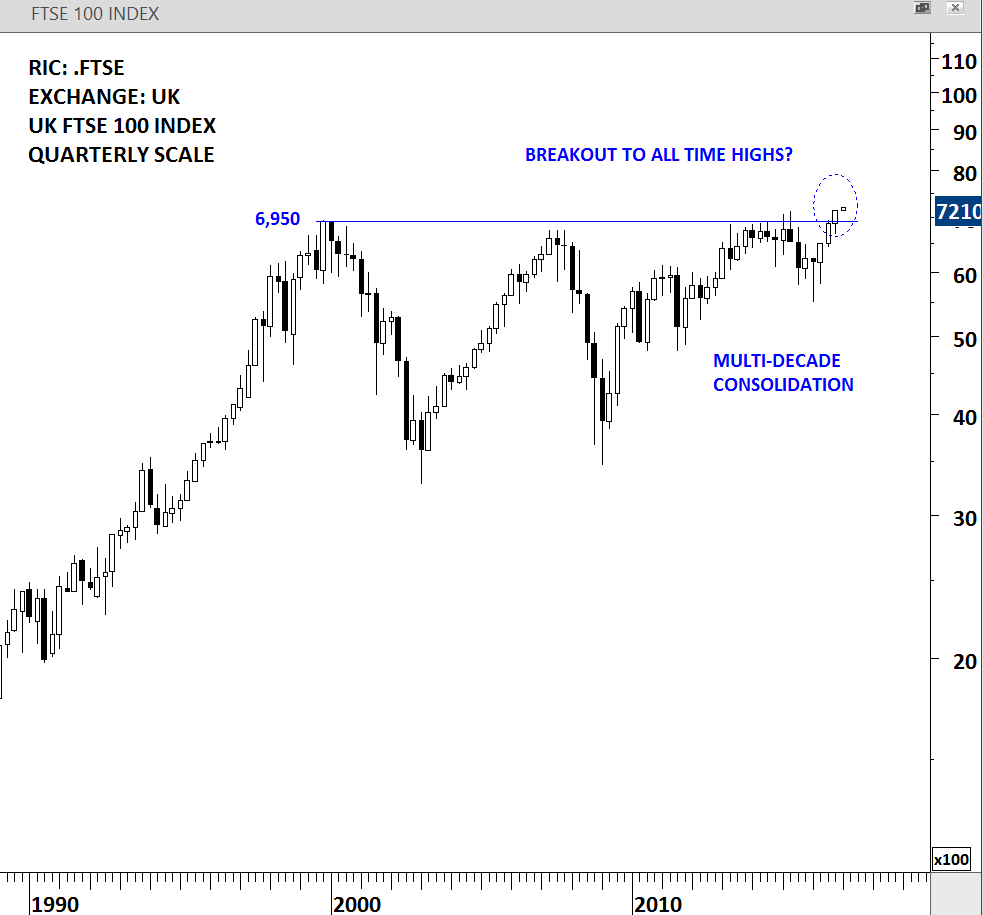
UK FTSE 100 – QUARTERLY SCALE

SUPERGROUP (SGP.L)

SUPERGROUP is a consumer cyclical company listed in the UK. The monthly scale long-term chart shows the strong 6 year-long horizontal resistance at 1705 levels. Strength in the UK FTSE index can result in similar breakouts in UK listed equities. Breakout to all-time highs for SUPERGROUP can be followed by multi-month uptrend.

SUPERGROUP - MONTHLY SCALE

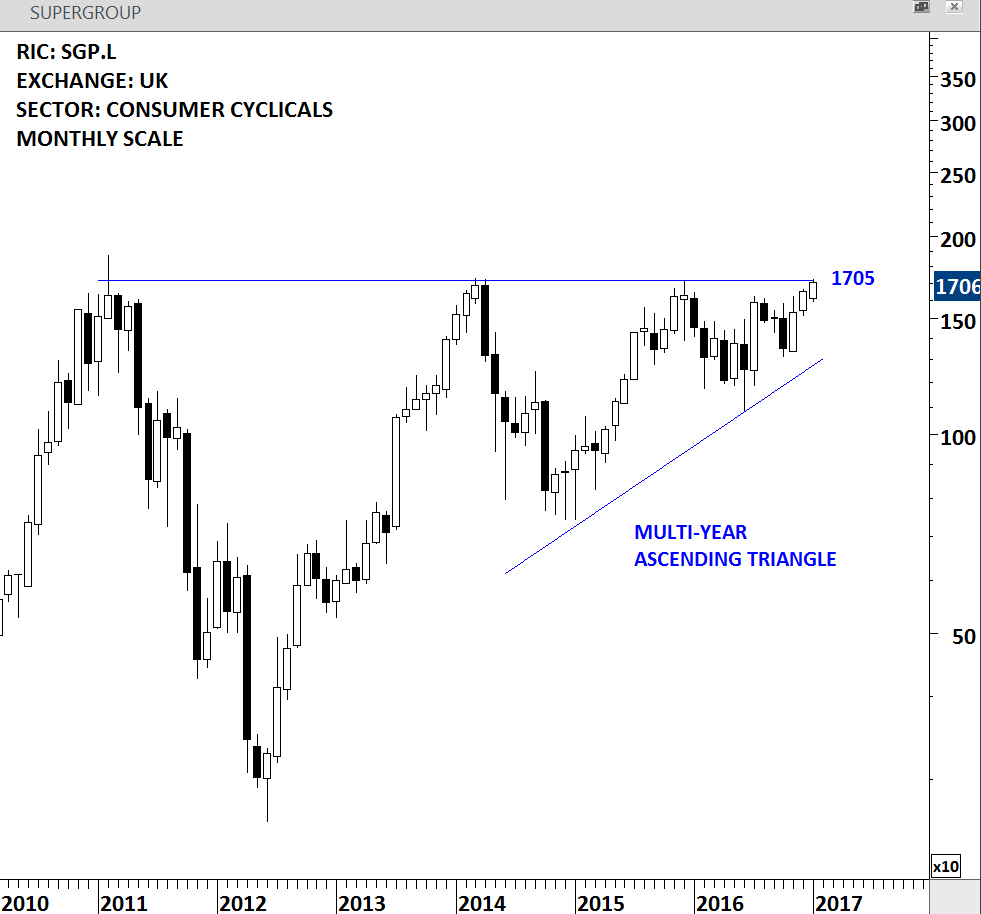
SUPERGROUP – MONTHLY SCALE

SMITH DS (SMDS.L)

DS SMITH PLC is a basic materials company listed in the UK. The stock formed a 16 month-long H&S continuation chart pattern with the strong resistance at 425 levels. Breakout above 425 levels will push the stock to all-time highs. A daily close above 436 levels will confirm the breakout from multi-year continuation chart pattern.

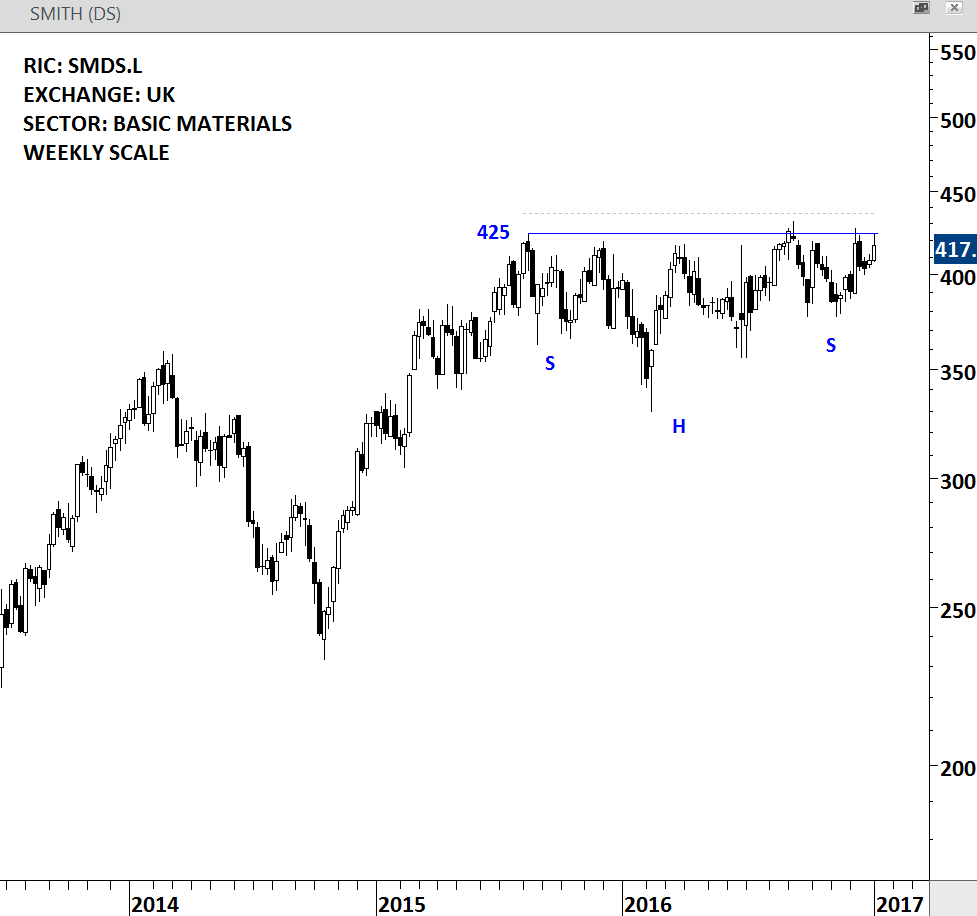
DS SMITH – WEEKLY SCALE

ANDRITZ (ANDR.VI)

ANDRITZ is an industrial company listed in Austria Vienna Stock Exchange. 3 month-long rectangle chart pattern can act as a launching pattern for the year-long symmetrical triangle. Breakout from the 3 month-long rectangle can result in the completion of the year-long symmetrical triangle. A daily close above 50.50 levels will confirm the breakout from the lengthy sideways consolidation.

ANDRITZ - WEEKLY SCALE

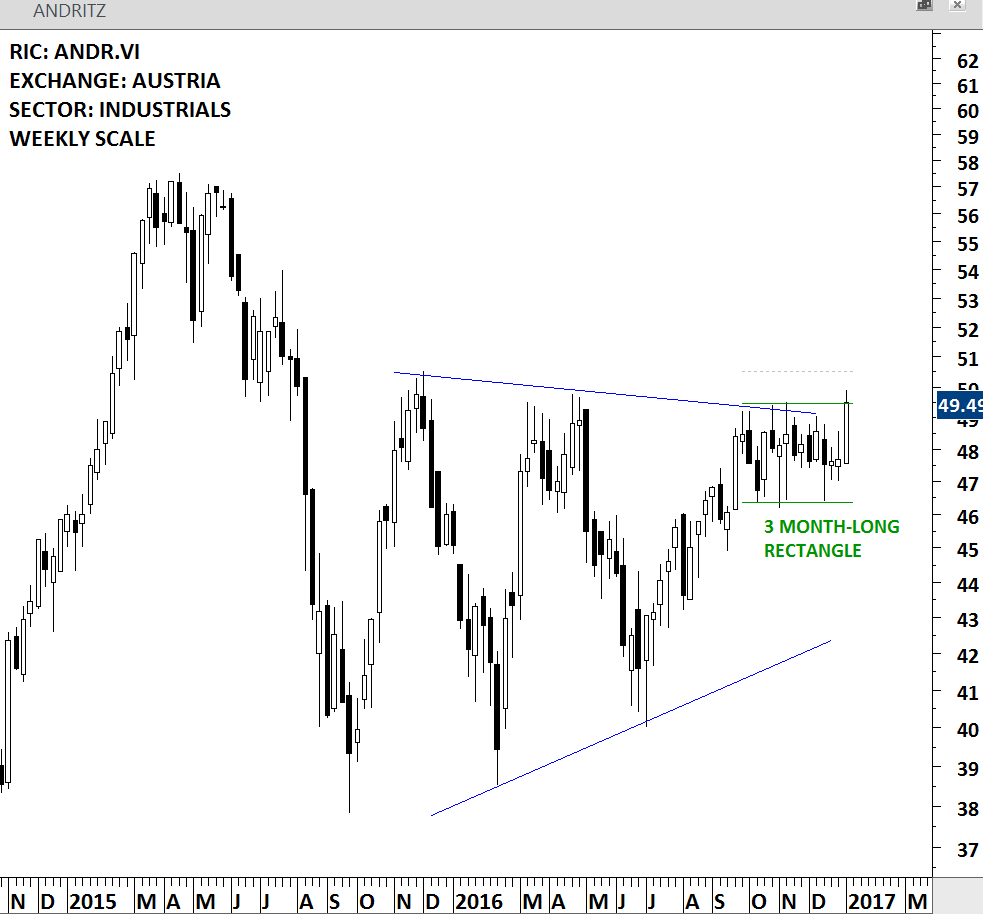
ANDRITZ – WEEKLY SCALE

GENMAB (GEN.CO)

GENMAB is a healthcare company listed in Denmark. Stock formed a 5 month-long rectangle with the upper boundary standing at 1300 levels. Earlier in November 2016, the stock violated the upper boundary. This was possibly a premature breakout which should be followed by the eventual confirmed breakout. A daily close above 1340 levels will confirm the breakout from the 5 month-long sideways consolidation with a possible price target of 1580 levels.

GENMAB - WEEKLY SCALE

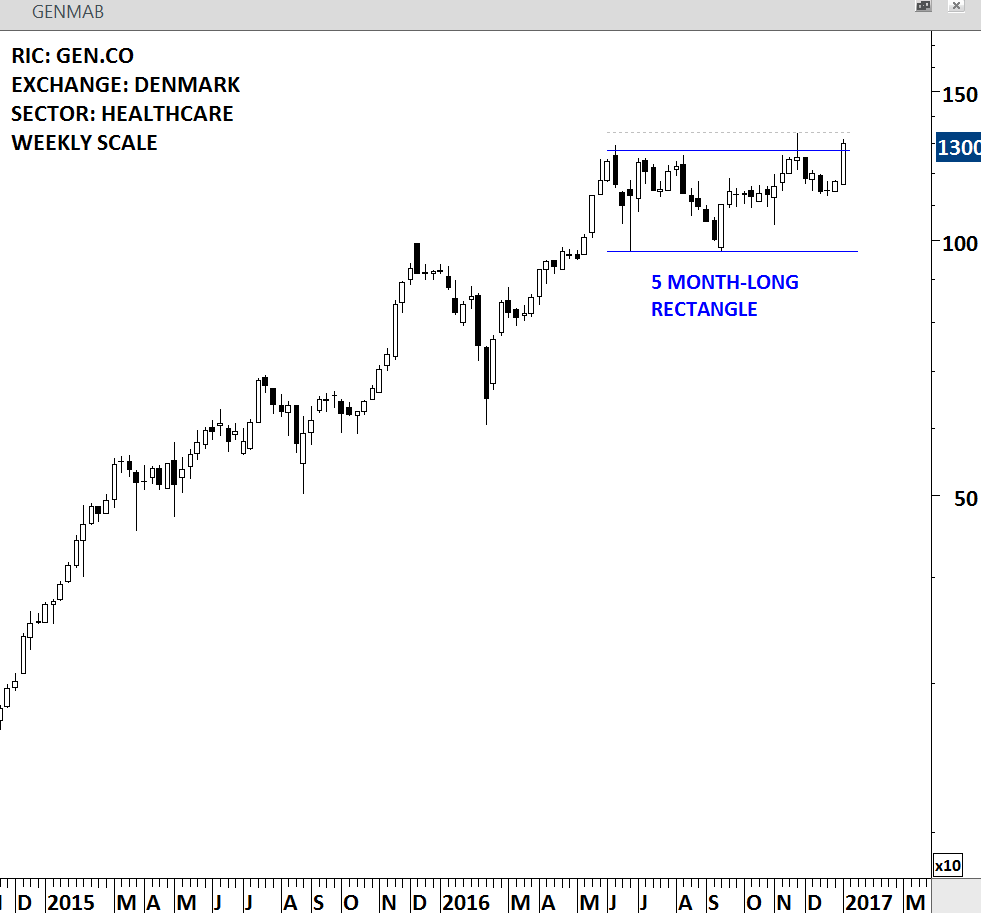
GENMAB – WEEKLY SCALE

PLASTIC OMNIUM (PLOF.PA)

PLASTIC OMNIUM is a consumer cyclical company listed in France. Stock formed a year-long rectangle with the strong horizontal resistance standing at 31 levels. Breakout above 31 levels will push the stock to all-time high levels. Breakouts from horizontal consolidation ranges to all-time high levels are usually followed by increased momentum. A daily close above 32 levels will confirm the breakout from the continuation chart pattern. Rectangle price target stands at 36.70 levels.

PLASTIC OMNIUM - WEEKLY SCALE

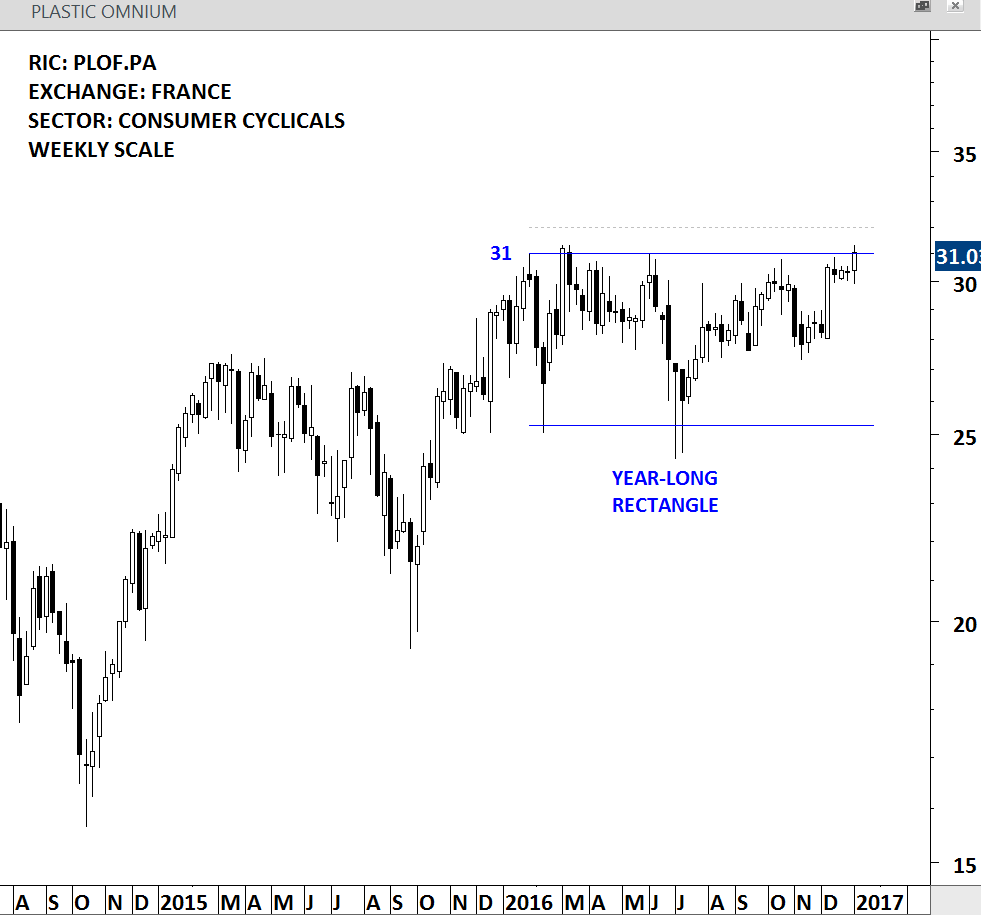
PLASTIC OMNIUM – WEEKLY SCALE

FORMPIPE (FPIP.ST)

FORMPIPE is a technology company listed in Sweden. Stock formed a 16 month-long ascending triangle with the strong horizontal resistance at 9.75 levels. This week’s price action violated the boundary line but the weekly close was below the resistance. A daily close above 10 levels will confirm the breakout from the bullish continuation chart pattern. Ascending triangle price target stands at 12 levels.

FORMPIPE - WEEKLY SCALE

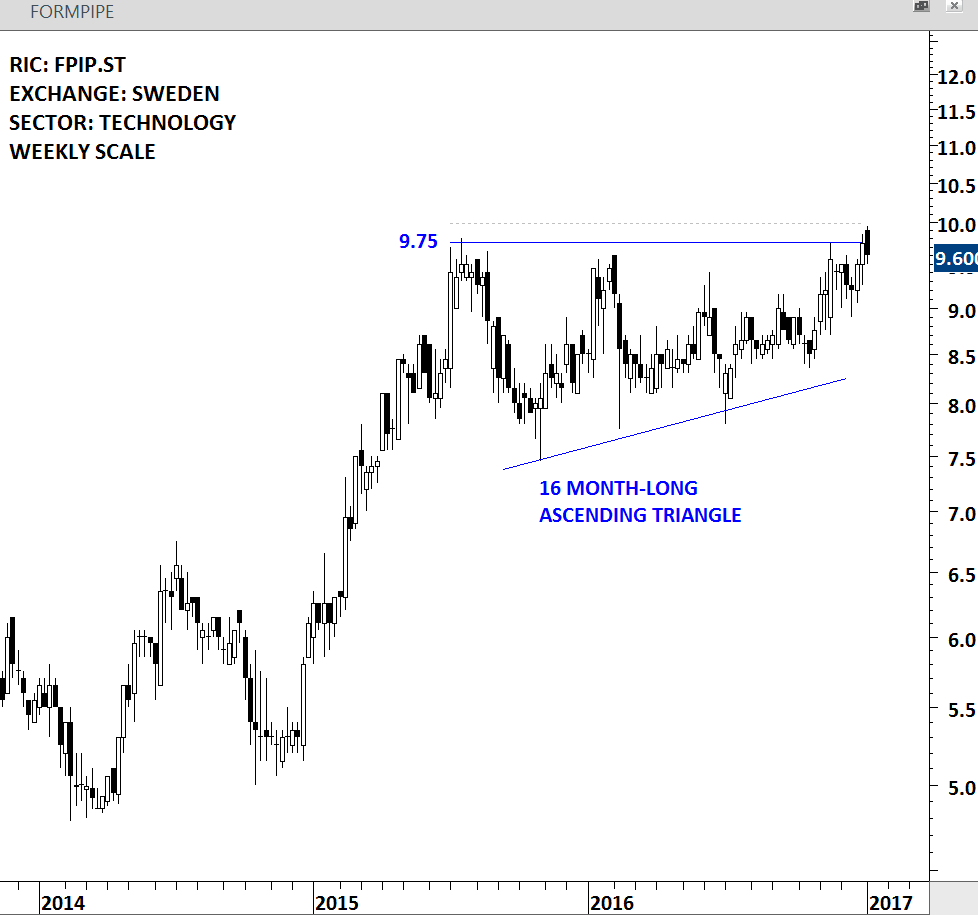
FORMPIPE – WEEKLY SCALE

GOLDWIND (2208.HK)

GOLDWIND is an energy company listed in Hong Kong. Stock price formed 8 month-long rectangle chart pattern with the horizontal boundary standing at 13 levels. A daily close above 13.40 levels will confirm the breakout from the continuation chart pattern. Rectangle chart pattern price target stands at 16 levels.

GOLDWIND - WEEKLY SCALE

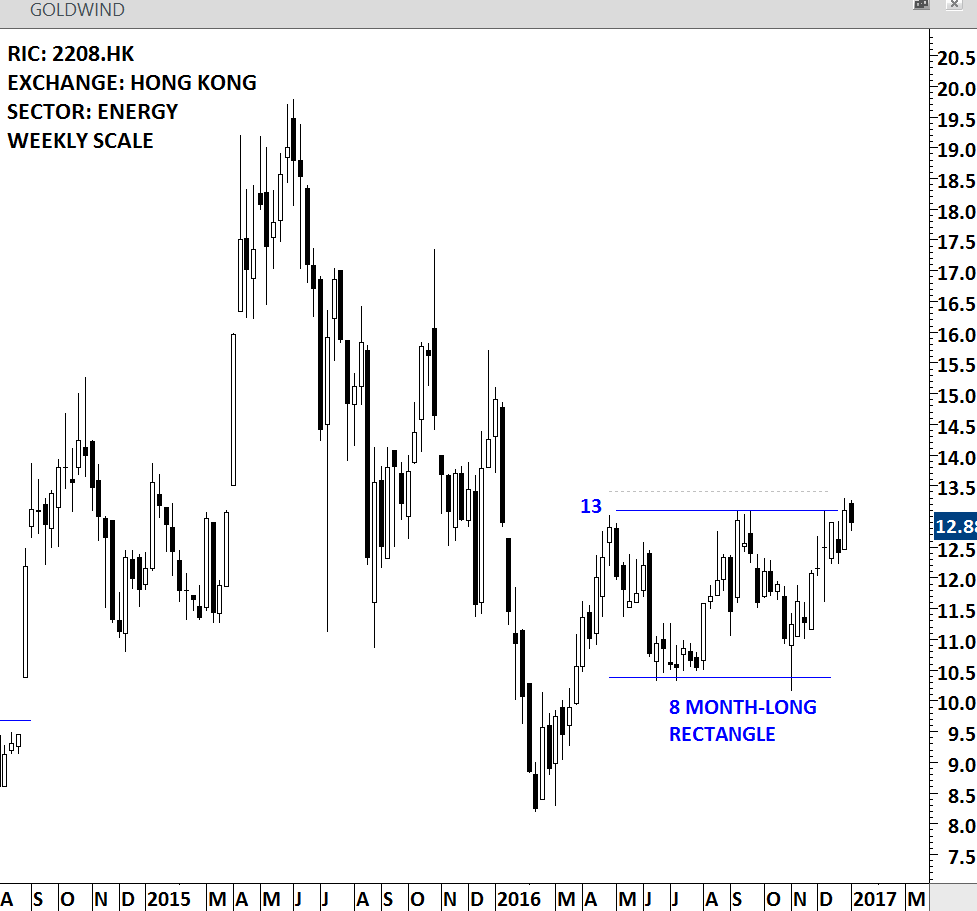
GOLDWIND – WEEKLY SCALE

NETFLIX (NFLX.O)

NETFLIX is a consumer non-cyclical company listed in NASDAQ. Stock formed a year-long rectangle with the horizontal resistance standing at 129.35 levels. This week’s price action was the 4th test of the horizontal boundary. Breakout from the long-term bullish continuation chart pattern can result in another strong trend period for NETFLIX. A daily close above 134 levels will confirm the breakout. Rectangle price target stands at 172 levels.

NETFLIX - WEEKLY SCALE

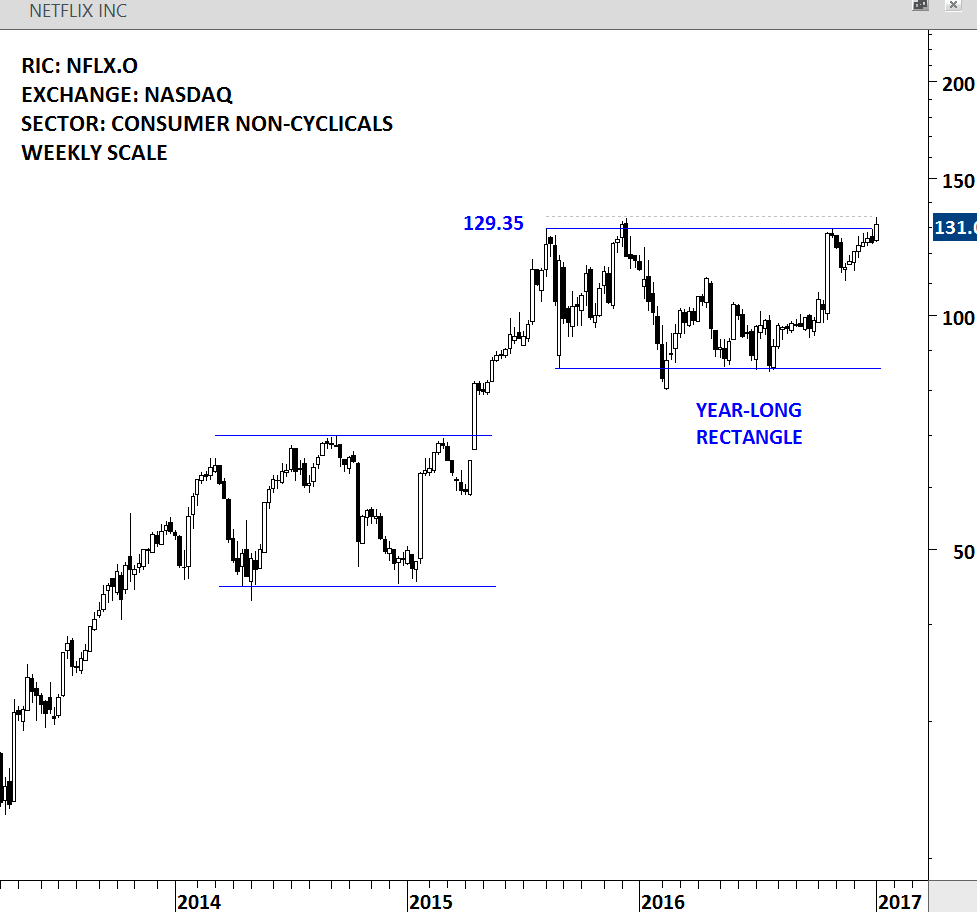
NETFLIX – WEEKLY SCALE

VOLKSWAGEN (VOWG.DE)

VOLKSWAGEN is a consumer cyclical company listed in Germany. Stock formed a year-long ascending triangle that could act as a possible trend reversal. Breakout above the horizontal boundary at 145 levels can fill the gap between 145-160 area. A daily close above 148 levels will confirm the breakout from the year-long ascending triangle. Chart pattern price target stands at 180 levels.

VOLKSWAGEN - WEEKLY SCALE

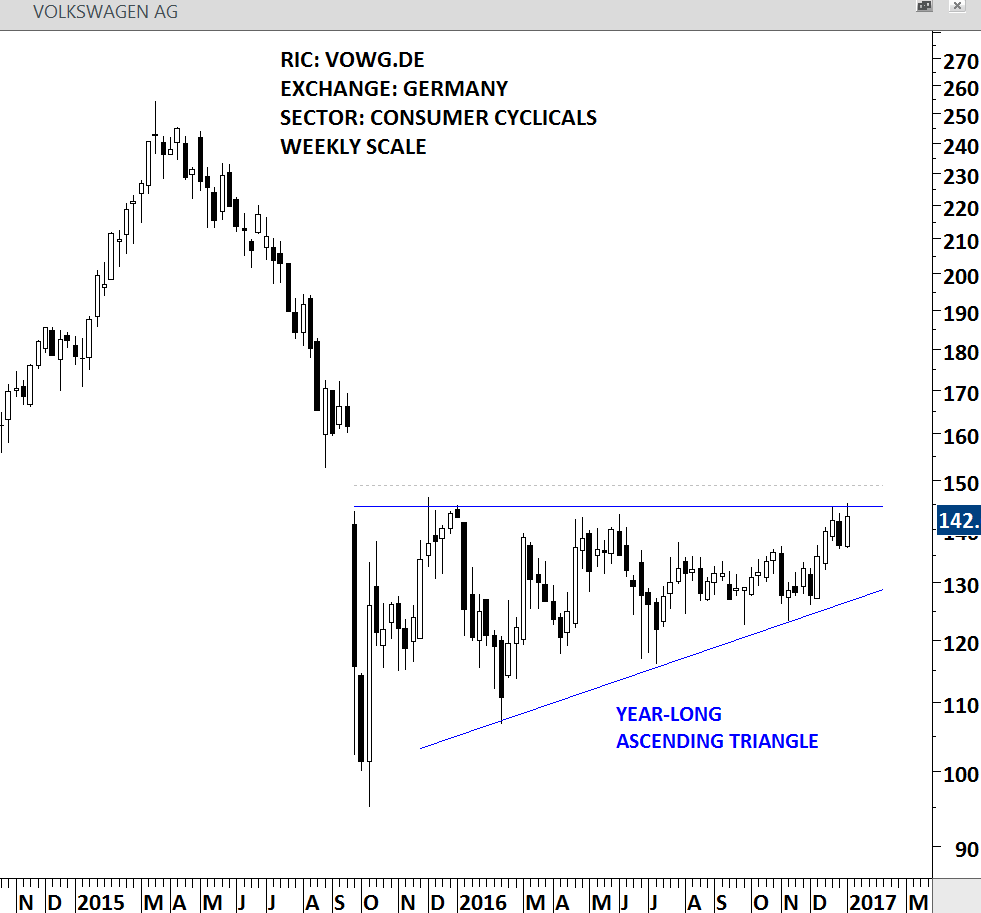
VOLKSWAGEN – WEEKLY SCALE

FAURECIA (EPED.PA)

FAURECIA is a consumer cyclical company listed in France. Stock formed a year-long ascending triangle that could act as a reversal. This week’s price action breached the horizontal boundary at 37.30 levels. A daily close above 38.40 levels will confirm the breakout. Chart pattern price target stands at 46.5 levels.

FAURECIA - WEEKLY SCALE

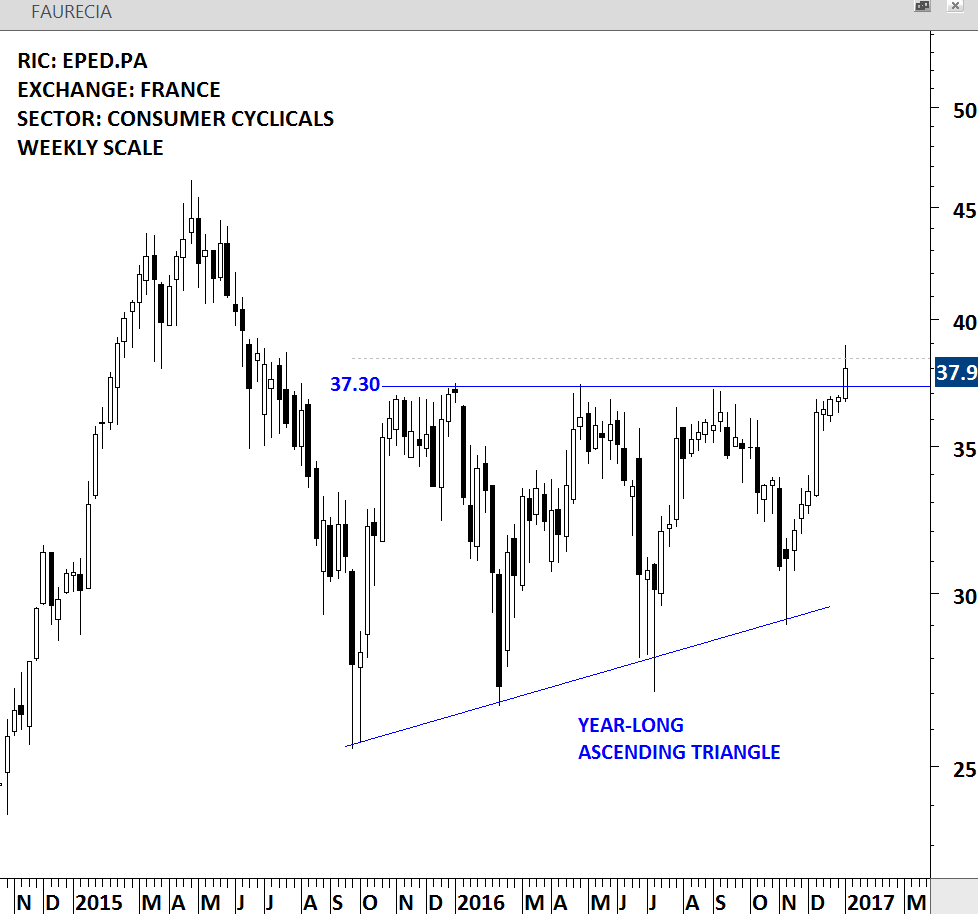
FAURECIA – WEEKLY SCALE

CHINA COMM CONSTRUCTION (1800.HK)

CHINA COMMUNICATIONS CONSTRUCTION is an industrial company listed in Hong Kong. Stock formed an 8 month-long symmetrical triangle continuation chart pattern. Breakout above 9.35 can complete the text book bullish continuation chart pattern with a possible price target of 12.

CHINA COMM CONS - WEEKLY SCALE

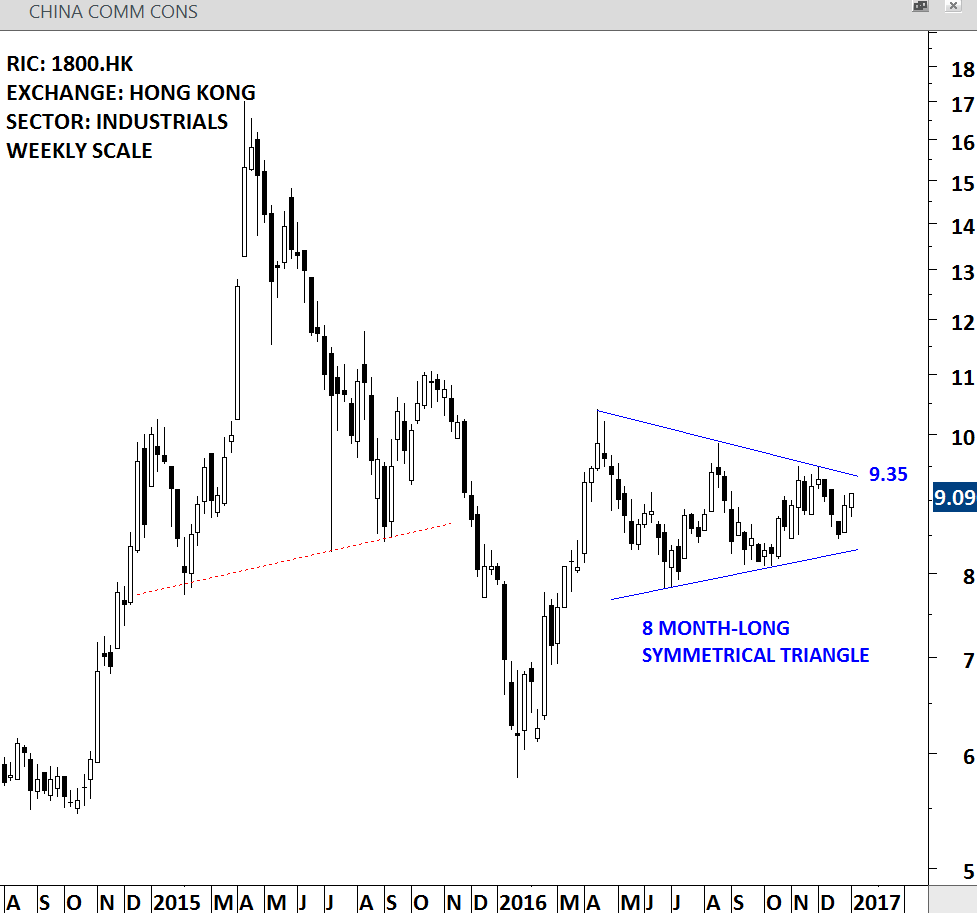
CHINA COMM CONS – WEEKLY SCALE


UK FTSE 100 and STOXX 600

A chart that breaks out to all time high levels has the least resistance. It is called the uncharted territory. Prices are expected to resume their trend after a decisive breakout to all-time high levels. This is what happened with some of the indices over the past few years. I attached below some of the strong breakouts to all-time high levels that have taken place. S&P 500 Index, Germany DAX Index and India BSE SENSEX index are some of them.

S&P 500 INDEX

BSE SENSEX INDEX

GERMANY DAX INDEX

More and more equity indices are now breaking out to all-time high levels or at least preparing for strong breakouts. UK FTSE 100 index is one of them. Index closed the week above strong resistance level at 6,950. Few more weeks of strength will confirm the decade-long breakout.

UK FTSE 100 INDEX

Europe continues to gain strength thanks to ECB. Euro Stoxx 600 index is preparing to clear multi-year resistance at 400 levels. I’m not sure if any of these latest breakouts could end up being bull trap. The best available information (latest price information) suggests strength and increase in upside momentum in global equity indices.

EURO STOXX 600 INDEX

MSCI ALL COUNTRIES WORLD INDEX is now challenging multi-year resistance. Decisive monthly scale close above 430 will confirm the breakout.

MSCI ALL COUNTRIES WORLD INDEX

UK FTSE 100, STOXX 50, NIKKEI 225

Global equity indices are gaining upside momentum. Recent breakouts above long-term trend lines suggest multi-month uptrends. Last week's price action pushed UK FTSE 100 index to all time high levels. Charts that are very close to long-term breakouts: MSCI ALL COUNTRIES WORLD INDEX, EURO STOXX 50 INDEX and UK FTSE 100 INDEX.

Positive price action is likely to continue in the developed market equities.

JAPAN NIKKEI 225 INDEX

Read More

NIKKEI, STOXX and FTSE

It is the time to take a more defensive stance in the global equity markets. MSCI All Countries World Index which includes the performance of developed and emerging markets, found resistance at 430 levels and reversed. MACD, a momentum indicator is generating a sell signal on the monthly scale chart. These are all bearish signals.

MSCI ALL COUNTRIES WORLD INDEX

STOXX 50 index found resistance at 14 year-long trend line at 3,100 levels. It needed a lot of momentum to clear such hurdle and it looks like the European equity benchmark failed to clear the strong multi-year resistance. Strong resistance remains at 3,100 levels.

STOXX 50 INDEX

Japan’s NIKKEI 225 index failed to clear 16,500 levels, another multi-year resistance. Index can pull back to its 2 year-long average at 14,000 levels. For now the market doesn’t have the strength to clear the strong long-term resistance.

NIKKEI 225 INDEX

UK’s FTSE 100 index reversed from strong multi-year resistance at 6,880 levels. The index failed to breakout to all-time high levels. Resistance remains at 6,880. Breakdown below the 2 year-long average at 6,400 levels can send the index towards 6,000 levels.

UK FTSE 100 INDEX

UK FTSE 100 INDEX

Scotland will remain part of United Kingdom following historic referendum vote. What is next for the financial markets? Over the past few weeks we have seen increased volatility in the currency markets. GBP/USD cross rate fell from 1.68 levels to 1.60. It is now rebounding back to 1.645 levels. For the equity markets we can’t say the same. It’s been relatively quiet. UK FTSE 100 index remained below the historical high levels at 6,880. This is a 15 year-long resistance and I believe breakout to all-time high levels will be very positive. Below I shared two charts on the UK FTSE 100 index. A monthly chart that covers the last 25 years and a daily chart that shows the last 2 years consolidation. Over the past 2 years there has been 6 to 7 attempts to clear the  resistance at 6,880 levels. None of them were successful. Both the long-term and the short-term chart suggests a breakout above 6,880 should be powerful and push UK FTSE 100 index higher in the coming months.

UK FTSE 100 INDEX II

Monthly scale chart of UK FTSE 100 index

UK FTSE 100 INDEX III

Daily scale chart of UK FTSE 100 index

STOXX 50, NIKKEI and FTSE 100

Global equity markets are at a critical juncture. Most of the major equity benchmarks are testing multi-year trend resistances. These are decade-long trend lines and if they are broken on the upside, it will signal further equity market strength for coming years.

STOXX 50 (includes UK companies), an equity benchmark for Europe, is testing 14 year-long trend resistance at 3,100 levels. While breakout would require a significant amount of energy (either positive news flow or expectation of positive economic outlook in the Euro zone), such price action (a decisive break above 3,100) will be extremely bullish for the European equities.

STOXX 50 INDEX

Japan’s Nikkei 225 index is testing a 20 year-long trend resistance at 16,500 levels. Decisive break above the strong multi-decade resistance will be extremely positive for the Japanese equities.

NIKKEI 225 INDEX

UK’s FTSE 100 index is now challenging historical high levels at 6,860. Breakout above the multi-decade horizontal resistance will also be a bullish signal for the global equity markets.

UK FTSE 100 INDEX

Last but not least, MSCI ALL COUNTRIES WORLD INDEX, which is a broad representation of global equity market performance is challenging historical high levels.

MSCI ALL COUNTRIES WORLD INDEX

S&P 500, STOXX 50, NIKKEI and FTSE 100

S&P 500 index cleared its historical high level at 1,580 levels. U.S. equities have clearly outperformed the rest of the global equity markets. So far so good… But without Japan, Europe and UK how far can the positive trend in equities reach? Long-term charts show that Stoxx 50, Nikkei 225 and FTSE 100 indices have reached strong long-term resistance levels. Only after a breakout above these long-term resistances will global equities have more fuel to resume their long-term uptrend. Failure to breakout from these consolidations in the following months can be negative for equity markets.

S&P 500 INDEX

EURO STOXX 50

NIKKEI 225 INDEX

UK FTSE 100 INDEX

UK FTSE 100

If markets are going to move higher, especially in Europe, UK’s FTSE 100 index is my top candidate for a strong breakout. Index is testing 13 year-long horizontal resistance at 6,850 levels. The fact that the market hasn’t pulled back from the resistance area shows its strength and possibly its willingness to clear the multi-year resistance. Of course, this has to be seen in the form of a decisive close above the strong resistance. In the medium-term index formed a bullish ascending triangle. Breakout above 6,850 levels will have long-term implications. Breakdown below 6,500 levels can change the bullish outlook to neutral/negative.

UK FTSE 100 INDEX

UK FTSE 100 INDEX II

INDIA, U.K. and JAPAN

Over the past few years equity markets had strong performance. Developed markets did better than the emerging markets but overall it has been positive for equity asset class. In this update I’m sharing with you 3 long-term charts that can be the center of attention in 2014. Possible breakouts in these 3 markets can add fuel to the equity strength in the following months. India’s BSE Sensex index, U.K. FTSE 100 index and Japan’s NIKKEI 225 index are testing their long-term trend resistances. Breakout above these long-term strong technical levels can result in a multi-month uptrend and attract more investors.

INDIA BSE SENSEX INDEX

UK FTSE 100 INDEX

JAPAN NIKKEI 225 INDEX

SPAIN IBEX 35 INDEX & EUROPE

While most of the european markets are recovering or have been performing much better since the beginning of 2012, some had extremely poor performance. In this post I’m analyzing Spain’s IBEX 35 index and comparing it with other European country indices to see the ones that are recovering, performing better and worse. This should give us an intermediate-term overview of European equities performance. I believe if we need to rank the countries from poor performance to better performance (Spain, Portugal, Italy & Greece) should be in the poor performance category, (Switzerland, Sweden, Netherlands, Ireland, France, Finland, Belgium and Austria) should be in the recovering category and (Norway, Denmark, UK and Germany) should be in the better performance category.

If we analyze Spain’s IBEX 35 index, it has been pressured by the long-term moving average (200 day) and is now testing the lower side of its 8 months-long consolidation range. RSI failed to move above 50 levels in the past three attempts and price also failed to breach the long-term average. Now the question is will the index also break down the intermediate-term consolidation range? This will be answered by the market in the next few weeks. Unless we see a sharp reversal from the support at 7,800 level IBEX 35 can fall back to 2009 low levels at 6,700. Index should clear 8,800-9,200 area to be ranked in the recovering category.