Posts

GLOBAL EQUITY MARKETS – September 29, 2018

REVIEW


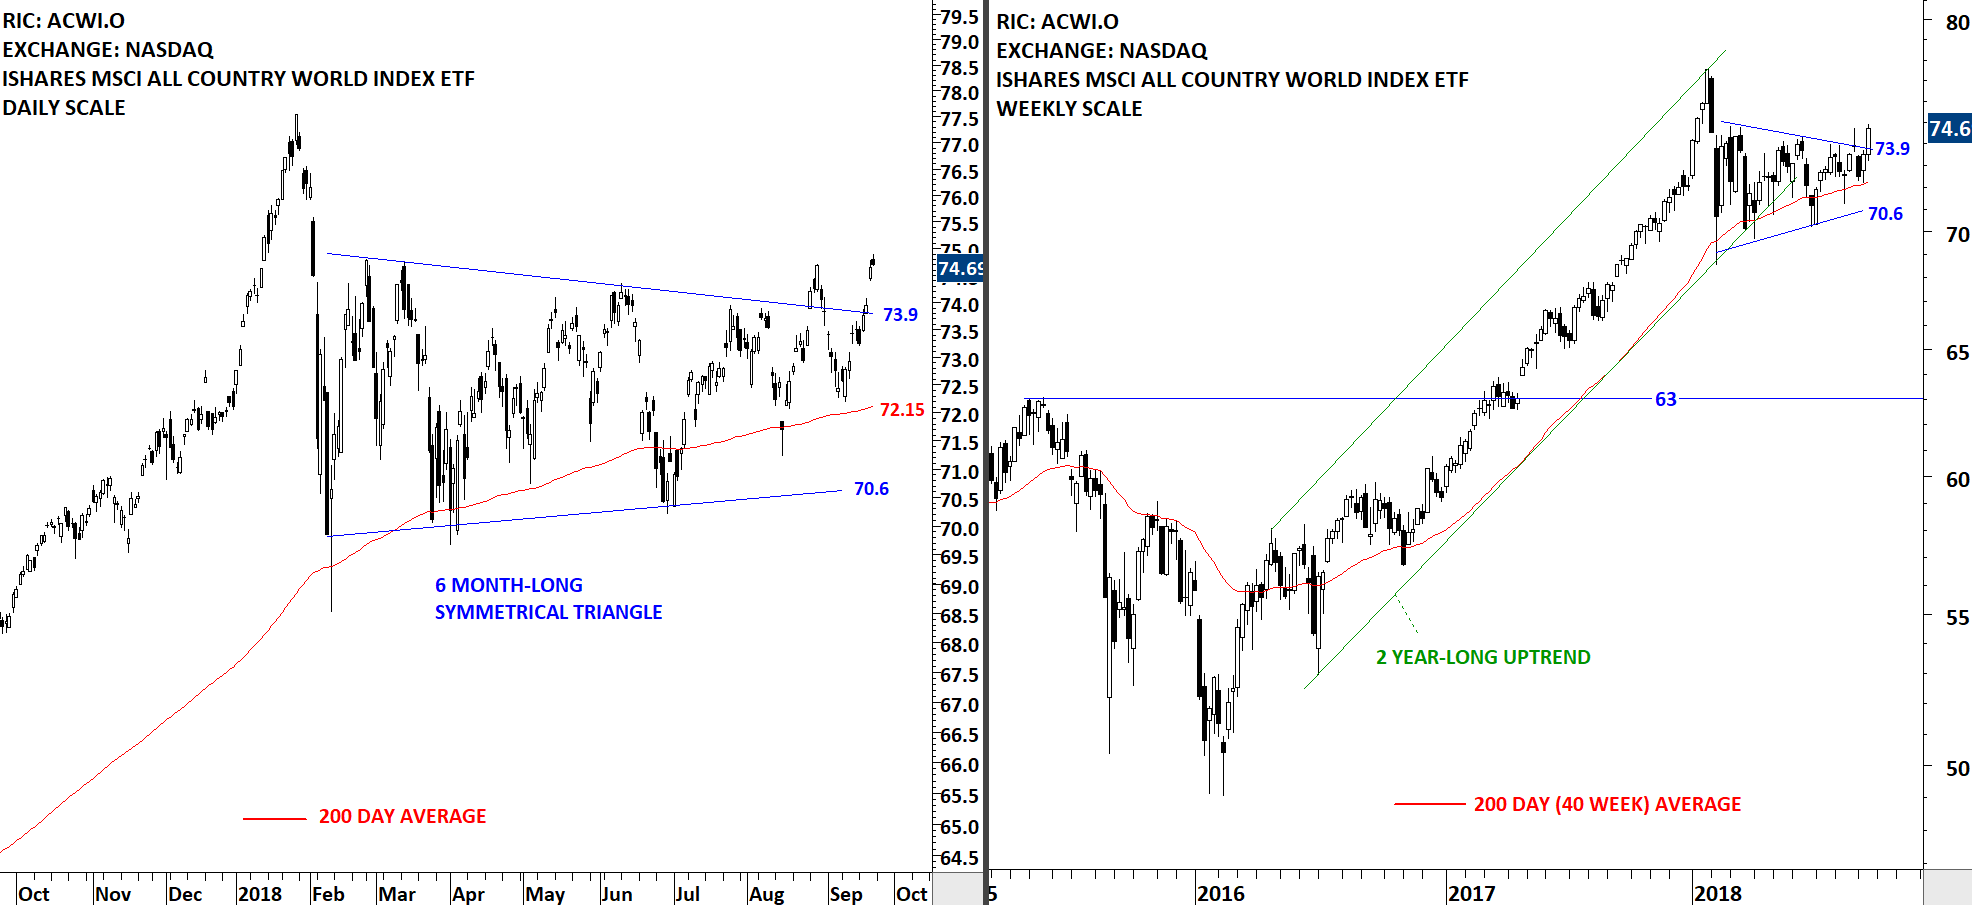
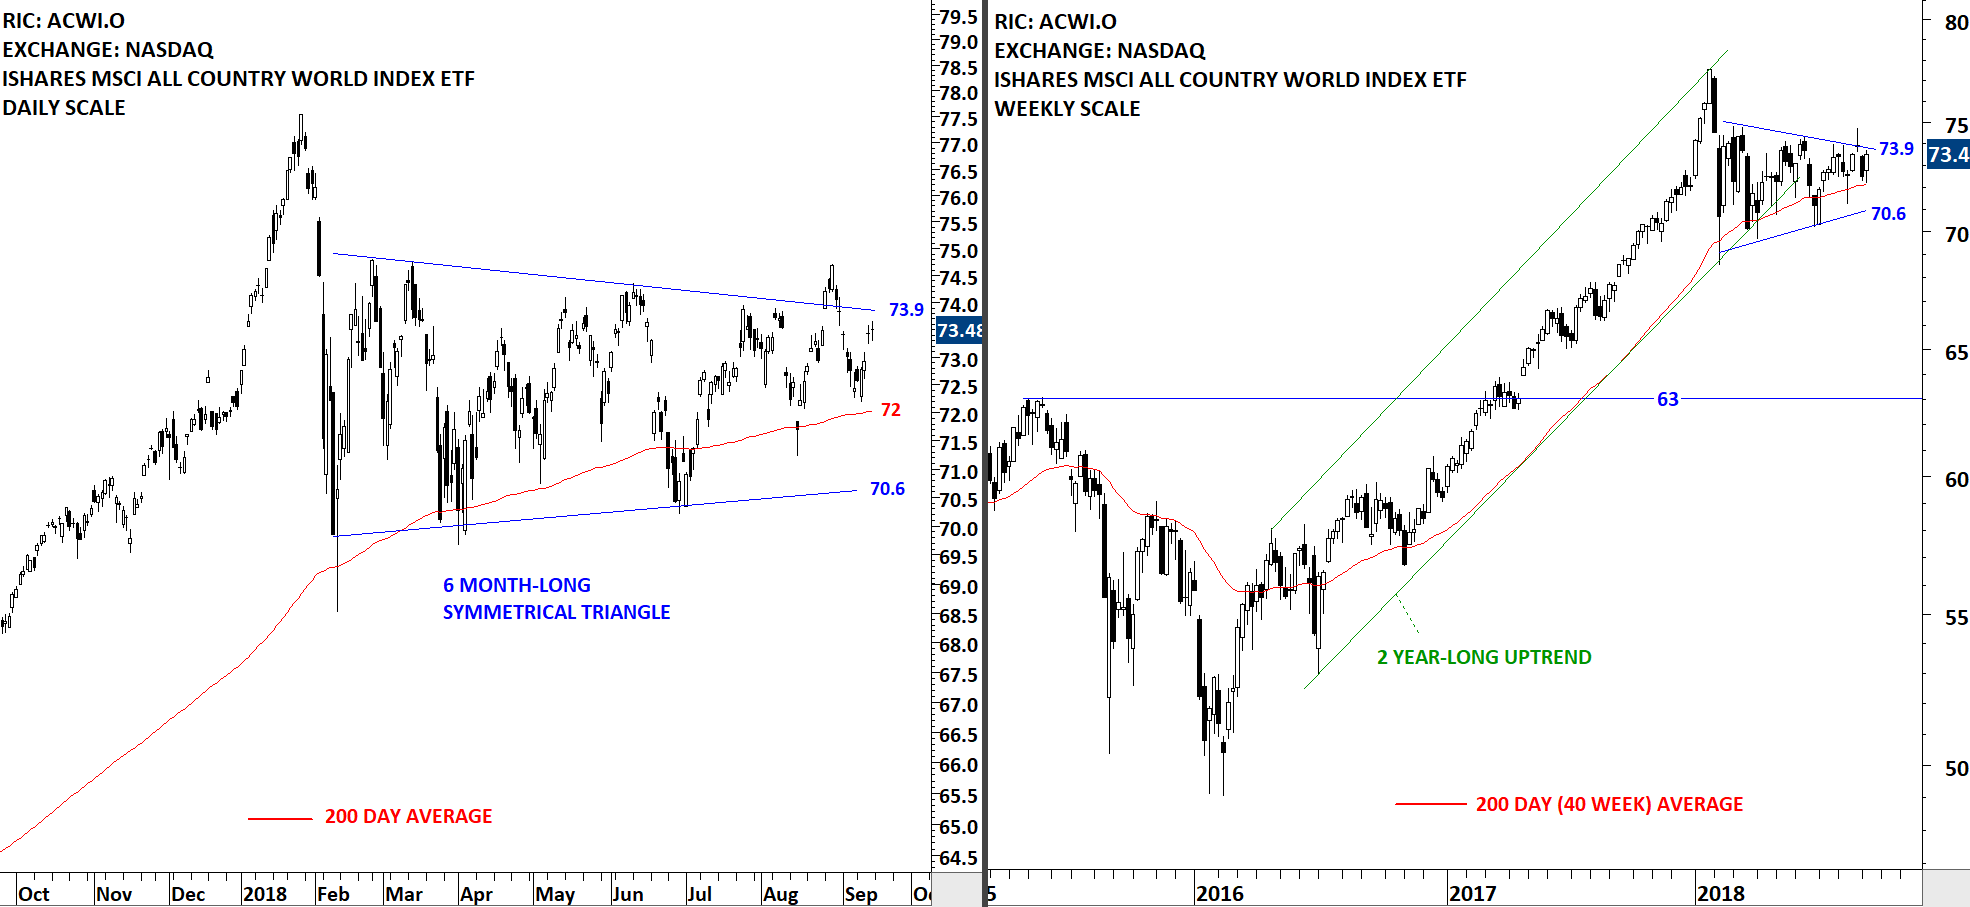
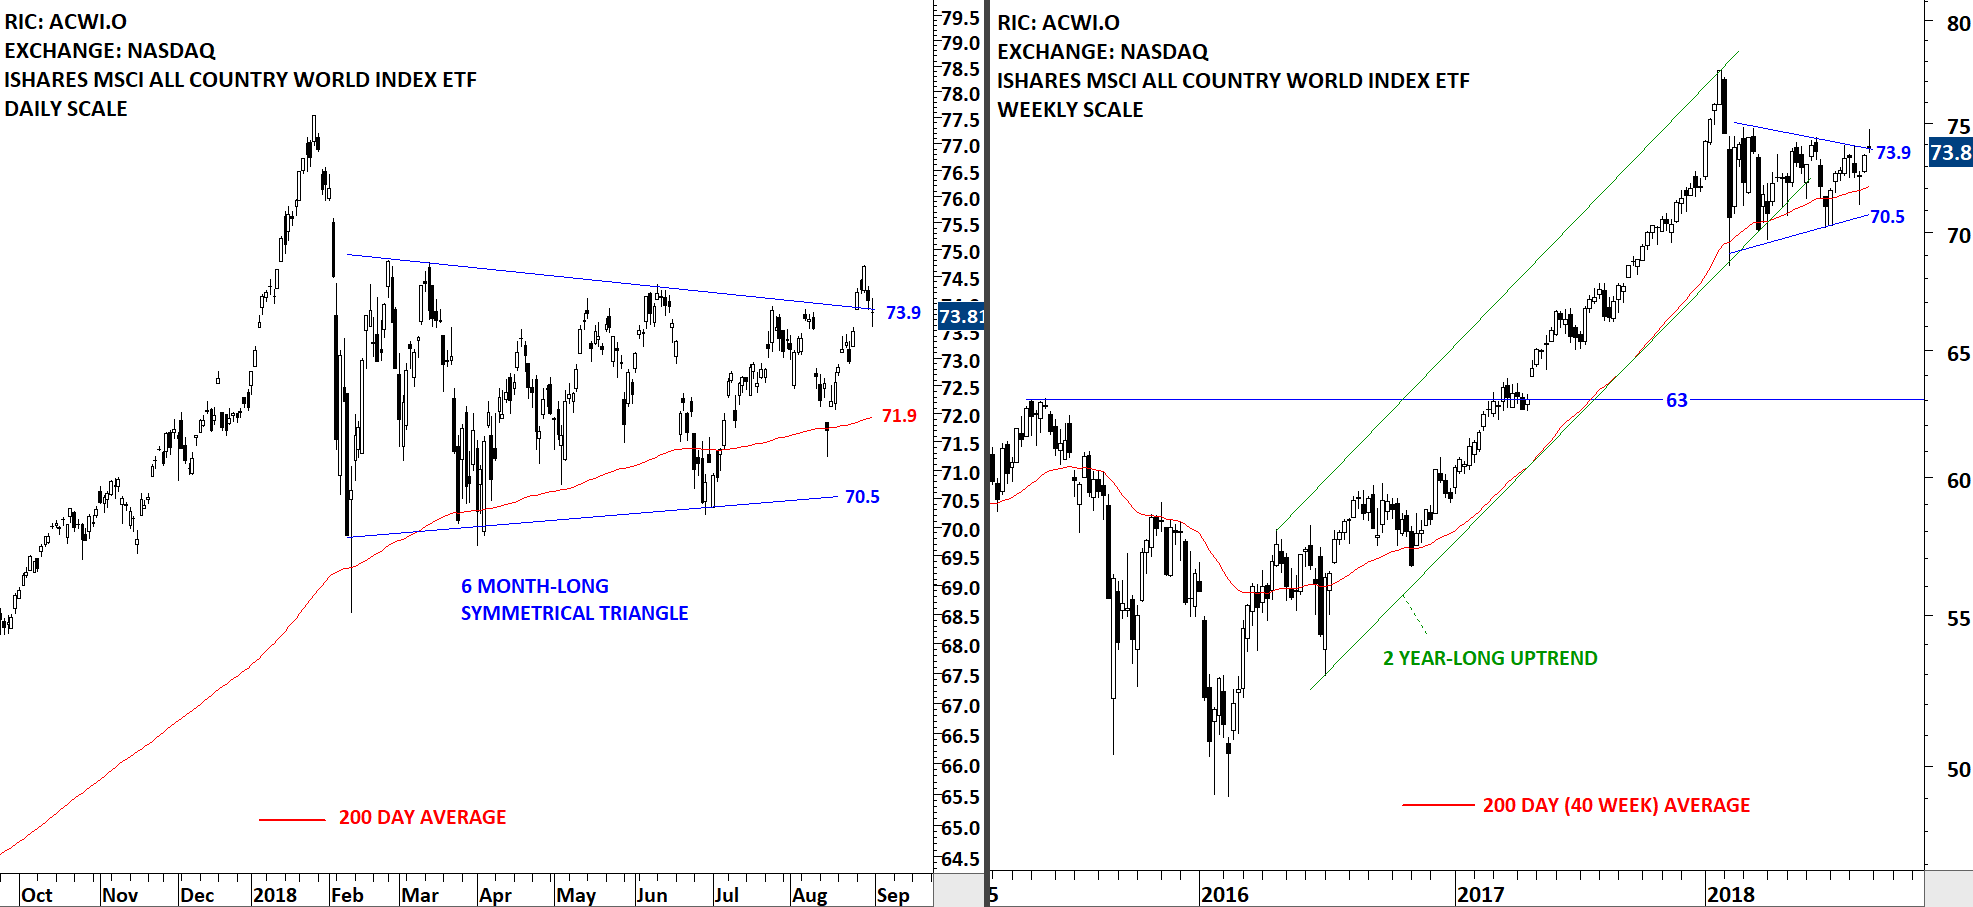
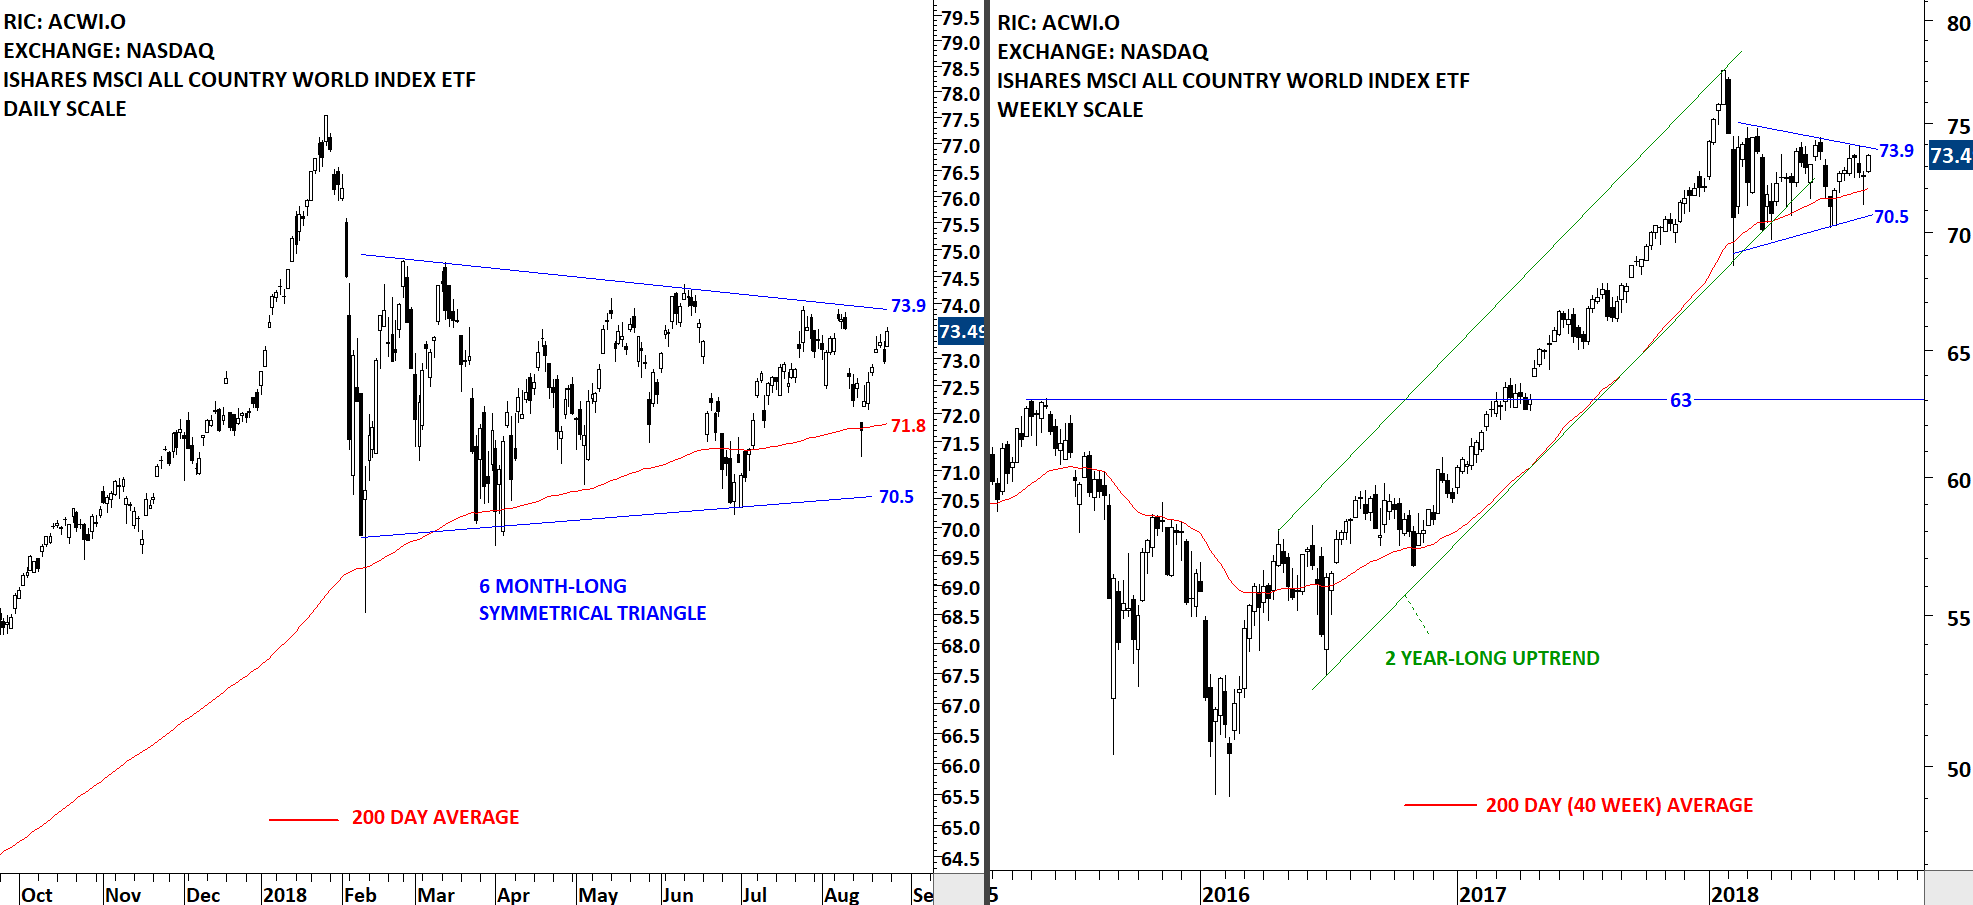
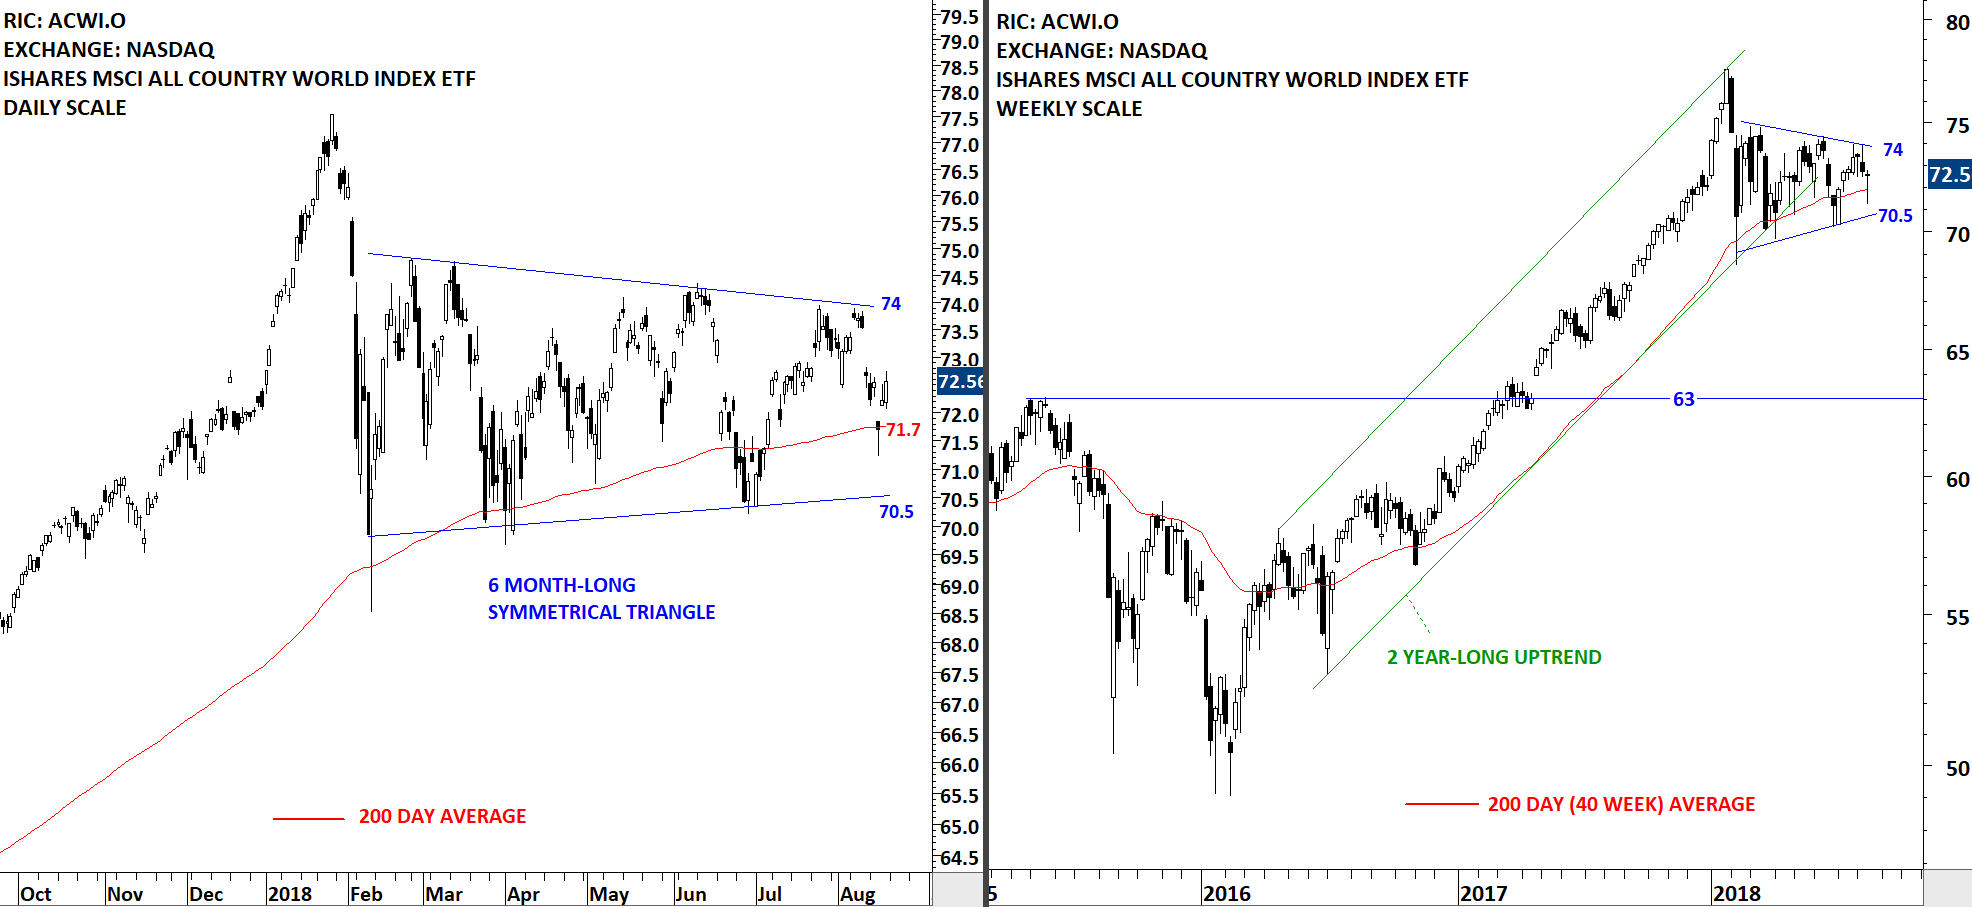
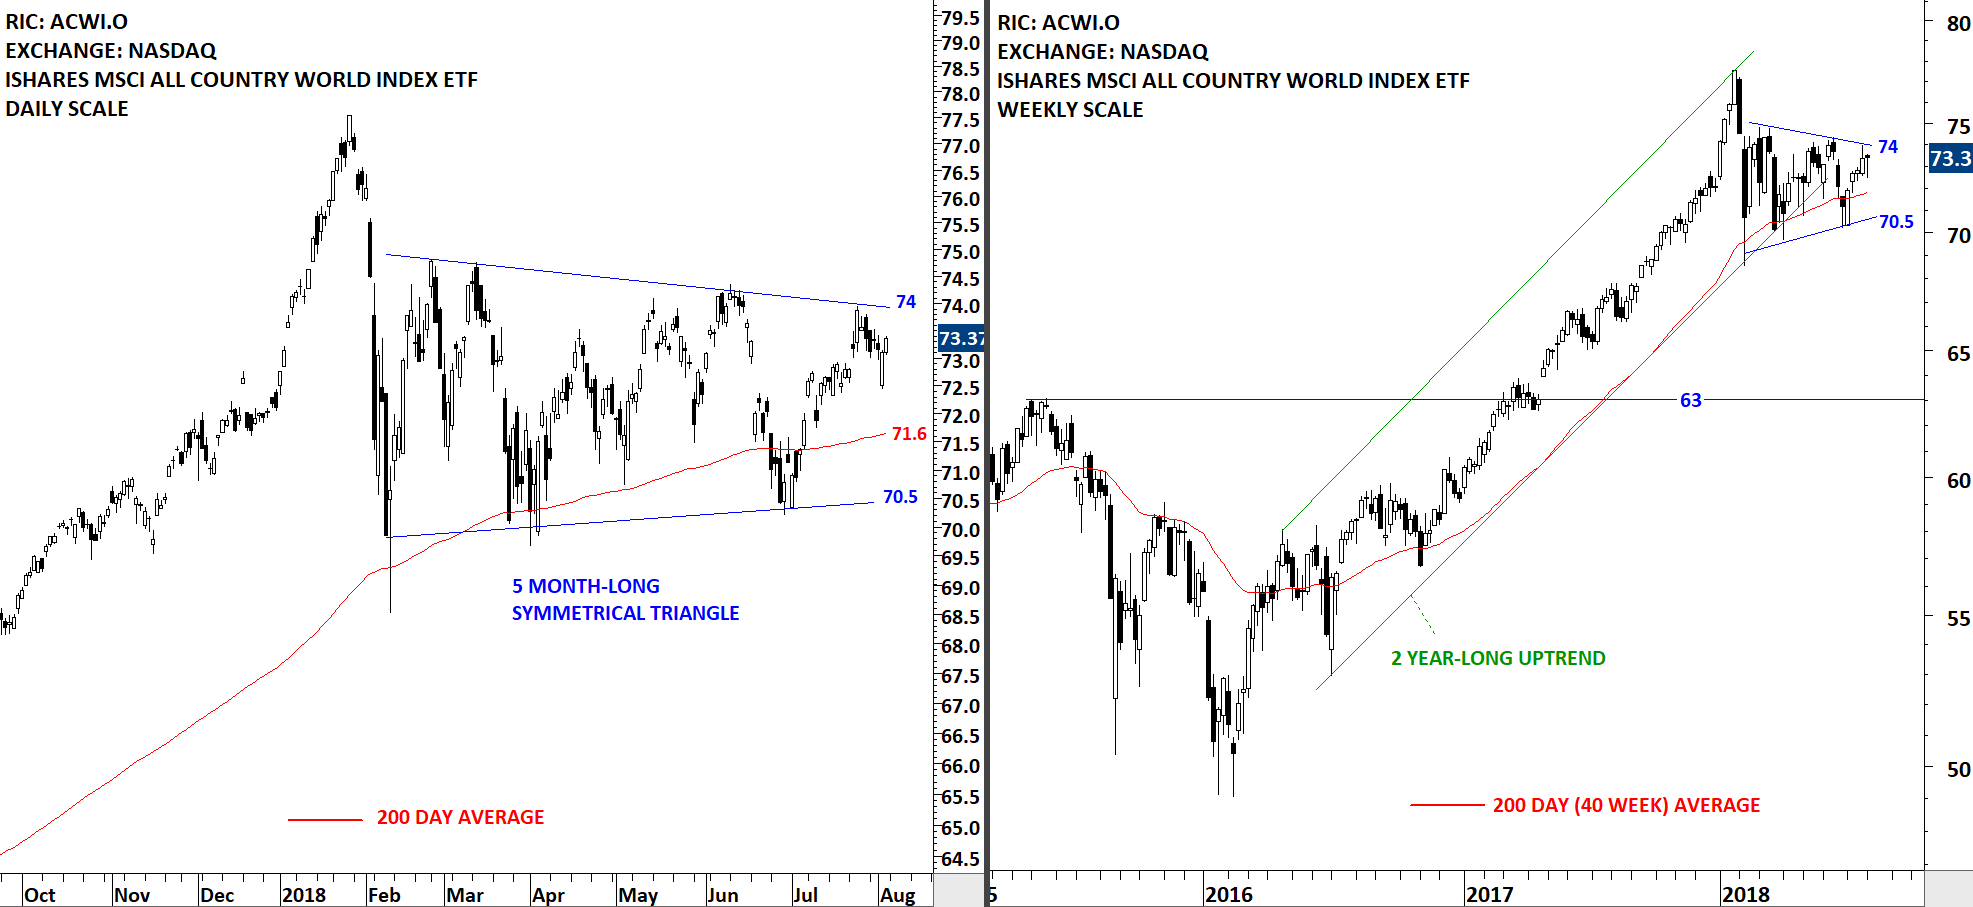
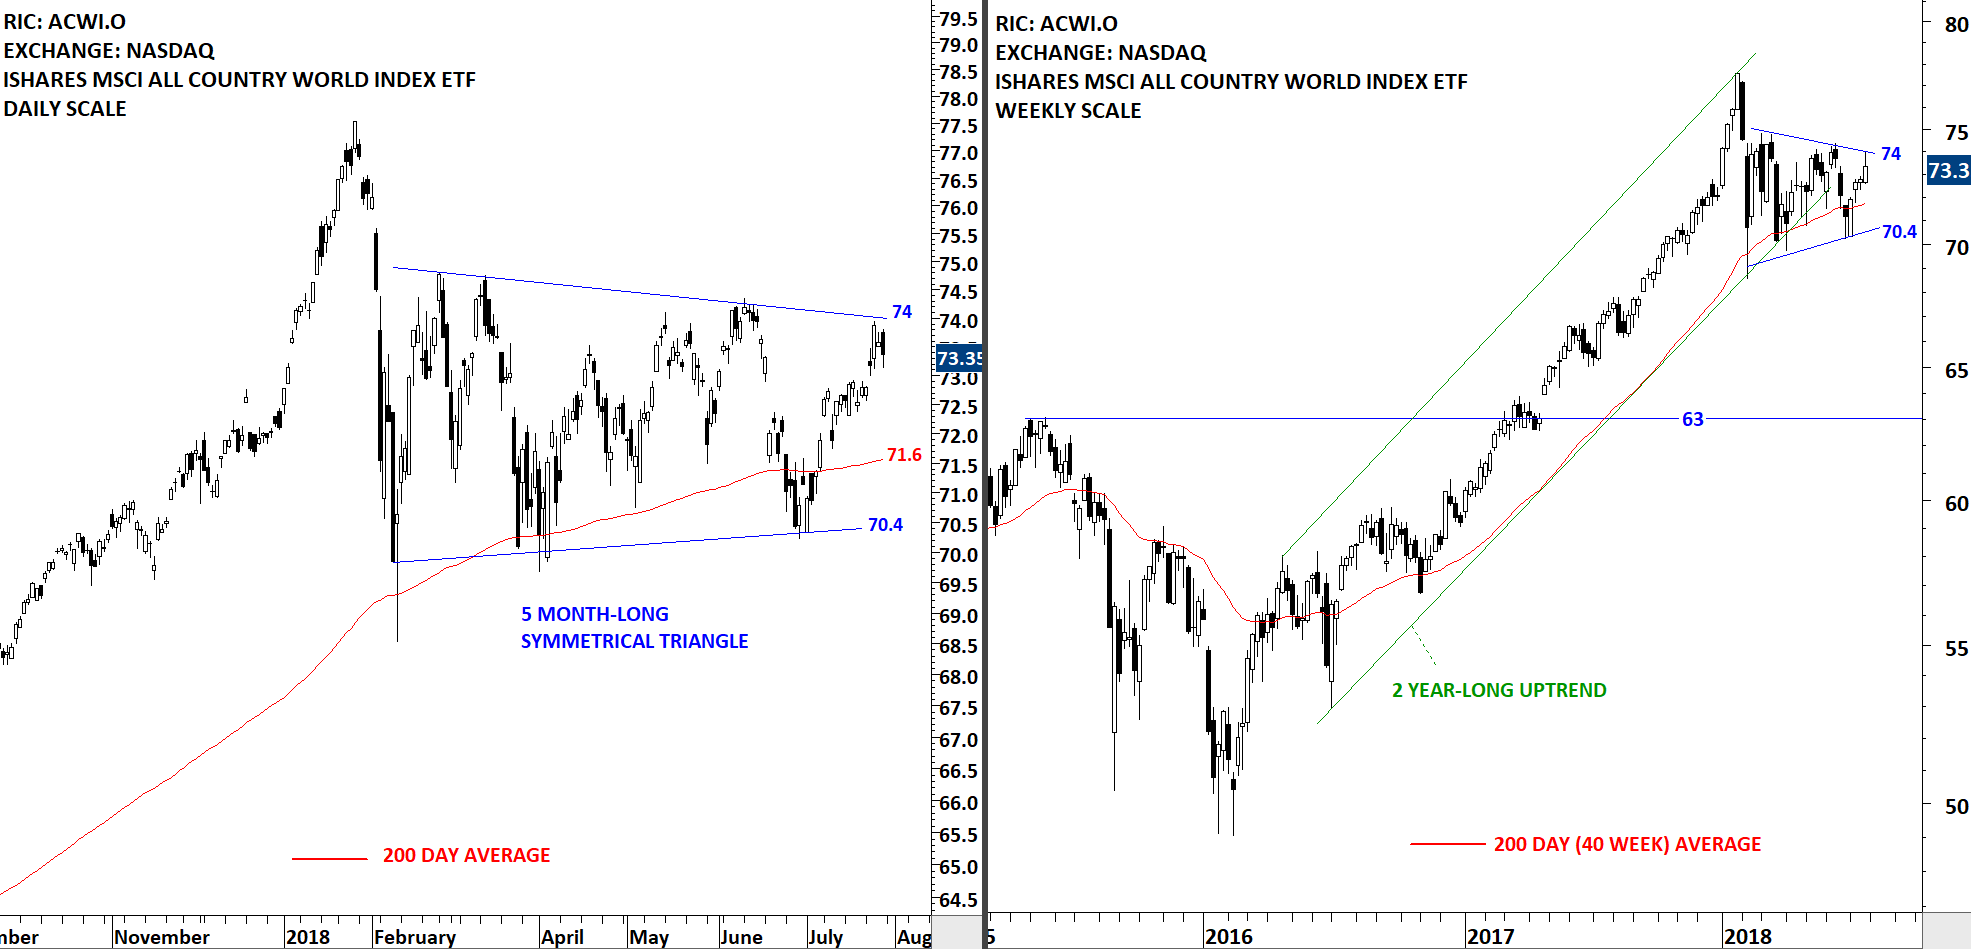
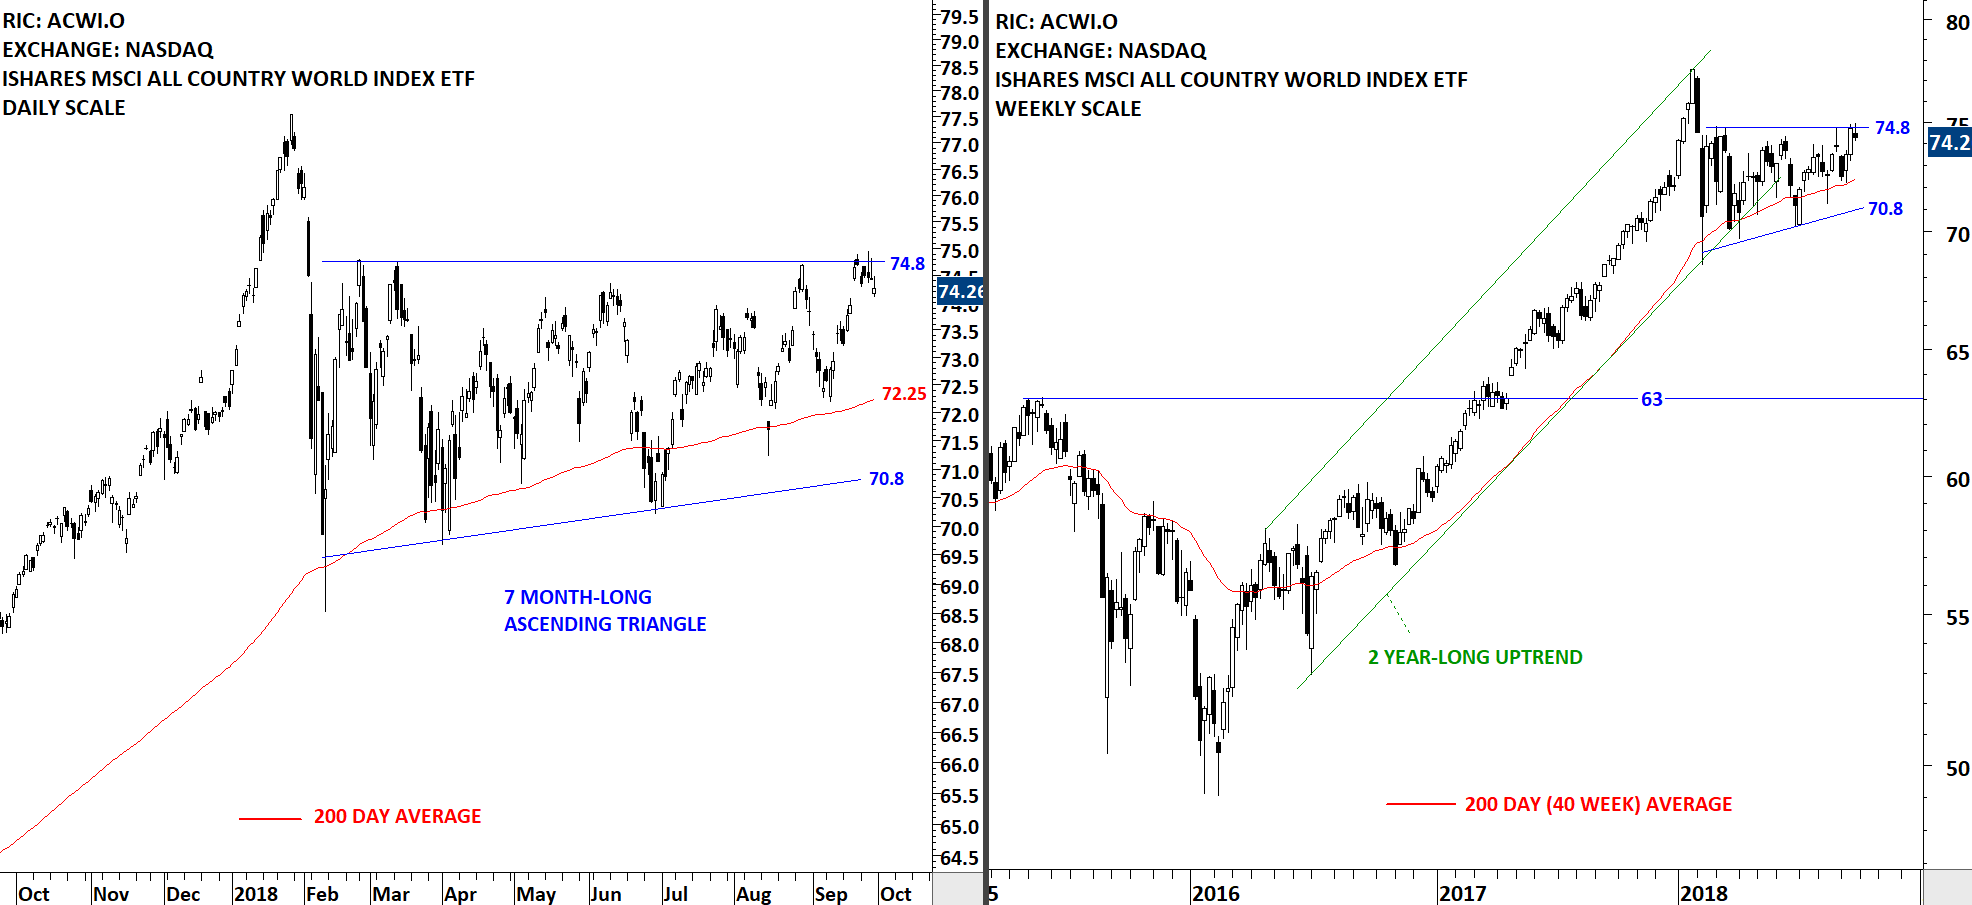
On Tuesday we had our members webinar and we discussed symmetrical triangles. We received very positive feedback from our members. A recorded version of the webinar will be uploaded on the website for our premium members. We will inform you via e-mail when it is on the Tech Charts website. During the Q&A section one of our members brought to my attention the possibility of labeling the symmetrical triangle chart pattern on the iShares MSCI All Country World Index ETF (ACWI.O) as an ascending triangle. Ascending triangle has a bullish bias when compared with a symmetrical triangle. Given that the price respected the horizontal resistance at 74.8, I labelled the chart below with the ascending triangle interpretation. It is important to note that Global equities performance as measured by the iShares MSCI All Country World Index ETF is going through an extreme low volatility period. Usually these type of low volatility periods are followed by strong directional movement. Price for the ACWI is still trading in a tight range between 70.8 and 74.8.

Read More

GLOBAL EQUITY MARKETS – September 22, 2018

Reminder on Live Webinar

We are continuing our Member webinar series with another classical chart pattern; the symmetrical triangle. Live Webinar and Q&A with Aksel - Tuesday, September 25, 11am mountain. You can register here (Register for the Live Webinar)


REVIEW


Global equity markets performance as measured by the iShares MSCI All Country World Index ETF (ACWI.O) made another attempt this week to break out of its multi-month long sideways consolidations. The weekly close was at the high of the weekly candlestick. This week's price action is possibly a "secondary completion" of the symmetrical triangle chart pattern. Follow through in the following week can resume uptrend towards 2018 high levels.

Read More

GLOBAL EQUITY MARKETS – September 15, 2018

REVIEW


The iShares MSCI All Country World Index ETF (ACWI.O) rebounded from its long-term 200-day average and made another attempt to breakout above the upper boundary of its 6 month-long symmetrical triangle. Friday's close was around the upper boundary of the multi-month long sideways consolidation. In the last week of August the ACWI ETF breached the upper boundary but failed to trend higher. Renewed strength can help the iShares MSCI All Country World Index ETF breakout from the 6 month-long symmetrical triangle.

Read More

GLOBAL EQUITY MARKETS – September 8, 2018

REVIEW


Strength in U.S. equities alone was not enough to push the iShares MSCI All Country World Index ETF (ACWI.O) out of its 6 month-long consolidation range. Few days of price action above the chart pattern boundary at 73.9 levels failed to materialize into a strong directional movement. The ETF continues to remain in a range between 70.6 and 73.9 levels. Strong support stands at 70.6 levels.

Read More

GLOBAL EQUITY MARKETS – September 1, 2018

REVIEW


The iShares MSCI All Country World Index ETF (ACWI.O) breached the upper boundary of its 6 month-long symmetrical triangle. The upper boundary is acting as resistance at 73.9 levels. The jury is still out. We need to see a follow through in the following week to call for a breakout from the lengthy sideways consolidation. This week's price action can be a premature breakout that can be followed by a secondary completion. More on: Premature & False breakouts

Read More

GLOBAL EQUITY MARKETS – August 25, 2018

REVIEW


Once again the benchmark for Global Equity Markets performance, the iShares MSCI All Country World Index ETF (ACWI.O) is challenging the upper boundary of its 6 month-long sideways consolidation. The upper boundary was tested several times over the past few months. Resistance stands at 73.9. The lower boundary of the possible symmetrical triangle is acting as support at 70.5 levels. The ACWI ETF is trading above its long-term (200-day) average. Breakout above the upper boundary can complete the multi-month sideways consolidation and result in a directional move. The ACWI ETF still remains in a trading range.

Read More

GLOBAL EQUITY MARKETS – August 18, 2018

REVIEW


Global Equity Markets continue to remain in a range. The iShares MSCI All Country World Index ETF (ACWI.O) is possibly forming a 6 month-long symmetrical triangle with the upper boundary acting as resistance at 74 and the lower boundary as support at 70.5 levels. Breakout from this lengthy consolidation range will result in a directional move.

Read More

GLOBAL EQUITY MARKETS – August 11, 2018

REVIEW


A well-defined consolidation range can offer trading opportunity between the boundaries. Since the beginning of the year Global Equity Markets performance has been muted. The iShares MSCI All Country World Index ETF (ACWI.O) formed a possible symmetrical triangle with the upper boundary acting as resistance at 74 levels and the lower boundary as support at 70.5 levels. This week the ACWI ETF reversed from the strong resistance at 74 levels. Price chart suggests further consolidation in a range. A decisive breakout above 74 or below 70.5 levels will possibly complete the multi-month long consolidation and result in a directional move.

Read More

GLOBAL EQUITY MARKETS – August 4, 2018

REVIEW


Global equity markets performance as measured by the iShares MSCI All Country World Index, remains muted in a range. Choppy sideways consolidation has been intact for the past 5 months. The upper boundary of the consolidation is acting as resistance at 74 levels and the lower boundary as support at 70.5. The 5 month-long consolidation is possibly forming a symmetrical triangle. Long-term uptrend is still intact with the ACWI ETF trading above its 200 day (40-week) average.

Read More

GLOBAL EQUITY MARKETS – July 28, 2018

REVIEW


The iShares MSCI All Country World Index ETF (ACWI.O) found resistance at the upper boundary of its 5 month-long consolidation. Last 5 month's price action can be identified as a possible symmetrical triangle with the upper boundary acting as resistance at 74 levels and the lower boundary as support at 70.4 levels. I track ACWI ETF to measure Global equity markets performance. Price continues to remain range-bound.

Read More