GLOBAL EQUITY MARKETS – December 29, 2018
Dear Tech Charts members,
One more year is behind us. In the beginning of every year I wish health for family members, friends and their loved ones. Tech Charts community has become a family. I wish all of you a healthy New Year. I hope the new year brings new hopes and aspirations along with the zeal and courage to keep up with those commitments. Wish you all the best.
Kind regards,
![]()
REVIEW
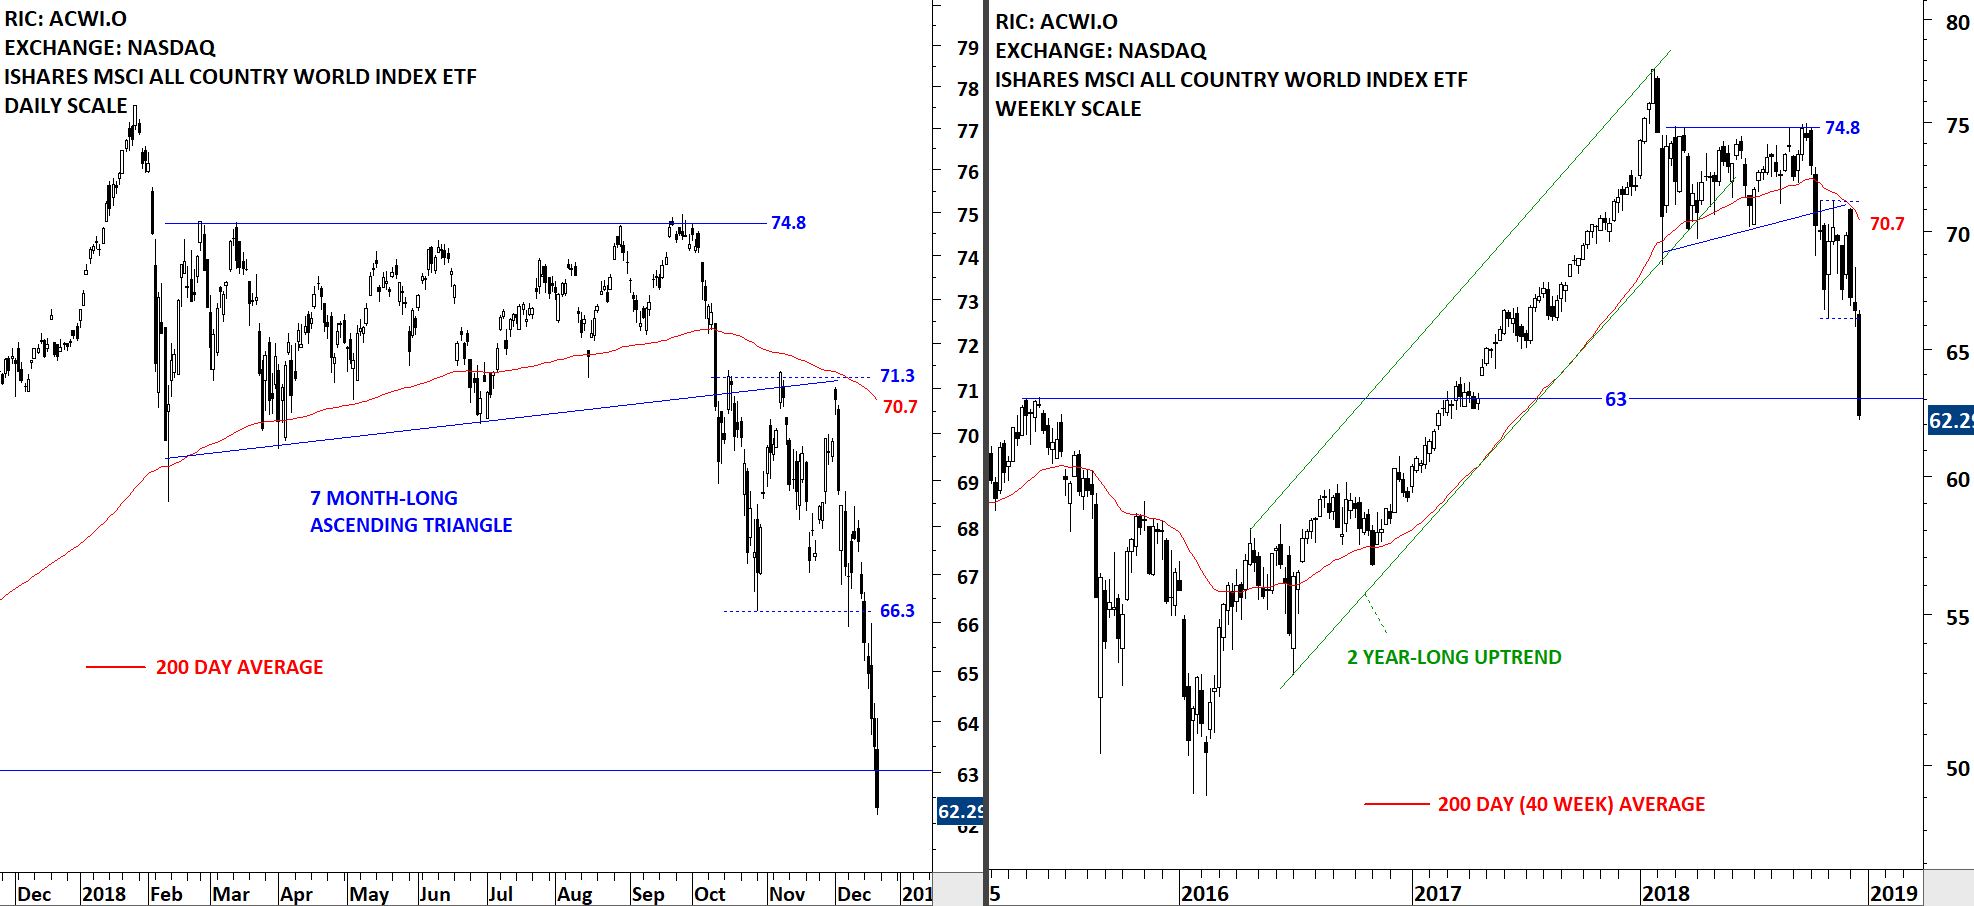
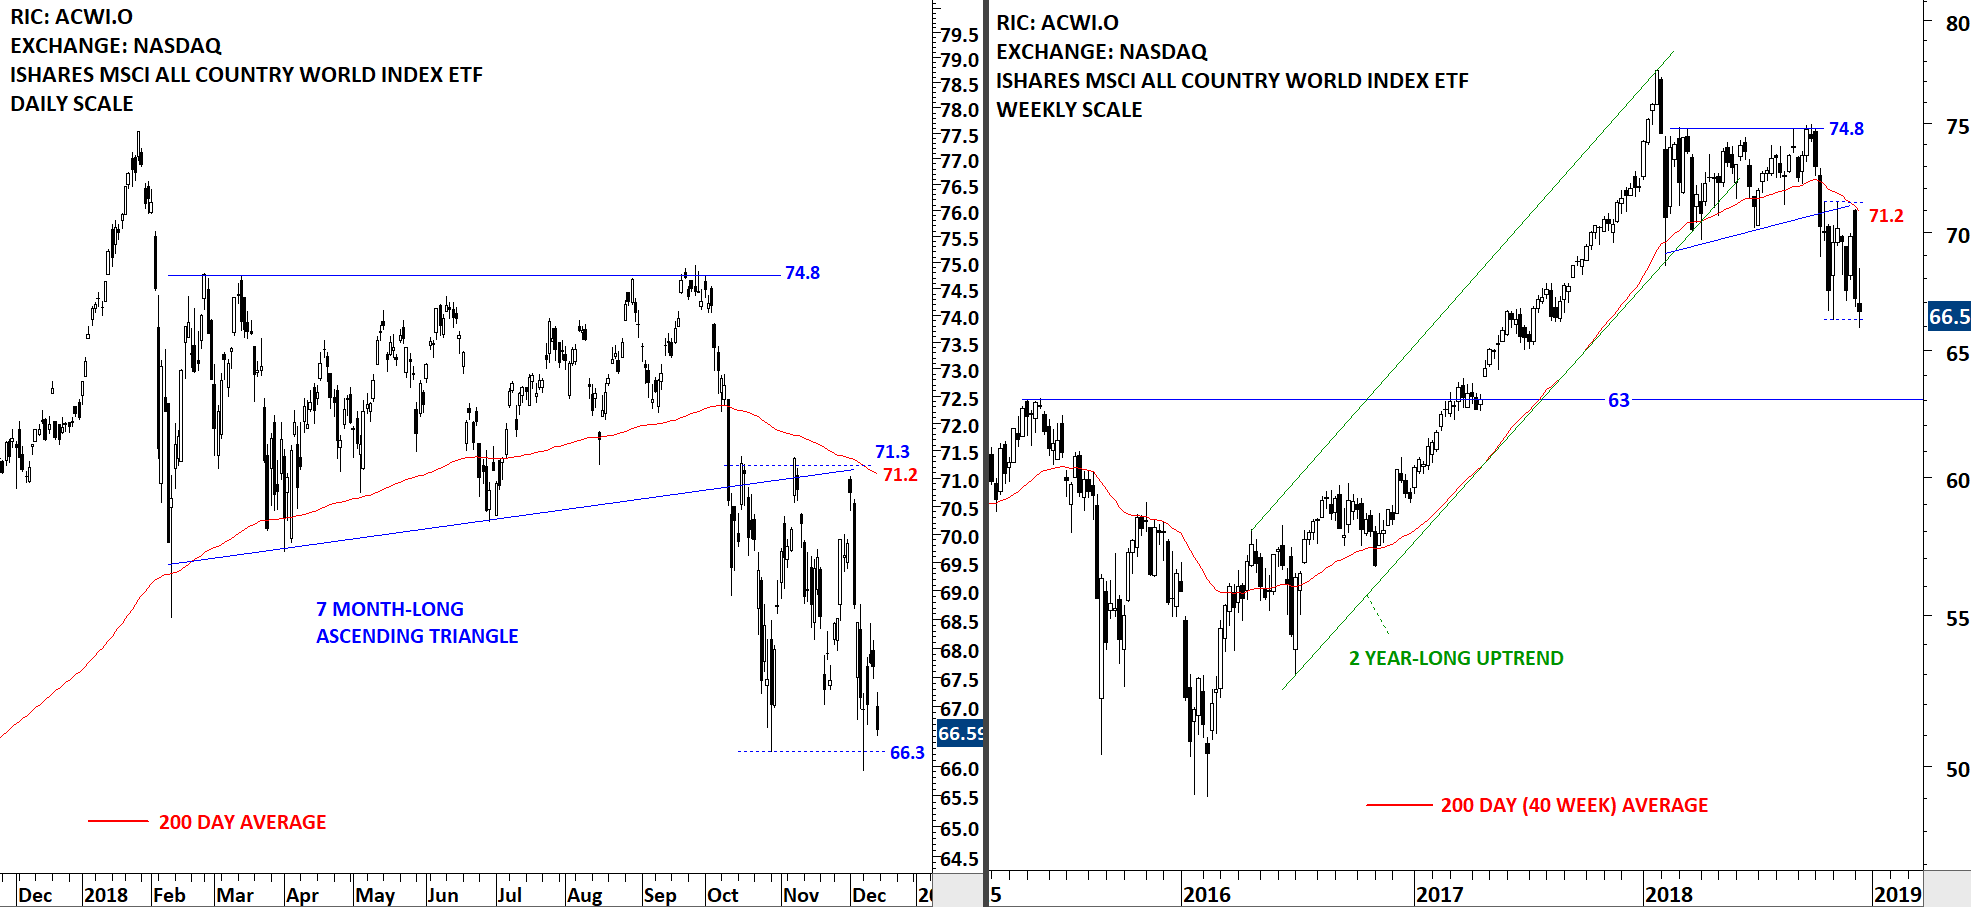
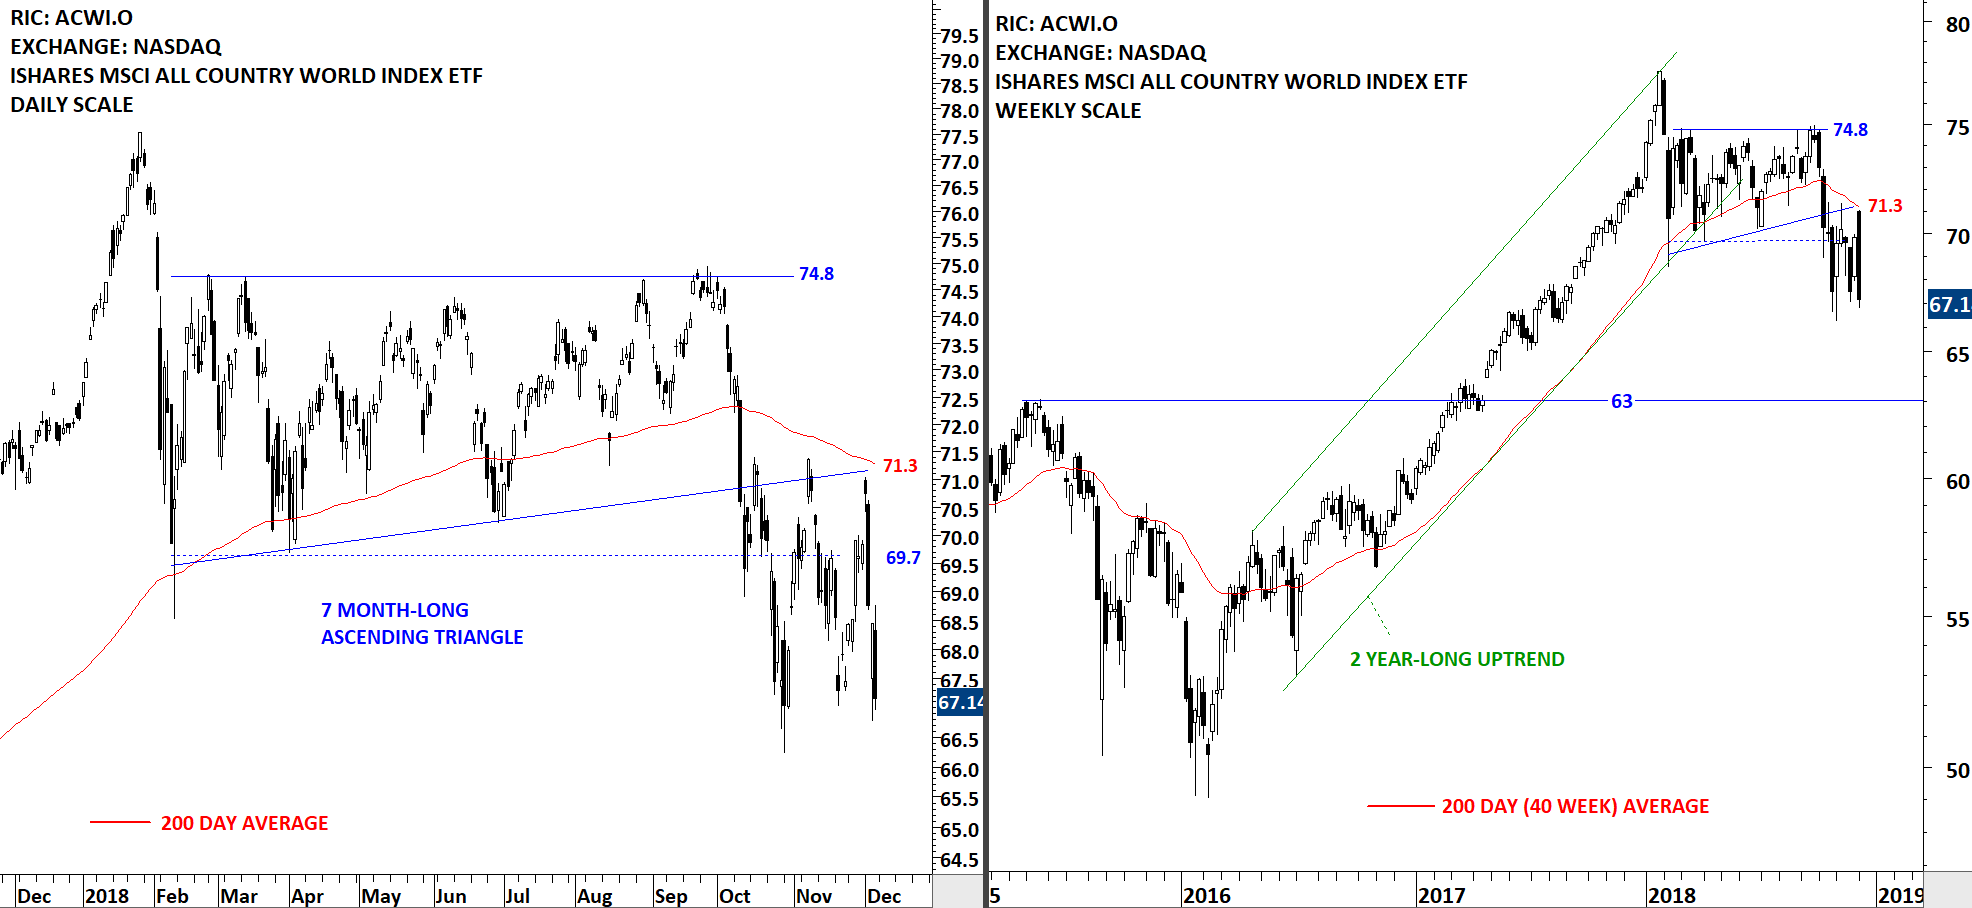
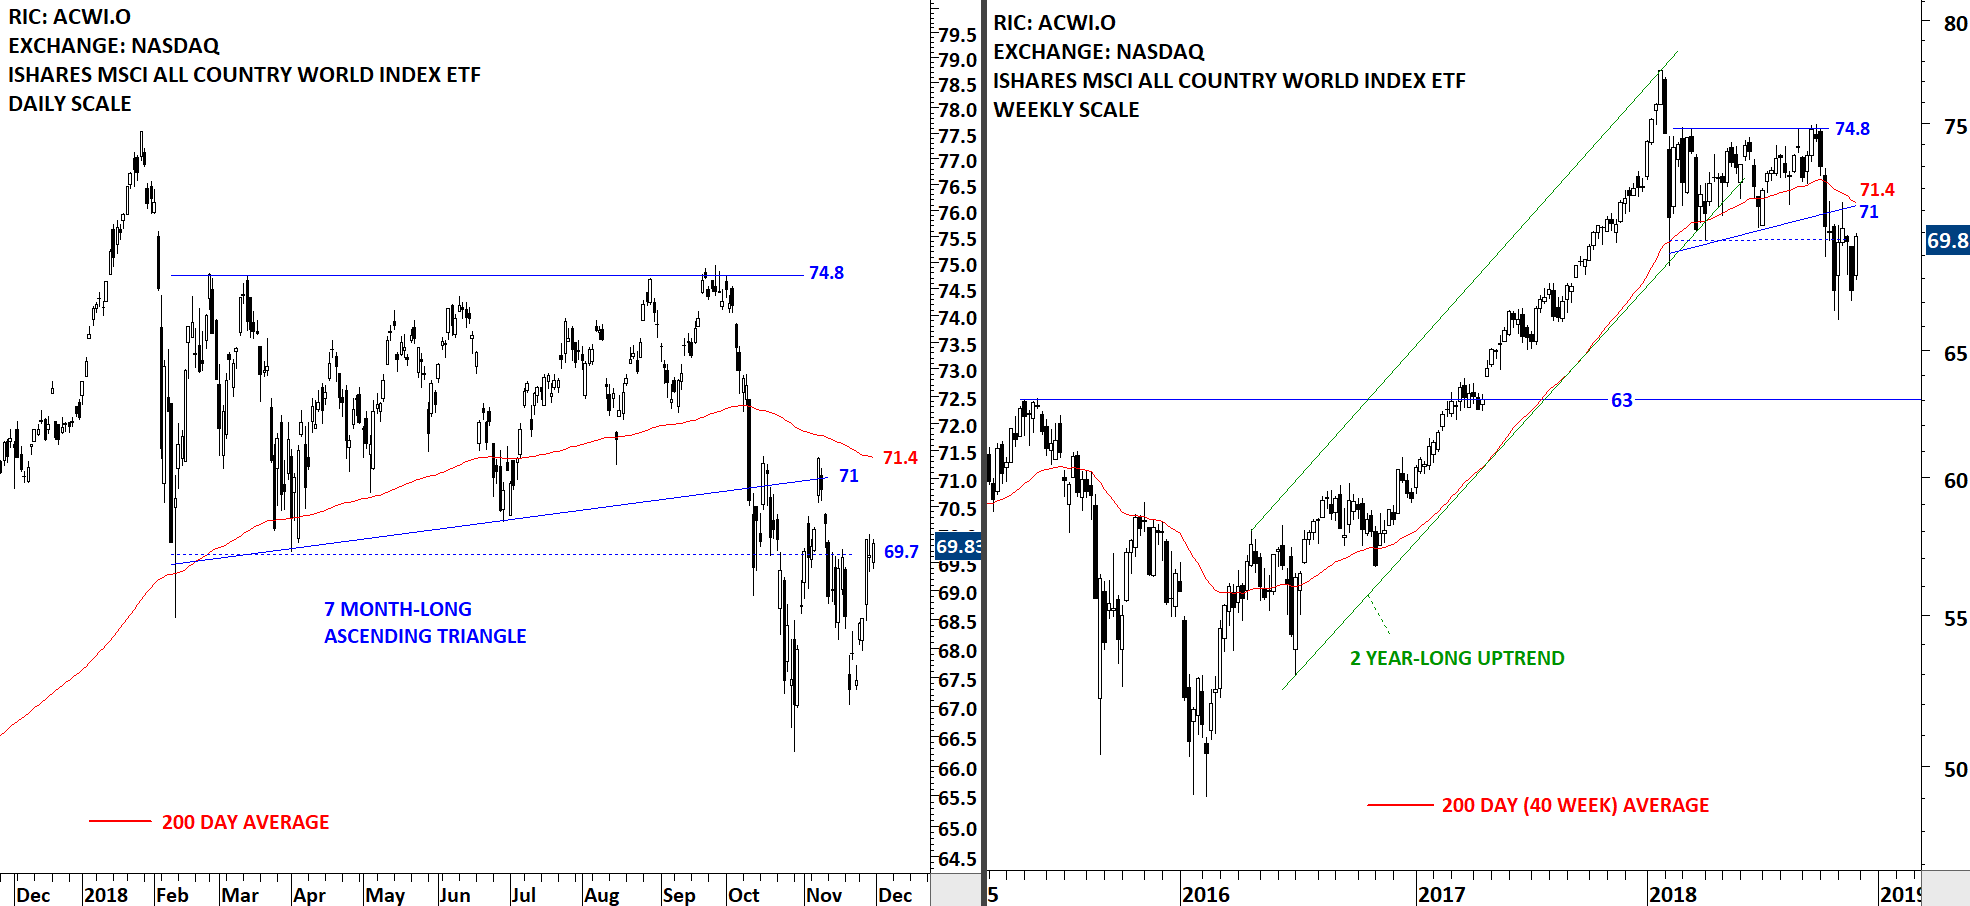
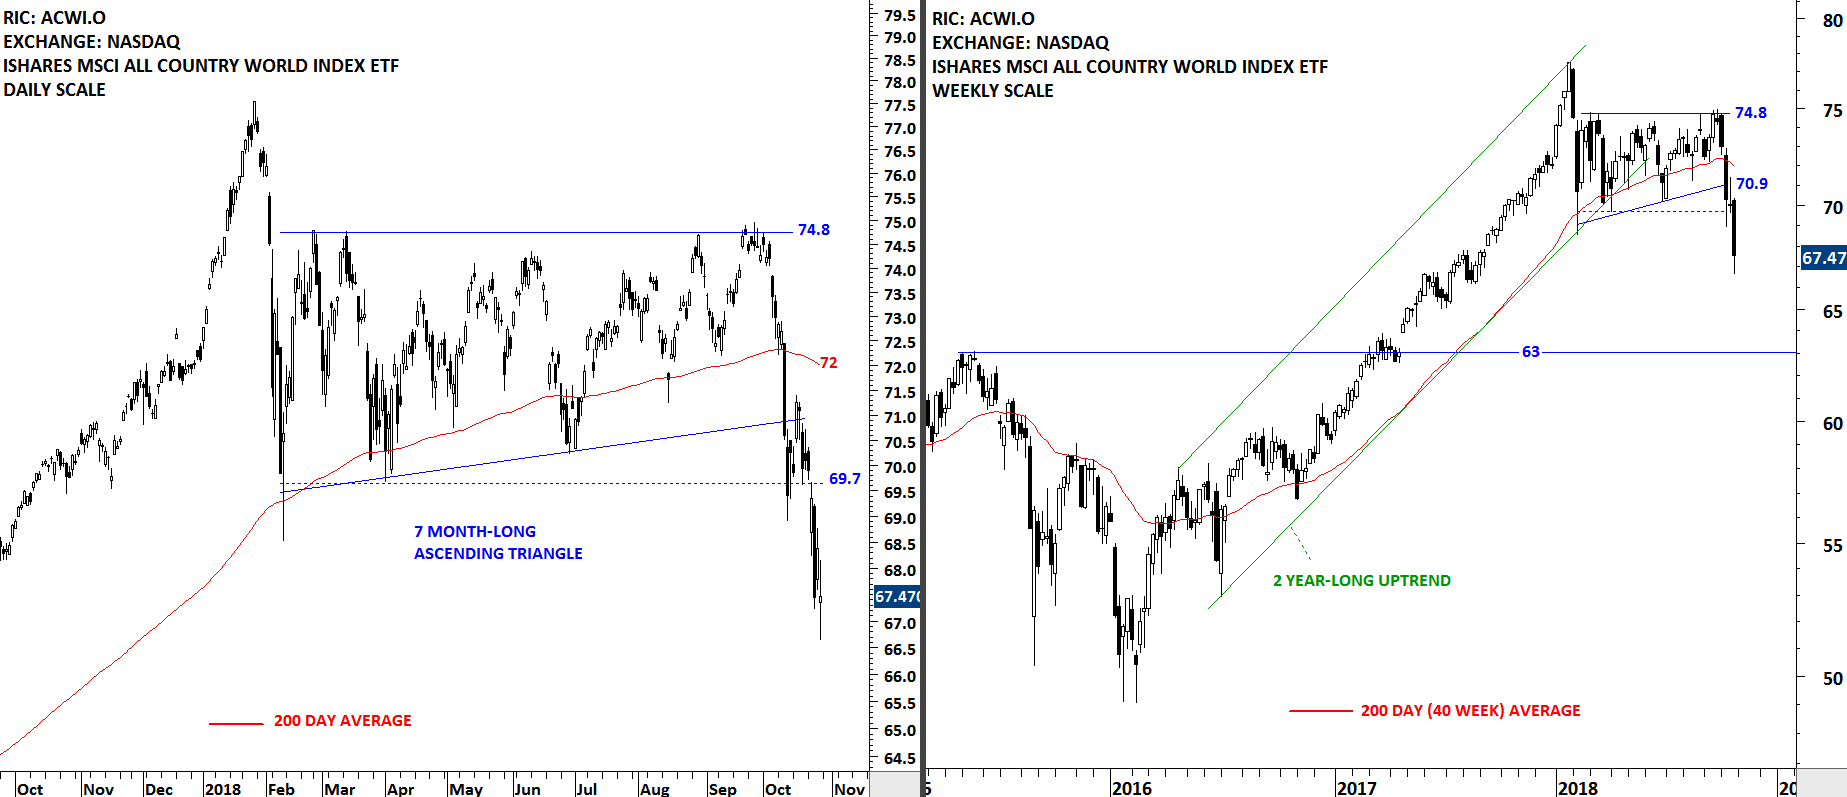
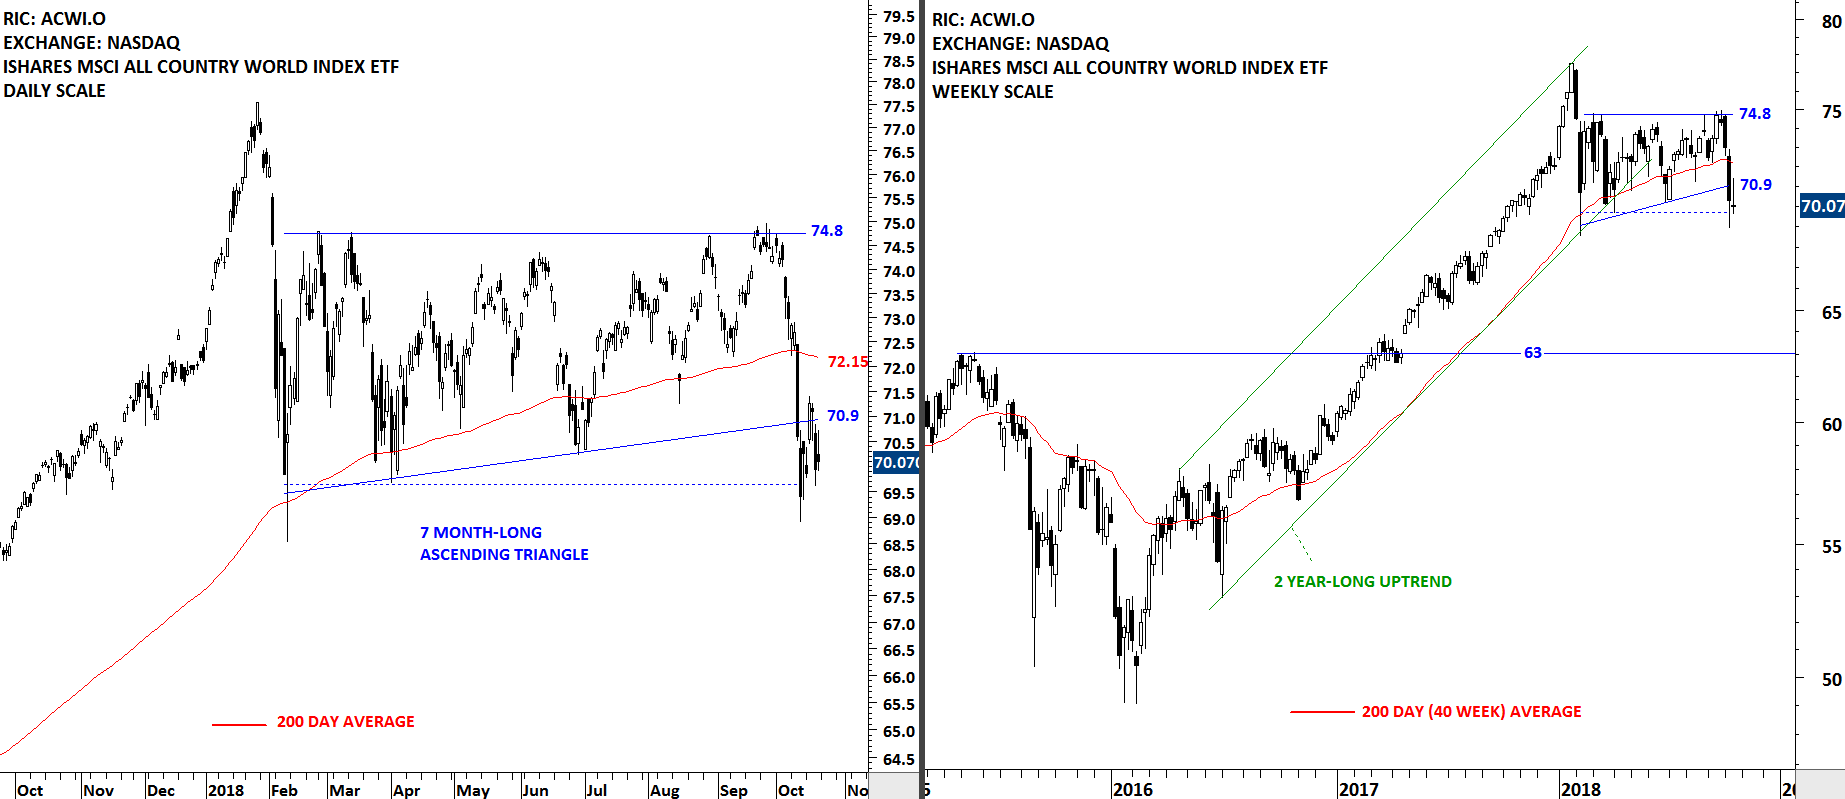
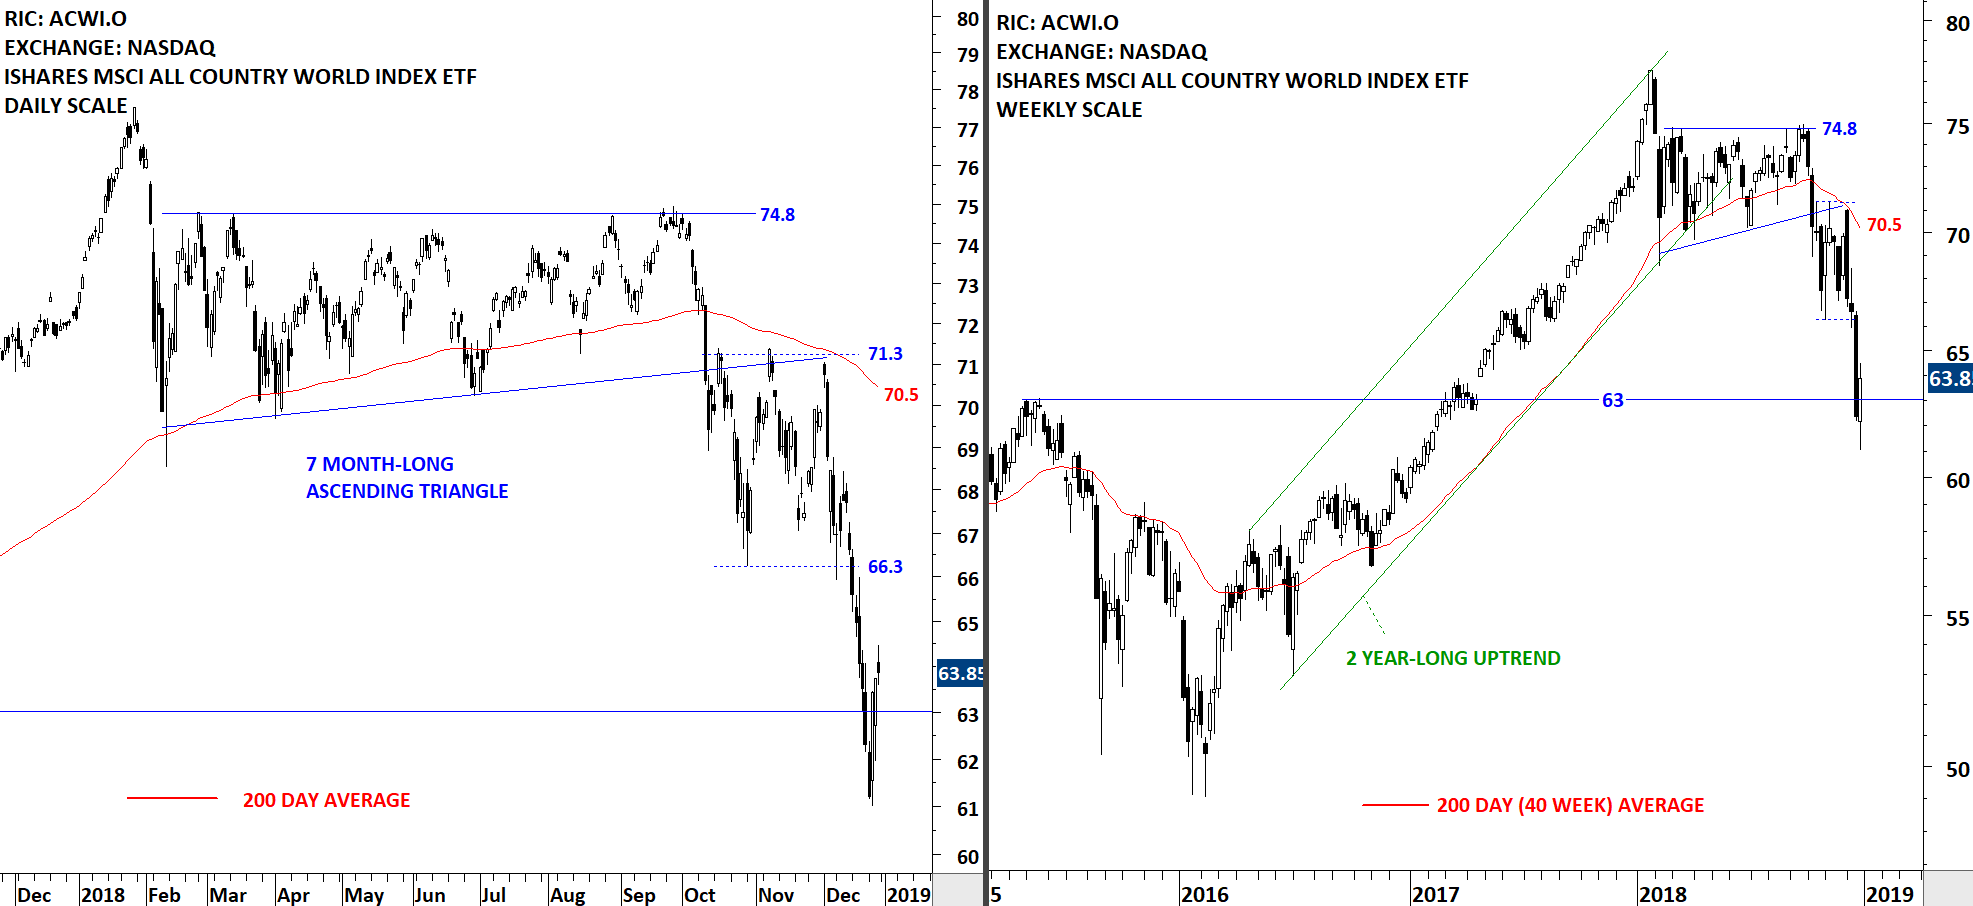
Global equity markets performance as measured by the iShares MSCI All Country World Index ETF (ACWI.O) rebounded from oversold levels. In the time frame I analyze price charts (daily, weekly and monthly) from a classical charting perspective there is no clear sign of reversal. V bottoms can take place and they are usually difficult to anticipate and analyze. My best guess is that we see some sort of consolidation after December's sharp sell-off. The consolidation can result in a re-test of previous lows. We will be able to tell as we get new evidence (data points) from the markets. For now I can say that the ACWI ETF (ACWI.O) stabilized around the support at 63 levels. Strong resistance stands at 66.3 levels. The ETF is trading below its long-term average and is in a steady downtrend.
 Read More