Posts

GLOBAL EQUITY MARKETS – June 1, 2019

REVIEW


The benchmark for the Global equity markets performance, the iShares MSCI All Country World Index ETF (ACWI.O) finsihed the week below the important support level at 71 levels. The head and shoulder chart pattern price target stands at 67.75 levels. Both the neckline and the 200-day moving average stands at 71 levels and will act as resistance. Read More

GLOBAL EQUITY MARKETS – May 18, 2019

REVIEW


The benchmark for the Global equity markets performance, the iShares MSCI All Country World Index ETF (ACWI.O), pulled back from the strong resistance at 74.8 levels. During the week price tested the long-term 200-day average at 71 levels and rebounded. For now we can conclude that the 200-day average acted as support. In the following weeks I will monitor the price action around the average. Failure to hold above 71 levels can result in a larger scale correction. The daily scale price chart can form a short-term H&S top. Both the neckline of the possible H&S top and the 200-day moving average are overlapping at the same level (71). In the short-term, as long as the price remains above 71 support, ACWI ETF is expected to trade between 71 and 74.8 levels.

Read More

GLOBAL EQUITY MARKETS – May 11, 2019

REVIEW


The benchmark for Global equity markets performance, the iShares MSCI All Country World Index ETF (ACWI.O) experienced a sharp pullback from the strong resistance at 74.8 levels. Pullback found support around the 200-day moving average at 71 levels. What could be next for the Global equity benchmark? One option is a new trading range between 71 and 74.8, similar to what the benchmark experienced in the first half of 2018. A consolidation between the long-term average and the horizontal resistance at 74.8. The other option is the continuation of the correction with a breach below the long-term average. As long as the index manages to hold above the long-term average, I will continue to view the price action as positive. Short-term support is at 71 and the resistance is at 74.8 levels.

Read More

GLOBAL EQUITY MARKETS – May 4, 2019

REVIEW


The benchmark for the Global equity markets, the iShares MSCI All Country World Index ETF (ACWI.O), continues to remain around the strong resistance at 74.8 levels. The long-term 200-day moving average stands at 71 levels. There is no clear short-term chart pattern that would indicate a continuation of the existing uptrend. Price remains above the long-term average and such technical condition suggests the ETF is in an uptrend. If there is a pullback from the short-term resistance at 74.8 levels, the 200-day moving average is likely to act as support.

Read More

GLOBAL EQUITY MARKETS – April 27, 2019

REVIEW


The benchmark for the Global equity markets performance, the iShares MSCI All Country World Index ETF (ACWI.O), found resistance at the important horizontal resistance at 74.8 levels. Given the magnitude of the strong rebound and the steady rise without any pullback, one can't rule out the possibility of a breather/pause around the resistance at 74.8 levels. If we see a pullback, the 200-day moving average which is currently at 70.8 levels can act as support.

Read More

GLOBAL EQUITY MARKETS – April 20, 2019

REVIEW


The benchmark for the Global equity markets performance, the iShares MSCI All Country World Index ETF (ACWI.O), is now very close to a horizontal resistance at 74.8 levels. Given the magnitude of the strong rebound and the steady rise without any pullback, one can't rule out the possibility of a breather/pause around the resistance at 74.8 levels. If we see a pullback, the 200-day moving average which is currently at 70.6 levels can act as support.

Read More

ISHARES MSCI FRONTIER 100 INDEX ETF (FM)

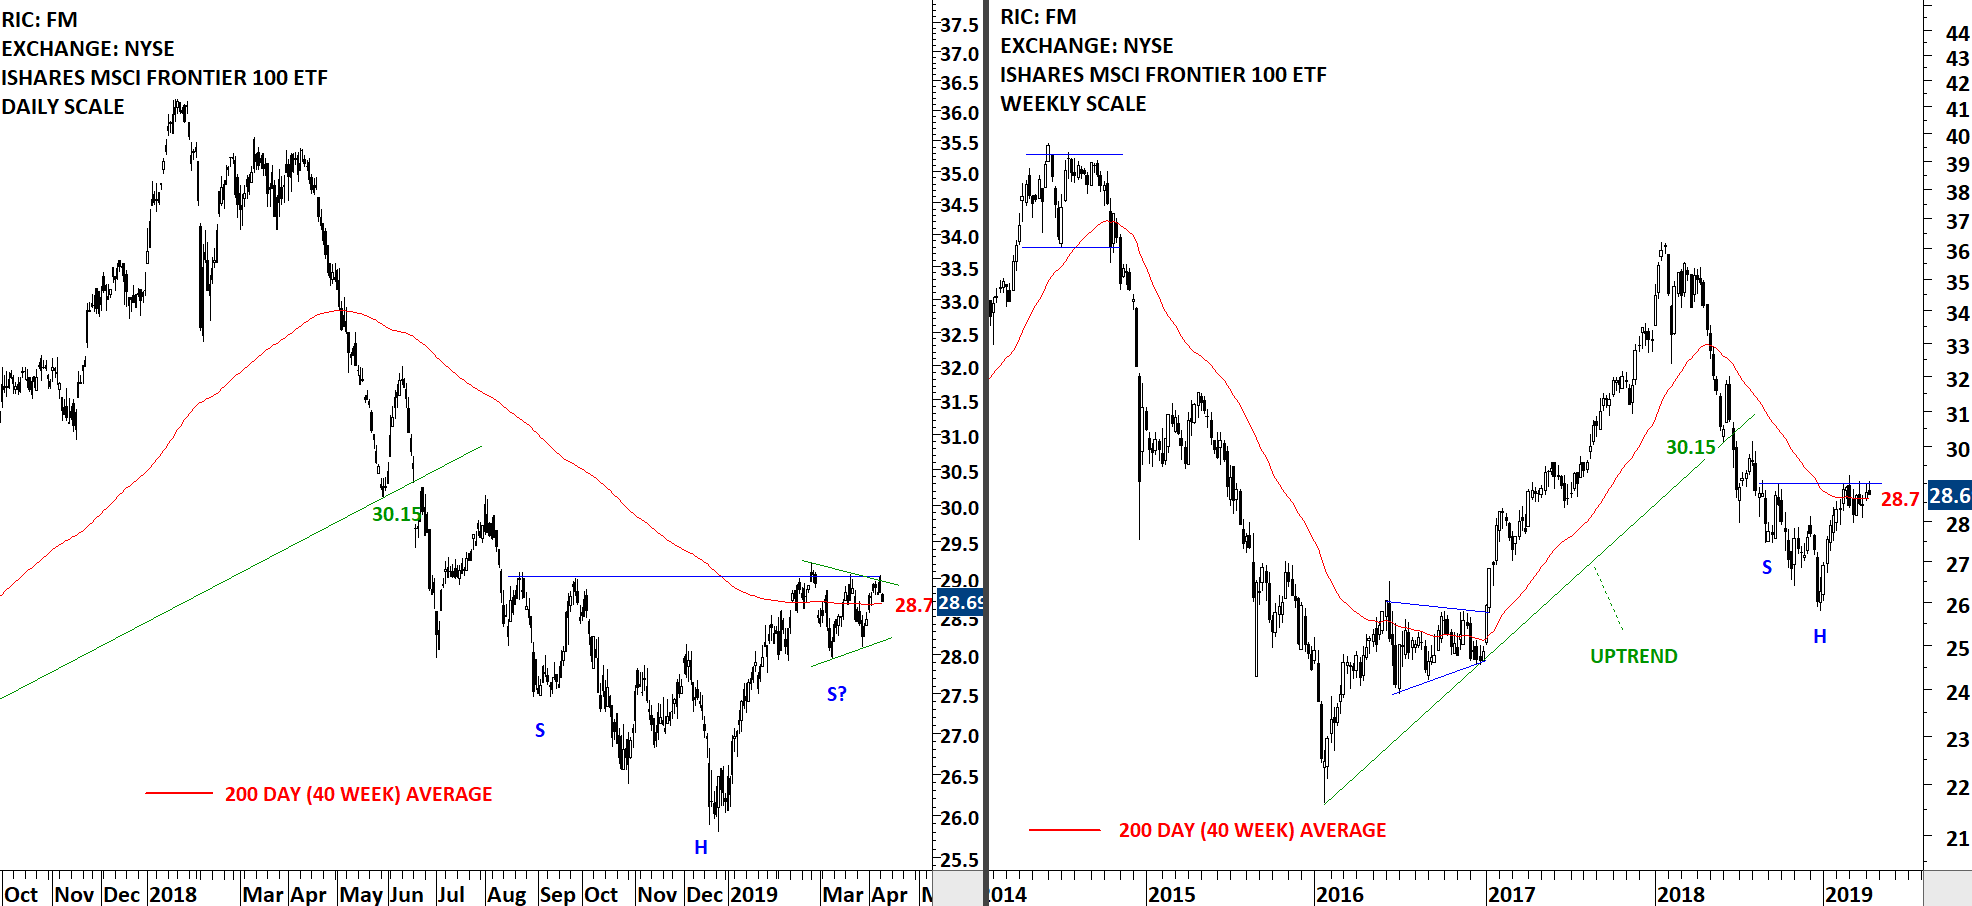
Every week Tech Charts Global Equity Markets report features some of the well-defined, mature classical chart patterns under a lengthy watchlist and the chart pattern breakout signals that took place during that week. Global Equity Markets report covers single stocks from developed, emerging and frontier markets, ETF’s and global equity indices. The report starts with a review section that highlights the important chart developments on global equity benchmarks. This blog post features from the review section iShares MSCI Frontier 100 Index ETF (FM).

The benchmark for the Frontier markets, the iShares MSCI Frontier 100 ETF (FM) is possibly forming a symmetrical triangle that will act as a launching pattern for the H&S bottom reversal. The symmetrical triangle is forming around the 200-day moving average, a setup that I usually look for. Completion of the month-long symmetrical triangle will push the price above the long-term average and also clear the horizontal resistance (neckline for H&S bottom) at 29 levels. (Data as of 6:00 pm CET /April 9, 2019)


Tech Charts Membership

By becoming a Premium Member, you’ll be able to improve your knowledge of the principles of classical charting.

With this knowledge, you can merge them with your investing system. In fact, some investors use my analyses to modify their existing style to invest more efficiently and successfully.

Get Access Now

As a Premium Member of Aksel Kibar’s Tech Charts,

You will receive:

  • Global Equities Report. Delivered weekly.
  • Classical charting principles. Learn patterns and setups.
  • Actionable information. Worldwide indices and stocks of interest.
  • Risk management advice. The important trading points of each chart.
  • Information on breakout opportunities. Identify the ones you want to take action on.
  • Video tutorials. How patterns form and why they succeed or fail.
  • Watch list alerts. As they become available so you can act quickly.
  • Breakout alerts. Usually once a week.
  • Access to everything (now and as it becomes available)
    o Reports
    o Videos and video series
  • Multi-part webinar course. You learn the 8 most common charting principles.
  • Webinars. Actionable and timely advice on breaking out chart patterns.

For your convenience your membership auto renews each year.

Get Access Now

GLOBAL EQUITY MARKETS – April 6, 2019

REVIEW


The benchmark for Global equity markets performance, the iShares MSCI All Country World Index ETF (ACWI.O) continues to remain strong. The ETF had a strong rebound from support at 63 levels and since then the uptrend resumed without any significant setback. In February the ETF cleared its 200-day moving average and continues to trend above its long-term average. In the short-term horizontal resistance at 74.8 levels can act as an overhead supply. Strong support is the 200-day average at 70.3 levels.

Read More

GLOBAL EQUITY MARKETS – March 30, 2019

REVIEW


The benchmark for the Global equity markets performance, the iShares MSCI All Country World Index ETF (ACWI.O) is trying to find direction above its long-term average. We can see choppy price action around the 200-day average. More important is how the index will consolidate around the average. If it forms an orderly, recognizable short-term consolidation (in the form of a flag, pennant, rectangle, symmetrical triangle) I will conclude that the index is preparing for a new leg up. 200-day moving average is forming support at 70.15 levels.

Read More

GLOBAL EQUITY MARKETS – March 16, 2019

REVIEW


The benchmark for the Global equity markets performance, the iShares MSCI All Country World Index ETF (ACWI.O) found support above its 200-day (40 week) average. Sharp V-reversal from the low of January 2019 didn't encounter a pullback/correction. I analyze the price action that manages to consolidate and find support above its long-term average as positive and review the ACWI ETF with a bullish bias. During any pullback or further sideways consolidation, the 200-day moving average at 69.9 levels will act as support.

Read More