Posts

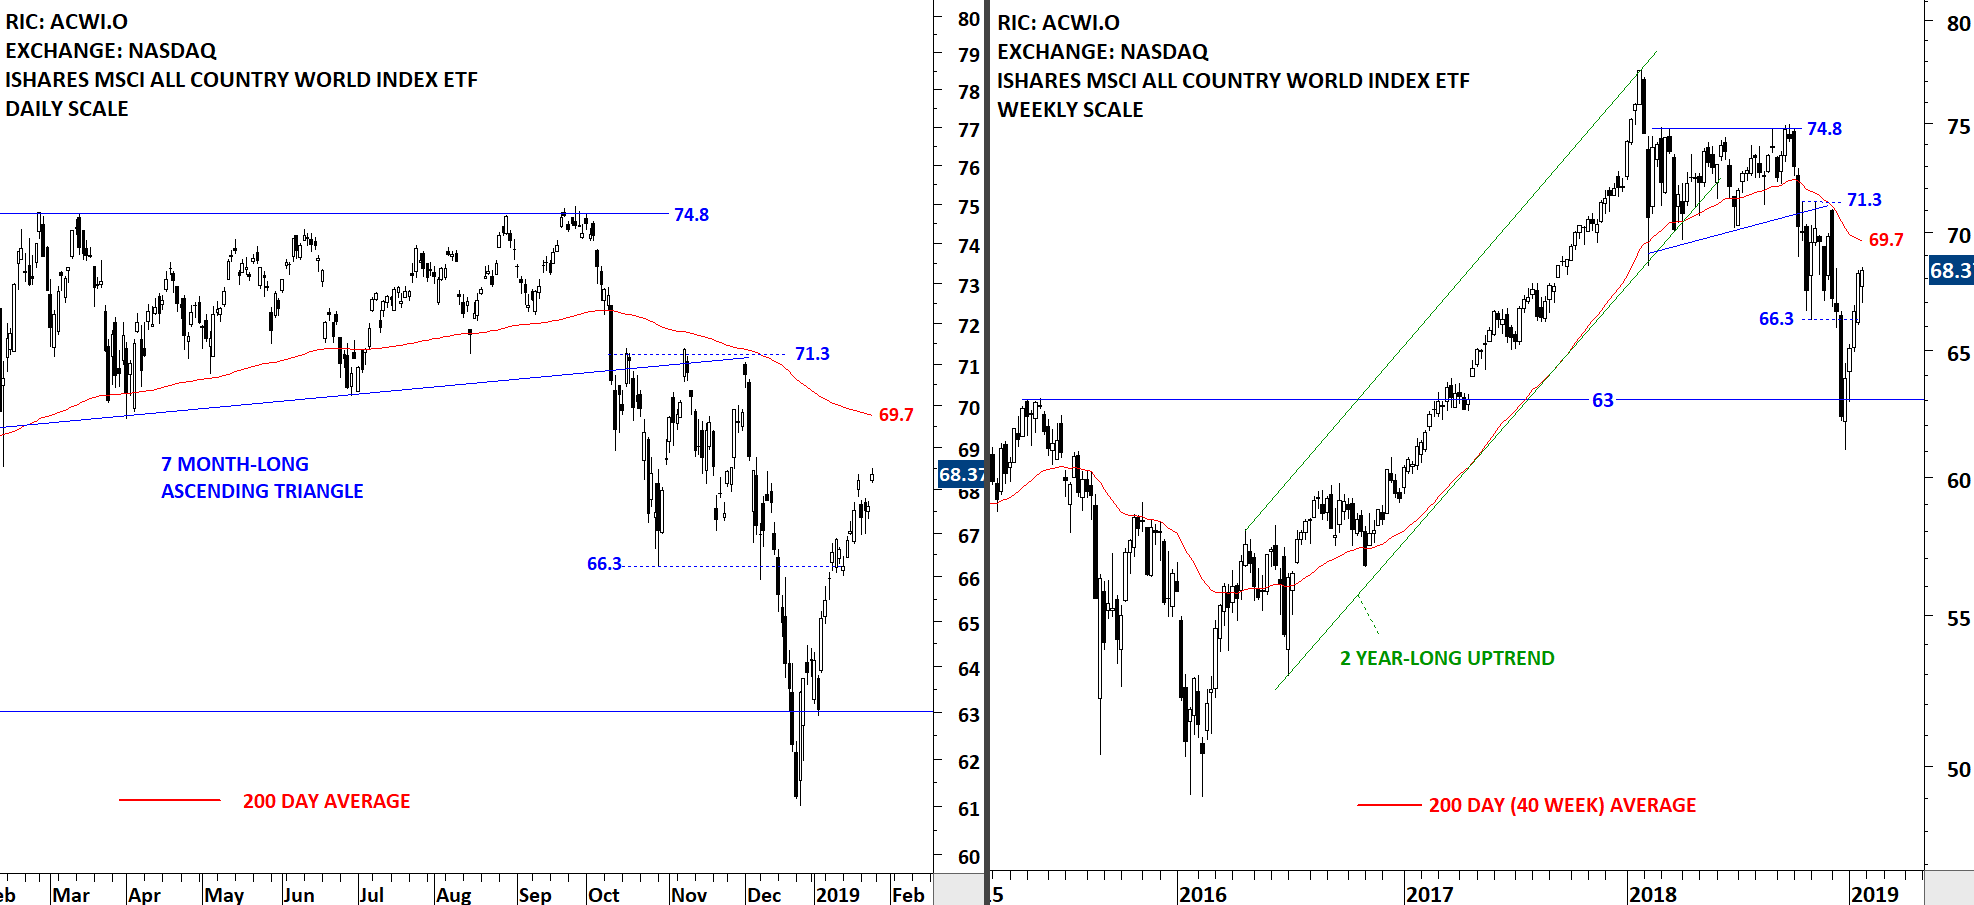
EMERGING & FRONTIER MARKET ETFs (EEM & FM)

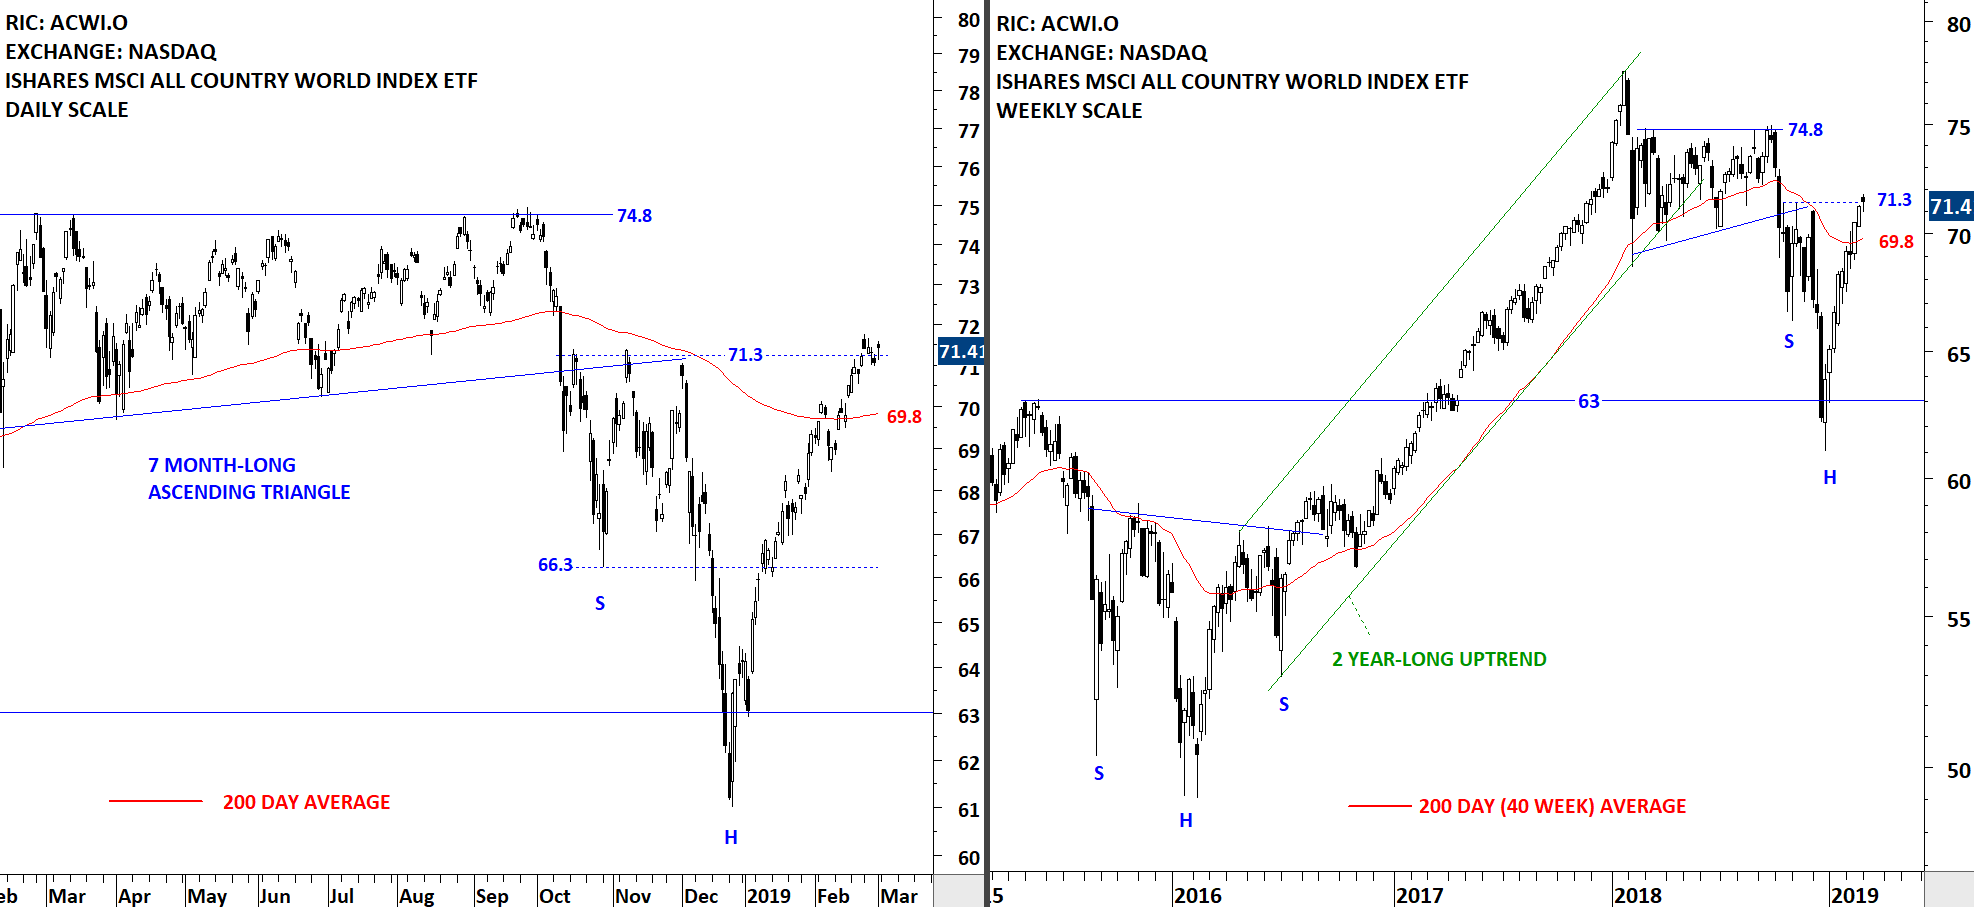
Every week Tech Charts Global Equity Markets report features some of the well-defined, mature classical chart patterns under a lengthy watchlist and the chart pattern breakout signals that took place during that week. Global Equity Markets report covers single stocks from developed, emerging and frontier markets, ETF’s and global equity indices. The report starts with a review section that highlights the important chart developments on global equity benchmarks. This blog post features from the review section iShares MSCI Emerging Markets Index ETF (EEM) and iShares Frontier 100 Index ETF (FM), listed on the New York Stock Exchange.

Read More

GLOBAL EQUITY MARKETS – March 9, 2019

REVIEW


The benchmark for the Global equity markets performance, the iShares MSCI All Country World Index ETF (ACWI.O) found resistance at 71.3 levels. Strong rebound that started in the beginning of January is now being interrupted with a correction. This week's price action tested the 200-day moving average.  We are likely to see more choppy price action around the 200-day average, possibly in an attempt to form a reversal chart pattern. It is still early to call for the developing chart pattern a head and shoulders reversal. ACWI ETF is now in a trading range between 66.3 and 71.3 levels.

Read More

GLOBAL EQUITY MARKETS – March 2, 2019

REVIEW


The benchmark for the Global equity markets performance, the iShares MSCI All Country World Index ETF remains above its long-term 200-day moving average. The ETF is now testing a minor resistance level at 71.3. The rebound from January lows has been strong and without any correction. A possible correction can result in a pullback to test the 200-day moving average at 69.8 levels. With the price remaining above the long-term average, the technical outlook has turned positive.

Read More

GLOBAL EQUITY MARKETS – February 23, 2019

REVIEW


The benchmark for the Global equity markets performance the iShares MSCI All Country World Index ETF is testing the resistance level at 71.3 levels. Since the beginning of the year the ETF had a strong run towards the 200-day moving average. Over the past two weeks the ETF cleared its long-term average. If there is a pullback, the 200-day moving average will act as a support around 69.7 levels. Price action above the long-term average should be considered bullish and could signal a change in trend.

Read More

GLOBAL EQUITY MARKETS – February 16, 2019

REVIEW


The benchmark for the Global equity markets performance, the iShares MSCI All Country World Index ETF had another strong week pushing the ETF above its 200-day (40-week) moving average. Back to back weekly gains followed the V-bottom reversal from the support level at 63. I think we are likely to see some sort of consolidation around the long-term average. Given the uninterrupted advance from January lows, a short-term pullback can possibly form the right shoulder of a H&S bottom formation. Please note it is still early to call for such development. I want to highlight this possibility as many other benchmarks are forming similar structures. For a good example of a consolidation around the long-term average, you can check the H&S bottom formation in 2016.

Read More

GLOBAL EQUITY MARKETS – February 2, 2019

REVIEW


The benchmark for the Global Equity markets performance, the iShares MSCI All Country World Index ETF (ACWI.O) reached its 200-day moving average after a strong rebound from the support at 63 levels. Back to back weekly gains pushed the index towards the resistance level I follow and utilize as a trend filter. I consider price action above the long-term average as strong and expect higher levels. Price action below the long-term average shows weakness and can become part of a larger scale downtrend. Both daily and weekly scale price chart for the ACWI ETF hasn't provided a well-defined chart pattern.

Read More

GLOBAL EQUITY MARKETS – January 26, 2019

REVIEW


The benchmark for Global equity markets performance, iShares MSCI All Country World Index ETF (ACWI.O) had a strong rebound from the support level at 63 levels. V-reversal pushed the ETF towards its long-term moving average at 69.7 levels. In the last quarter of 2018, the ETF broke down its 7 month-long consolidation and started a corrective period. Over the past 5 weeks the ETF had back to back gains that recovered most of December 2018 losses without any pullback. Latest rebound might be due for a short pullback. I will be looking for bullish chart pattern developments to find low risk entry points.

Friday's price action was a gap opening. Below I analyze two gap openings on the iShares MSCI Emerging Markets ETF (EEM) and the iShares MSCI All Country World Index ETF (ACWI.O).

Read More

GLOBAL EQUITY MARKETS – January 19, 2019

REVIEW


The iShares MSCI All Country World Index ETF, a measure of Global equity markets performance, had a sharp rebound from the support level at 63. V-bottom reversals are difficult to analyze and trade. If we have seen a V bottom and the ETF keeps climbing higher in the following weeks, I will wait for the price to stabilize around the long-term average. During any pullback I will monitor this ETF for short/medium-term bullish continuation chart pattern developments. Long-term 200-day moving average stands at 69.7 levels.

Read More

GLOBAL EQUITY MARKETS – January 12, 2019

REVIEW


The iShares MSCI All Country World Index ETF, a measure of Global equity markets performance, had a sharp rebound from the support level at 63. Back to back weekly gains pushed the index towards the resistance area between 66.3 and 70. Is the recent rebound part of a bottoming process or a counter-trend rally in a downtrend? The answer lies in the following week's price action. V-bottom reversals are difficult to analyze and trade. If we have seen a V bottom and the ETF keeps climbing higher in the following weeks, I will wait for the price to stabilize above the long-term average. If there is a re-test of previous lows in an attempt to form a double bottom, then I will monitor the ETF for a long opportunity. The other possibility is that we see a short-term consolidation before moving higher. That again will alert me to look for bullish setups.

Read More

GLOBAL EQUITY MARKETS – January 5, 2019

REVIEW


The iShares MSCI All Country World Index ETF (ACWI.O) had another strong weekly close thanks to the Friday's price action. I'm analyzing the latest strength as a rebound in a downtrend. 63 levels remains as the strong support level. Previous support that was breached on the downside will act as resistance at 66.3 levels.

Read More