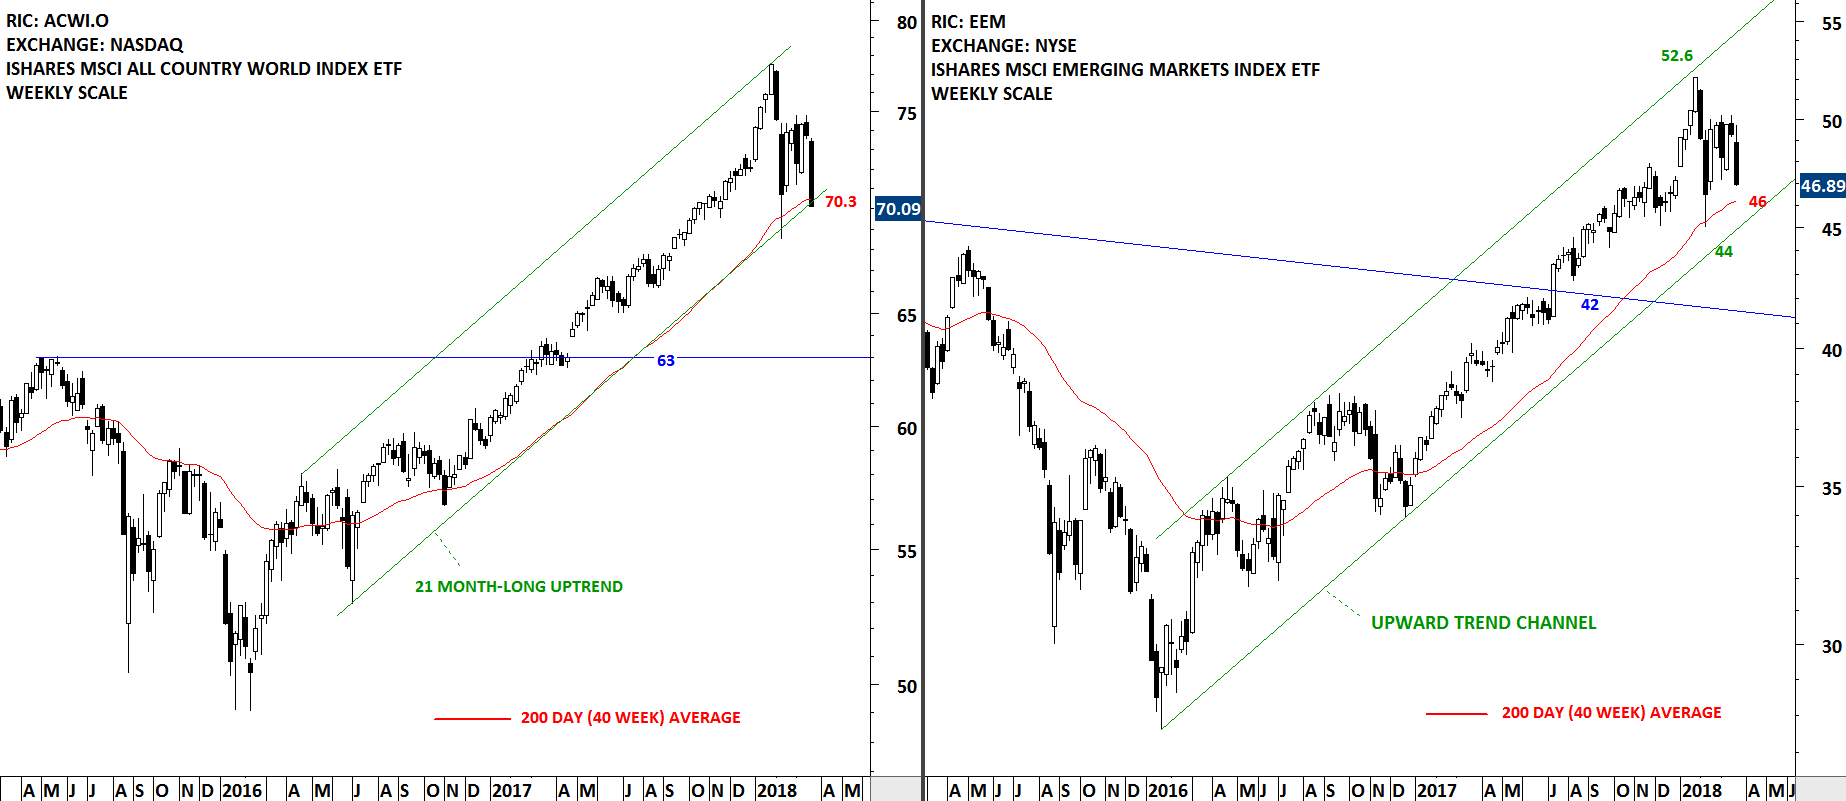
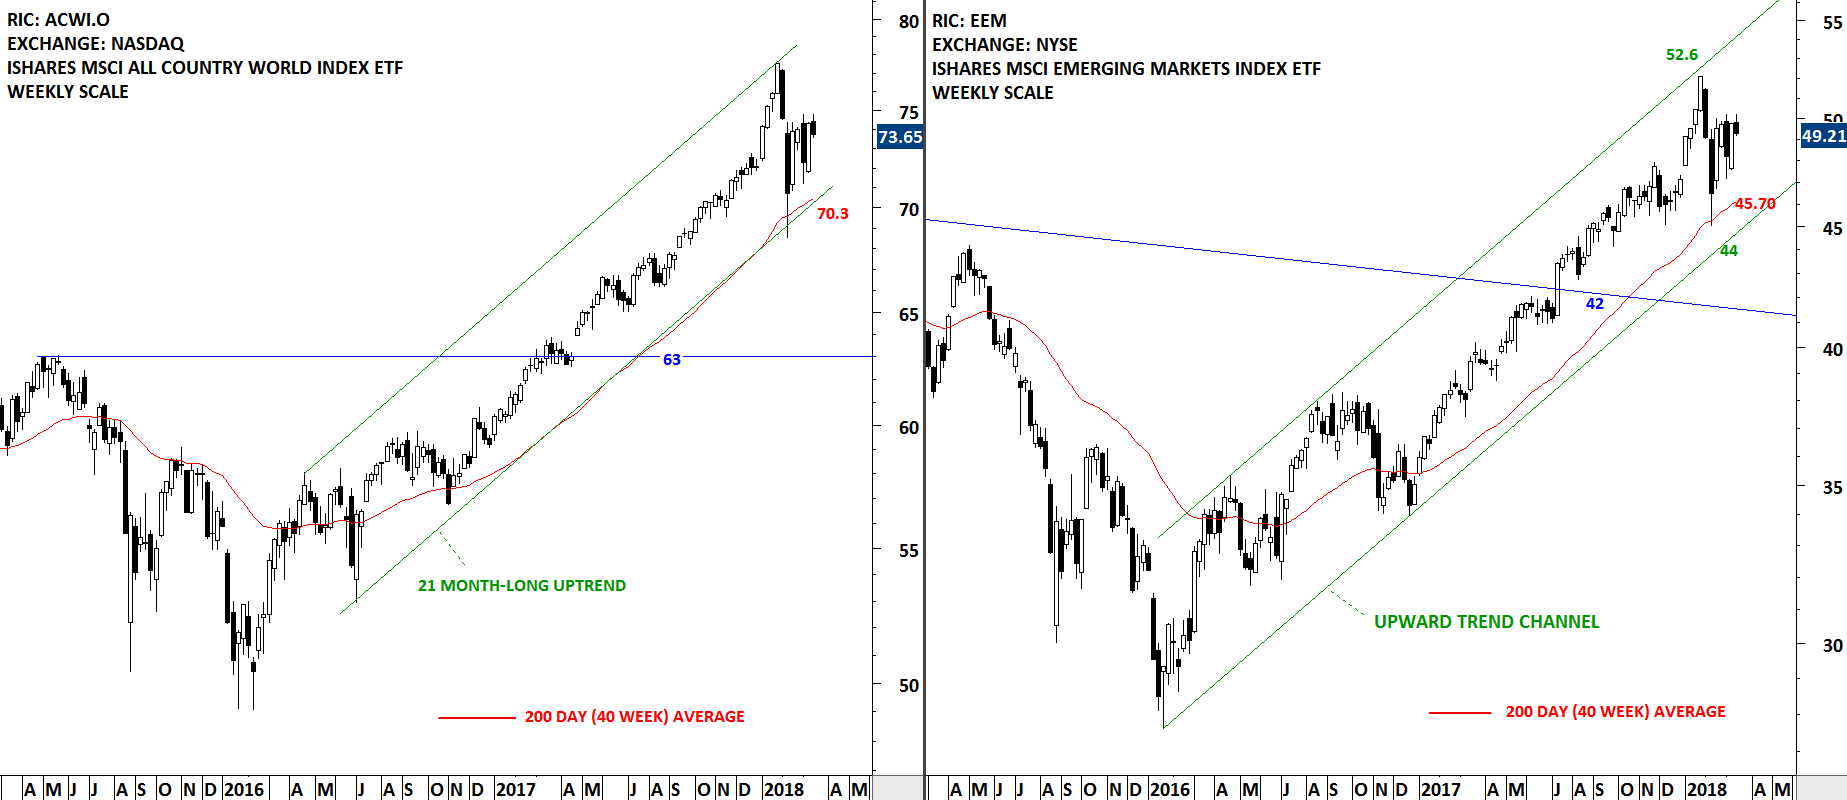
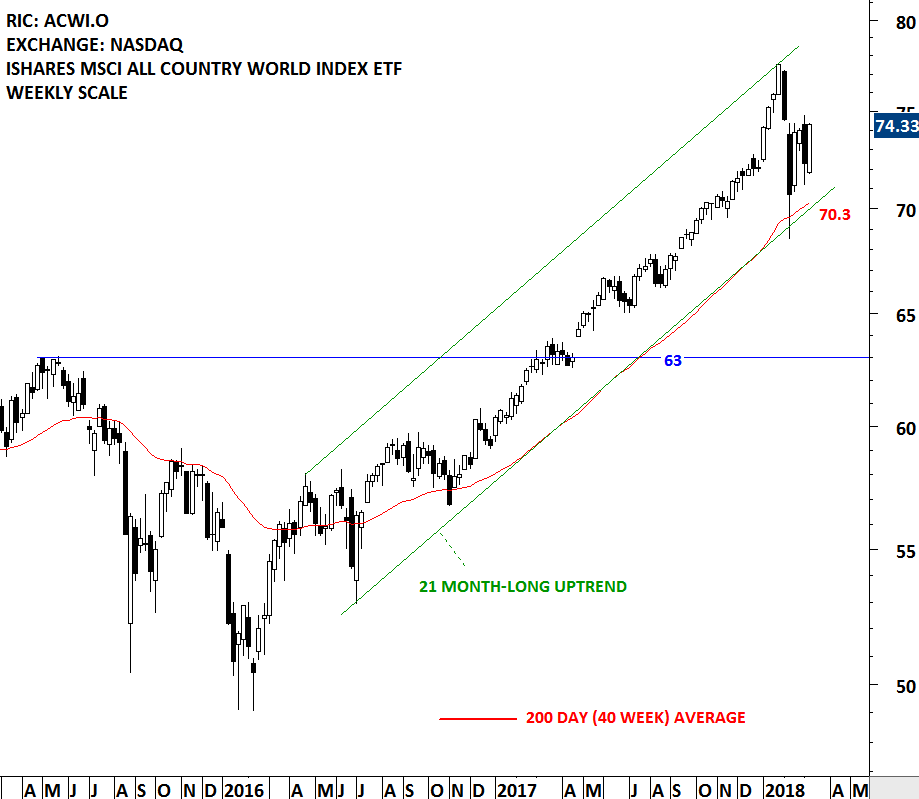
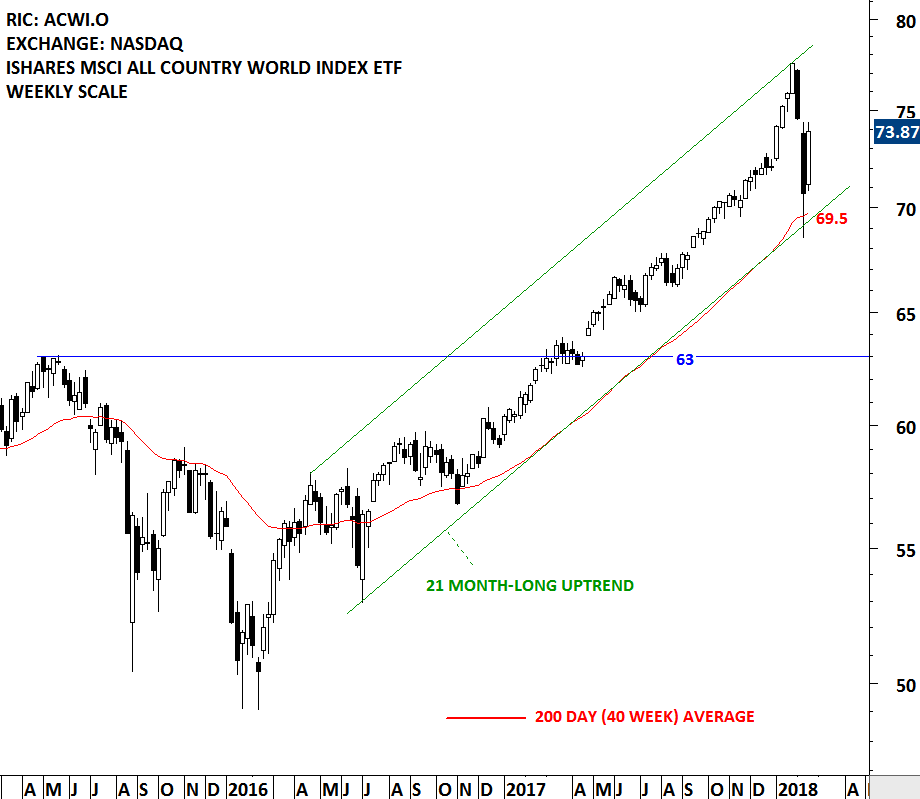
The first round of the 2017 French presidential election was held on 23 April 2017. As no candidate won a majority, a run-off election between the top two candidates, Emmanuel Macron of En Marche! and Marine Le Pen of the National Front (FN), will be held on 7 May 2017. Global equity markets reacted positively after centrist candidate Emmanuel Macron won the first round of the weekend’s French presidential election. European equities have been performing poorly since the beginning of the global financial crash in 2008. Any positive political and economic development is likely to help European equities to catch up in the relative performance. Though, European equities might need more catalyst than an election result to reverse long-term relationships.
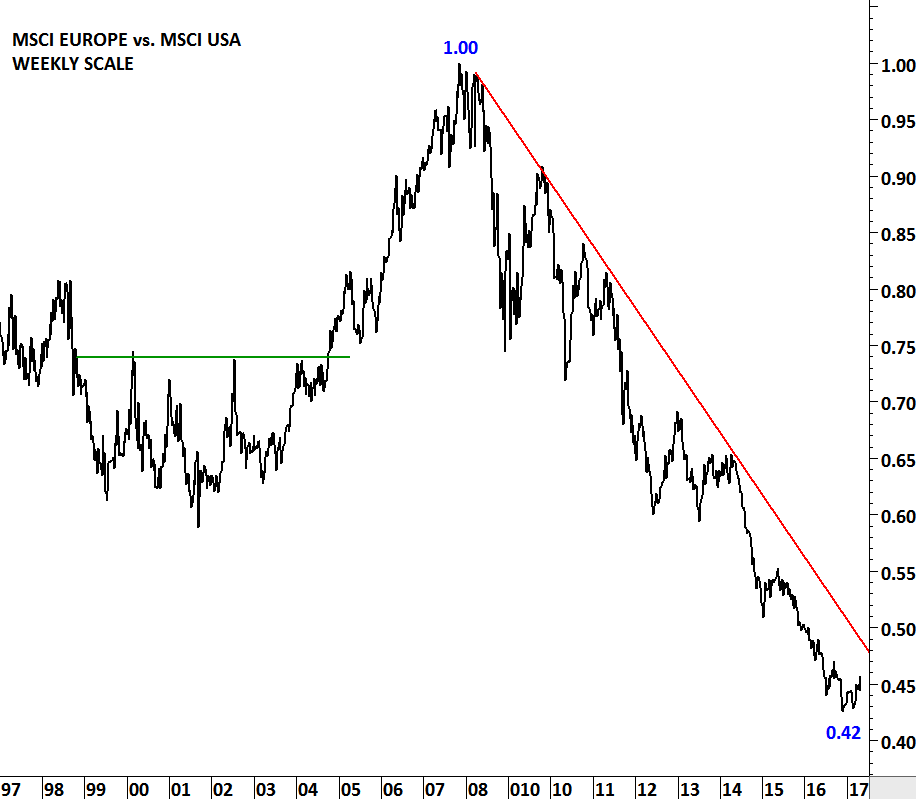
Two charts below show the massive under performance of the European equities vs. the U.S. equities over the past 9 years. Both the relative performance ratio between MSCI EUROPE vs. MSCI U.S. and EUROSTOXX 600 Index vs. S&P 500 Index shows a multi-year downtrend. This long-term relationship is something that we should keep a close eye on, as any major turnaround in European indices performance will result in more breakout opportunities in the European equities.
Relative performance ratio between the two indices is converted into an index to better visualize the change in value in percentage terms. 1.00 is an index value of 100. 0.42 is an index value of 42. The chart shows the index losing more than half of its value from the highest level in 2008. In other words MSCI EUROPE underperformed MSCI USA by 58% over the past 9 years. Data used for MSCI EUROPE and MSCI USA are price index in U.S. Dollar.
Read More

 Read More