Posts

GLOBAL EQUITY MARKETS – April 8, 2017

It has been a volatile week in the Global equity markets. There were 2 new breakout alerts. Both stocks cleared strong multi-month horizontal resistances.

#TECHCHARTSALERT


TINGYI CAYMAN ISLANDS HOLDING CORP (0322.HK)

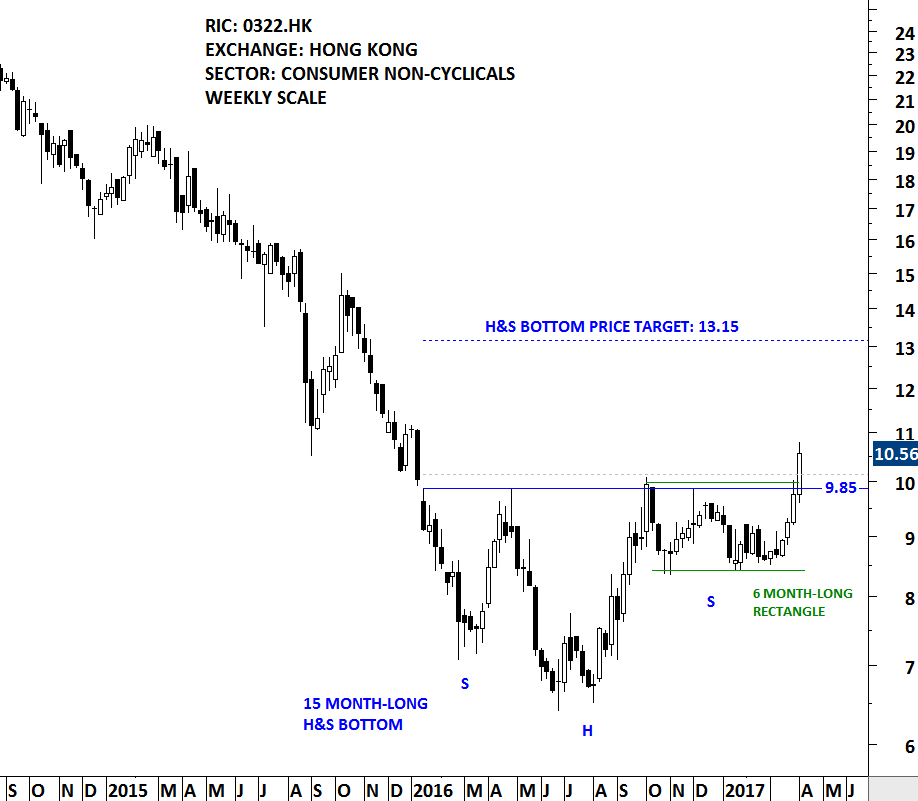
Tingyi (Cayman Islands) Holdings Corp. is a Hong Kong-based investment holding company principally engaged in the production and sales of instant noodles, beverages and instant food products. The stock is listed on the Hong Kong Stock Exchange. Price chart formed a 15 month-long H&S bottom with the right shoulder in the form of a 6 month-long rectangle. The neckline of the H&S bottom standing as a resistance at 9.85 has been tested for 4 times over the past year. The daily close above 10.15 confirmed the breakout from the multi-month base formation. 9.85 levels will now become support. Possible chart pattern price target stands at 13.15 levels.

Read More

GLOBAL EQUITY MARKETS – March 25, 2017

Global equity markets continue to offer great opportunities and text book chart pattern developments. In this update I bring to your attention well-defined chart patterns from Asia, Europe, North America and Emerging Markets that are candidates for possible breakouts and I also report fresh breakout alerts. Before we move on to equity markets, I want to draw your attention to a possibility developing in the interest rates and bonds market. During the weekly review of financial markets, I spotted the similar chart development on almost all kinds of bond market ETFs.

ISHARES BARCLAYS 20+YR TREASURY BOND ETF (TLT.O)

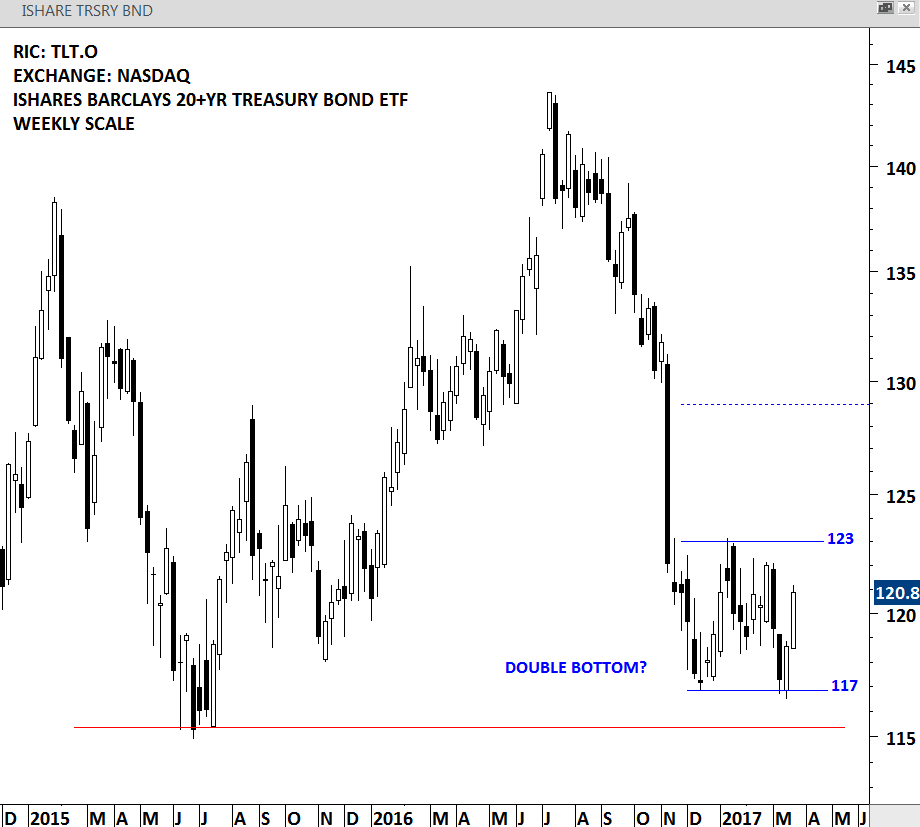
ISHARES BARCLAYS 20+YR TREASURY BOND ETF is an exchange traded fund listed on the Nasdaq Stock Exchange. The Fund seeks investment results that correspond generally to the price and yield performance of the long-term sector of the U.S. Treasury market as defined by the Barclays Capital 20+ Year Treasury Index. Price chart of this ETF is possibly forming a 4 month-long double bottom. This chart pattern is still at its early stages. The short-term consolidation remains between 117 and 123 levels. The low for the year 2015 stands at 115 as an other important medium/long-term support level. The latest chart development suggests that in the short/medium-term bonds might be finding support. Price should either break 117 levels on the downside or 123 levels on the upside for the chart pattern to complete.

Read More

GLOBAL EQUITY MARKETS – March 4, 2017

The MSCI Emerging Markets index is created by Morgan Stanley Capital International (MSCI) designed to measure equity market performance in global emerging markets. It is a float-adjusted market capitalization index that consists of indices in 23 emerging economies Brazil, Chile, China, Colombia, Czech Republic, Egypt, Greece, Hungary, India, Indonesia, Korea, Malaysia, Mexico, Peru, Philippines, Poland, Qatar, Russia, South Africa, Taiwan, Thailand, Turkey and United Arab Emirates.

Initiated in 1988, the MSCI Emerging Markets Index (MSCI EMI) represented 10 nations with a total world market capitalization of less than 1%. In 2016, the index has since grown to incorporate 23 countries that comprise about 10% of global market cap. Hence, the MSCI EMI is appropriately used as a benchmark for performance by many emerging market growth mutual funds.

The iShares MSCI Emerging Markets ETF seeks to track the investment results of MSCI Emerging Markets Index. This ETF does not include any currency hedging. This means investors in this product gain exposure to the underlying securities and the currencies in which they are denominated. It is an efficient way to take advantage of trends in the emerging markets and cyclical movements related to emerging markets local currencies.

Last week's update drew attention to the developing bearish candlestick reversal pattern, a shooting star, usually suggests lower prices following its completion. This week's lower opening and weak closing confirms the short-term pull-back in emerging markets equities.

ISHARES MSCI EMERGING MARKETS ETF - WEEKLY SCALE
ISHARES MSCI EMERGING MARKETS ETF - WEEKLY SCALE
Read More