GLOBAL EQUITY MARKETS – February 24, 2018

REVIEW


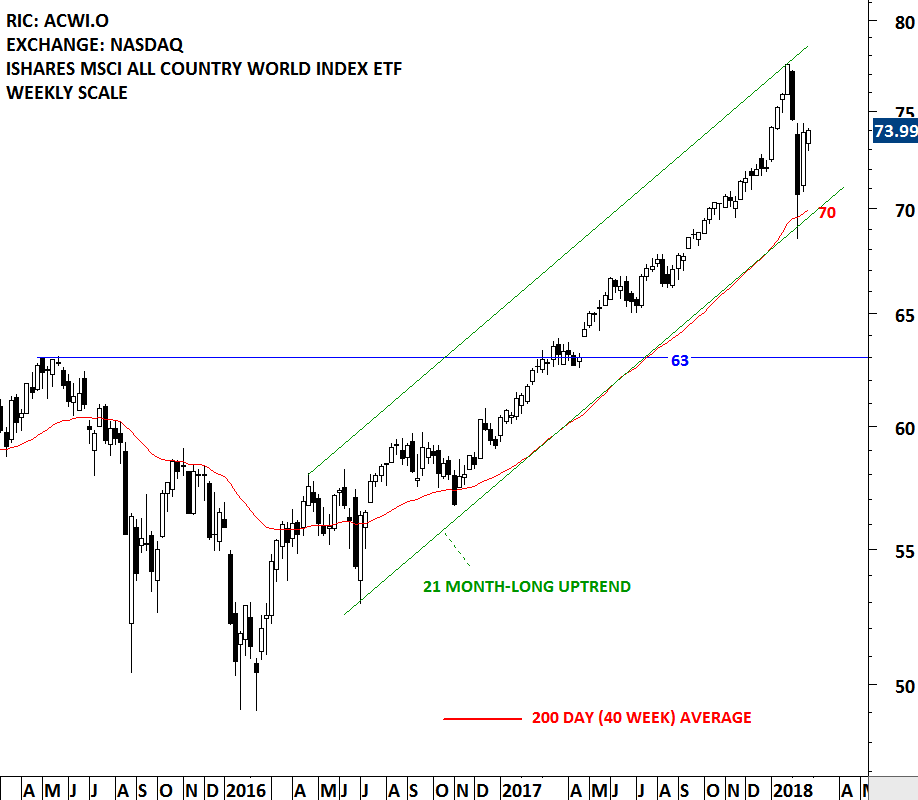
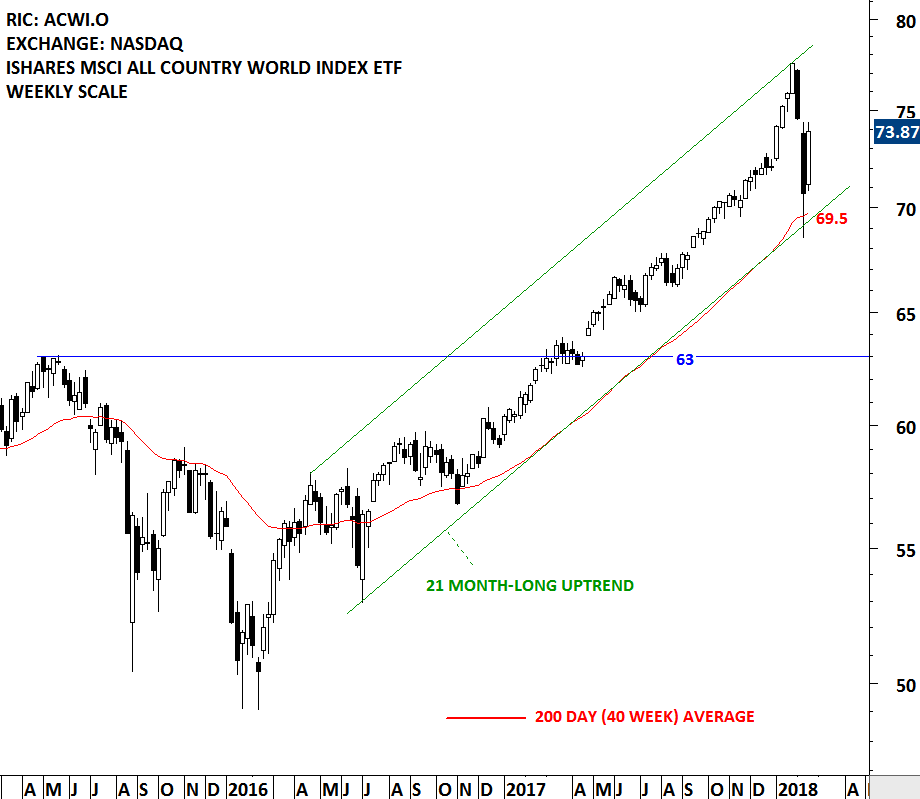
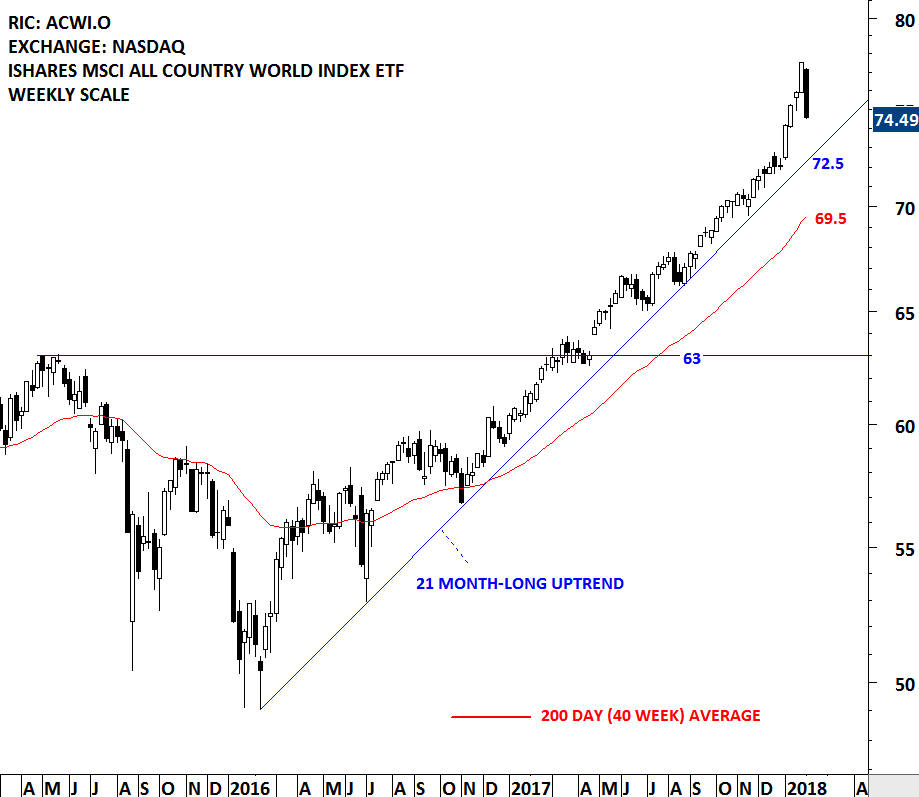
Global equity markets rebounded sharply and held on to last week’s gains. I follow the iShares MSCI All Country World Index ETF (ACWI.O) as a benchmark for the Global equity markets performance. The ETF is in a steady uptrend above the long-term (200 day, 40 week) average. Volatility increased in the month of February after the sharp sell-off in the equity markets. The ACWI ETF tested its long-term average which is now acting as strong support at 70 levels. Choppy sideways price action can continue for some time until we see lower levels on volatility. Usually, markets go through a period of consolidation after sharp corrections. I think we are in that stage.

Read more

TOP DOWN vs. BOTTOM UP ANALYSIS

Bottom-up research & investing focuses on the individual stocks and deemphasizes the significance of economic cycles and market cycles. In bottom-up investing, the investor focuses his attention on a specific company, rather than on the industry in which that company operates or on the economy as a whole. This is the opposite of top-down research & investing, which is a strategy that first considers macroeconomic factors when making an investment decision. Top-down investors instead look at the broad performance of the economy, and then seek industries that are performing well, investing in the best opportunities within that industry.

Read more

GLOBAL EQUITY MARKETS – February 17, 2018

REVIEW


Global Equity Markets had a strong rebound from their long-term averages. A benchmark for Global equity market performance; the iShares MSCI All Country World Index ETF rebounded from its 200-day (40 week) average and the lower boundary of its multi-month long upward trend channel. Long-term uptrend remains intact. In the following weeks Global equity indices will possibly continue to consolidate in a range until volatility is back to lower levels. In case of a re-test of last week’s lows, both the lower boundary of the uptrend and the long-term average will act as strong support levels.

Read more

RECTANGLE – TRADING RANGE

A stock (ETF, Index etc.) price is either in a trending phase or in a consolidation period. During strong trend periods prices move uninterrupted from one price level to another. During consolidations prices move in both directions without producing any meaningful or sustained price change and will form well-defined support and resistance areas on the charts. A support range represents a concentration of demand, and a resistance range represents a concentration of supply.

A resistance level is an approximate level or fairly well-defined price range, where previously advancing stock meets resistance in the form of strong selling. A support level is an approximate level or price range where a preceding decline meets support, in the form of strong buying. A possible explanation for appearance of such well-defined price boundaries in the form of support and resistance can be the fact that the public tend to remember previous levels the stock has traded.

The longer the time which the stock spent in that range, therefore, the greater the number of transactions, the more important that range becomes for future technical consideration. In applying support and resistance study to price charts, the weekly scale time frame is usually more informative than daily scale. Weekly charts show much more plainly the levels at which congestion of significant duration appeared.

Read more

GLOBAL EQUITY MARKETS – February 10, 2018

REVIEW


Global equity benchmarks deviated far from the averages that a 10% correction in 2 weeks is still considered a reversion to the mean. With this week’s continued sell-off both benchmarks for Global equities, the iShares MSCI All Country World Index ETF and the iShares MSCI Emerging Markets Index ETF reached their respective 200-day (40 week) moving averages. The 200-day moving average and the lower boundary of multi-month long upward trend channels are forming support around the same levels. Read more

INTERIM UPDATE – February 9, 2018

PREMATURE & FALSE BREAKOUTS

Below two paragraphs are taken from Peter L. Brandt’s Diary of a Professional Commodity Trader – Lessons from 21 weeks of real trading.

premature breakout is different from an out of line movement in the sense that a premature breakout can close outside of a predrawn boundary line and even spend several days in breakout mode. Prices then return back to the geometric pattern. However, the initial breakout was only a harbinger of things to come, and within a few weeks a genuine breakout occurs. I call these subsequent breakouts secondary breakouts or pattern recompletions.” – Ch 3, page 38, Identifying the trades and the trading vocabulary

Read more

INTERIM UPDATE – February 8, 2018

SIBANYE GOLD LTD (SGLJ.J, SBGL.K)

Sibanye Gold Limited is an independent, global precious metal mining company. The Company is engaged in producing a mix of metals that includes gold and the platinum group metals (PGMs). Its projects are grouped by two regions: the Southern Africa region and the Americas region. Its products include gold, platinum group metals and by-products. The Company’s gold project in the Southern Africa region includes Beatrix, Cooke, Driefontein, and Kloof. Its PGM projects include Kroondal, Rustenburg operations, Mimosa, and Platinum Mile. Its other projects in the Southern Africa region include Burnstone, Kloof Decline, Driefontein decline, The West Rand Tailings Retreatment Project (WRTRP) and The Southern Free State (SOFS) project. The Company’s PGM project in the Americas region includes East Boulder, Stillwater, and Columbus Metallurgical Complex. Its other projects in the Americas region include Blitz, Altar and Marathon. The stock is listed on the Johannesburg Stock Exchange as well as on the New York Stock Exchange via depository receipts.

Read more

GLOBAL EQUITY MARKETS – February 3, 2018

REVIEW


2018 started with strong weekly gains. The steady uptrend on the iShares MSCI All Country World Index ETF took a steep shape in January due to back to back long weekly candlesticks. This week’s sharp reversal gave back last two week’s gains. From a classical charting perspective we don’t have enough evidence to call the latest reversal a “market top”. Multi month-long uptrend is still intact. We are currently experiencing a reversion back to the averages or to the long-term trend line supports. Global equities can retrace further and major equity benchmarks can still remain in their long-term uptrends. We will need more evidence in the following weeks.

Read more

INTERIM UPDATE – February 2, 2018

Germany’s DAX Index experienced a sharp sell-off after reaching all-time highs. Last one week’s price action pulled the index back to strong support level at 12,800 levels. Read more

HEAD & SHOULDER FAILURE

Every week Tech Charts Global Equity Markets report features some of the well-defined, mature classical chart patterns under a lengthy watchlist and the chart pattern breakout signals that took place during that week. Global Equity Markets report covers single stocks from developed and emerging markets, ETF’s and global equity indices. The report starts with a review section that highlights the important chart developments on global equity benchmarks. This blog post features an educational piece from the Tech Charts Study of the Global Equity Markets report.

HEAD & SHOULDER FAILURE

Head and Shoulder is a reliable reversal chart pattern that forms after an advance or a decline and the completion of the formation suggests a reversal of the existing trend. Global Equity Markets report focuses mainly on chart patterns with horizontal boundaries. H&S shoulder chart patterns with horizontal necklines are usually highlighted in the weekly reports.

Read more