
TOP DOWN vs. BOTTOM UP ANALYSIS
Bottom-up research & investing focuses on the individual stocks and deemphasizes the significance of economic cycles and market cycles. In bottom-up investing, the investor focuses his attention on a specific company, rather than on the industry in which that company operates or on the economy as a whole. This is the opposite of top-down research & investing, which is a strategy that first considers macroeconomic factors when making an investment decision. Top-down investors instead look at the broad performance of the economy, and then seek industries that are performing well, investing in the best opportunities within that industry.
Tech Charts follows a bottom-up research strategy in finding well-defined and mature chart patterns. Every week I go through 1000s of charts irrespective of the industry and sector they are in. As I flip through charts I don’t pay attention to the name of the company to have an unbiased view. I look for clear chart patterns with well-defined horizontal boundaries developing in duration of 4 months to 24 months. After selecting those charts that meet my criteria for classical chart patterns, I start my research on liquidity, exchange, market cap, peer comparison and sector/industry classification.
It is possible that the bottom up approach will capture a developing market trend. I.e. several bullish chart patterns on Banking and Finance stocks can signal a positive development for that sector/industry.
The bottom-up approach allows me to bring to members attention a diverse group of charts from different geographies, exchanges, sectors/industries and both with bullish and bearish chart pattern setups. Below are two examples from the past few week’s Tech Charts Watchlist. The watchlist is a section of the weekly Global Equity Markets report.
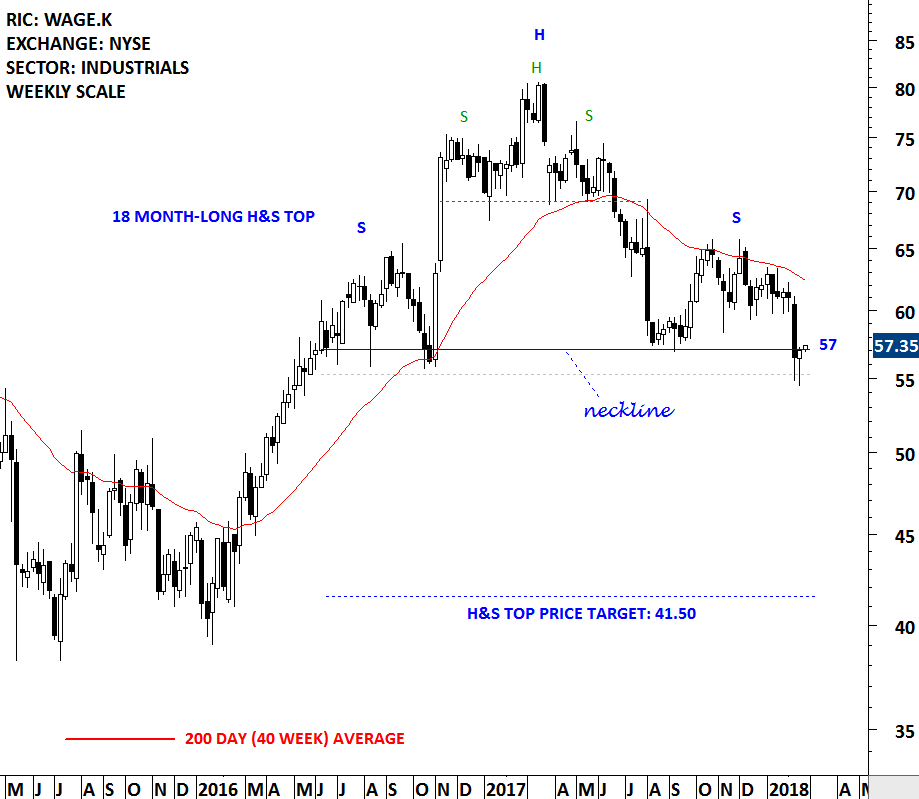
WAGEWORKS INC (WAGE.K)
WageWorks, Inc. is engaged in administering Consumer-Directed Benefits (CDBs). The Company administers CBDs, including pre-tax spending accounts, such as Health Savings Accounts (HSAs), health and dependent care Flexible Spending Accounts (FSAs), and Health Reimbursement Arrangements (HRAs), as well as Commuter Benefit Services, including transit and parking programs, wellness programs, Consolidated Omnibus Budget Reconciliation Act (COBRA) and other employee benefits. The stock is listed on the New York Stock Exchange. Price chart formed an 18 month-long head and shoulder top with the horizontal boundary (neckline) acting as strong support at 57 levels. The neckline was tested several times over the course of the chart pattern. A daily close below 55.25 levels will confirm the breakdown from the 18 month-long head and shoulder top with the possible chart pattern price target of 41.5 levels.
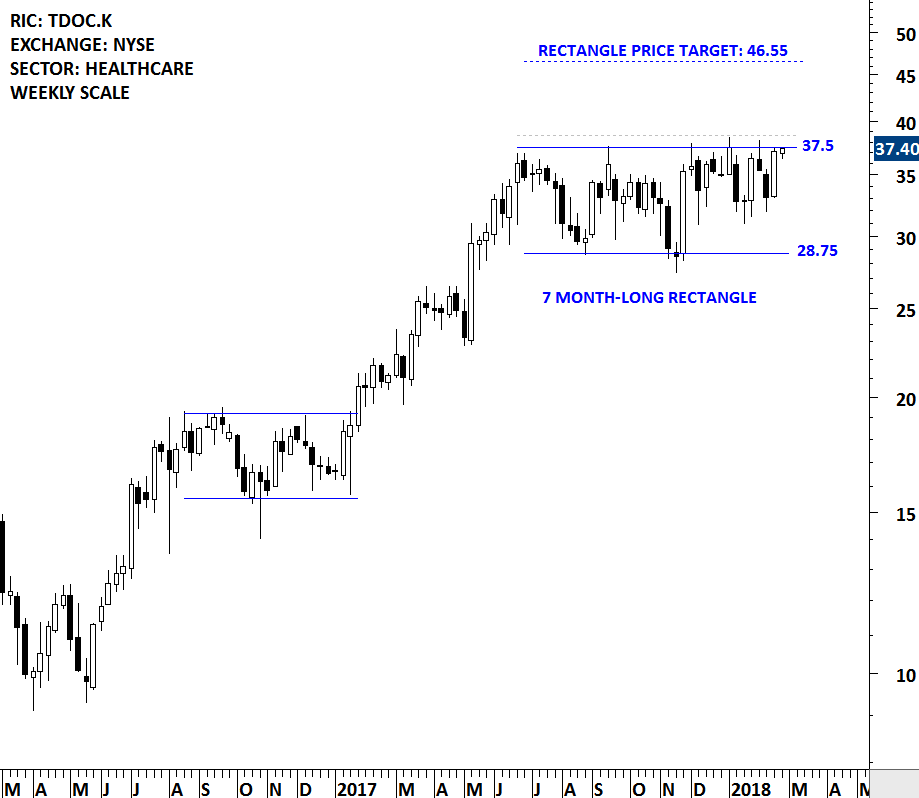
TELADOC INC (TDOC.K)
Teladoc, Inc. is a telehealth company. The Company offers telehealth platform, delivering on-demand healthcare anytime, anywhere, through mobile devices, the Internet, video and phone. The Company’s solution connects its Members, with its over 3,000 board certified physicians and behavioral health professionals treating a range of conditions and cases from acute diagnoses, such as upper respiratory infection, urinary tract infection and sinusitis to dermatological conditions, anxiety and smoking cessation. The stock is listed on the New York Stock Exchange. Price chart formed a 7 month-long rectangle with the upper boundary acting as strong resistance at 37.5 levels. The upper boundary was tested several times over the course of the chart pattern. A daily close above 38.6 levels will confirm the breakout from the 7 month-long rectangle with the possible chart pattern price target of 46.55 levels. Breakout from the multi-month long rectangle chart pattern can push the stock to all-time high levels.
Tech Charts Membership

By becoming a Premium Member, you’ll be able to improve your knowledge of the principles of classical charting.
With this knowledge, you can merge them with your investing system. In fact, some investors use my analyses to modify their existing style to invest more efficiently and successfully.

As a Premium Member of Aksel Kibar’s Tech Charts,
You will receive:
-
Global Equities Report. Delivered weekly.
-
Classical charting principles. Learn patterns and setups.
-
Actionable information. Worldwide indices and stocks of interest.
-
Risk management advice. The important trading points of each chart.
-
Information on breakout opportunities. Identify the ones you want to take action on.
-
Video tutorials. How patterns form and why they succeed or fail.
-
Watch list alerts. As they become available so you can act quickly.
-
Breakout alerts. Usually once a week.
-
Access to everything (now and as it becomes available)o Reports
o Videos and video series -
Multi-part webinar course. You learn the 8 most common charting principles.
-
Webinars. Actionable and timely advice on breaking out chart patterns.
For your convenience your membership auto renews each year.


