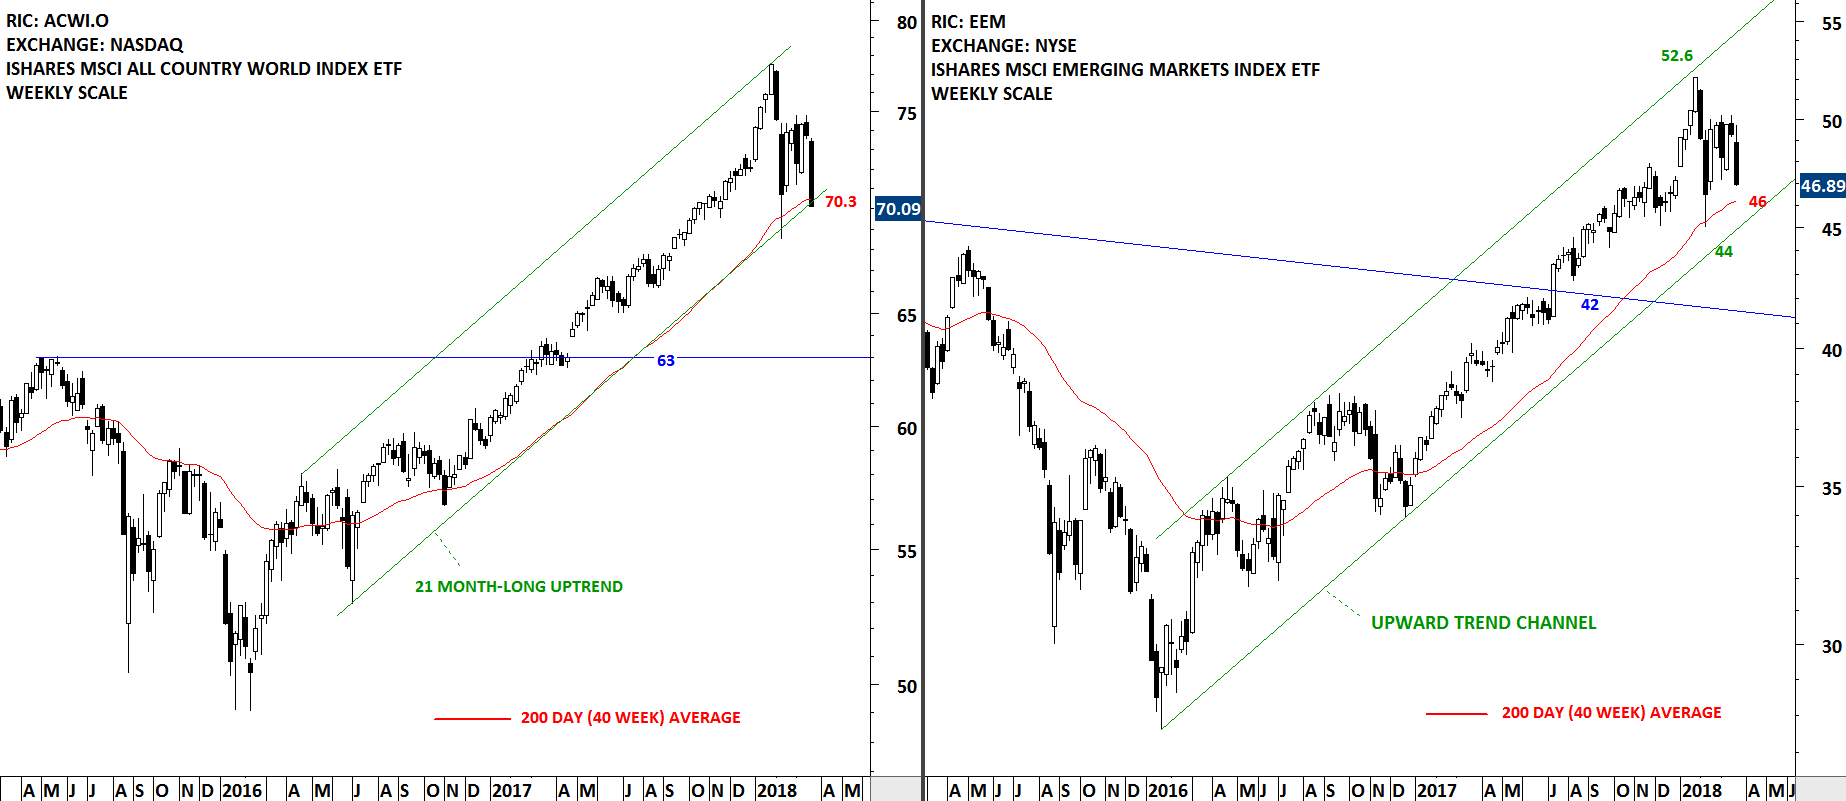
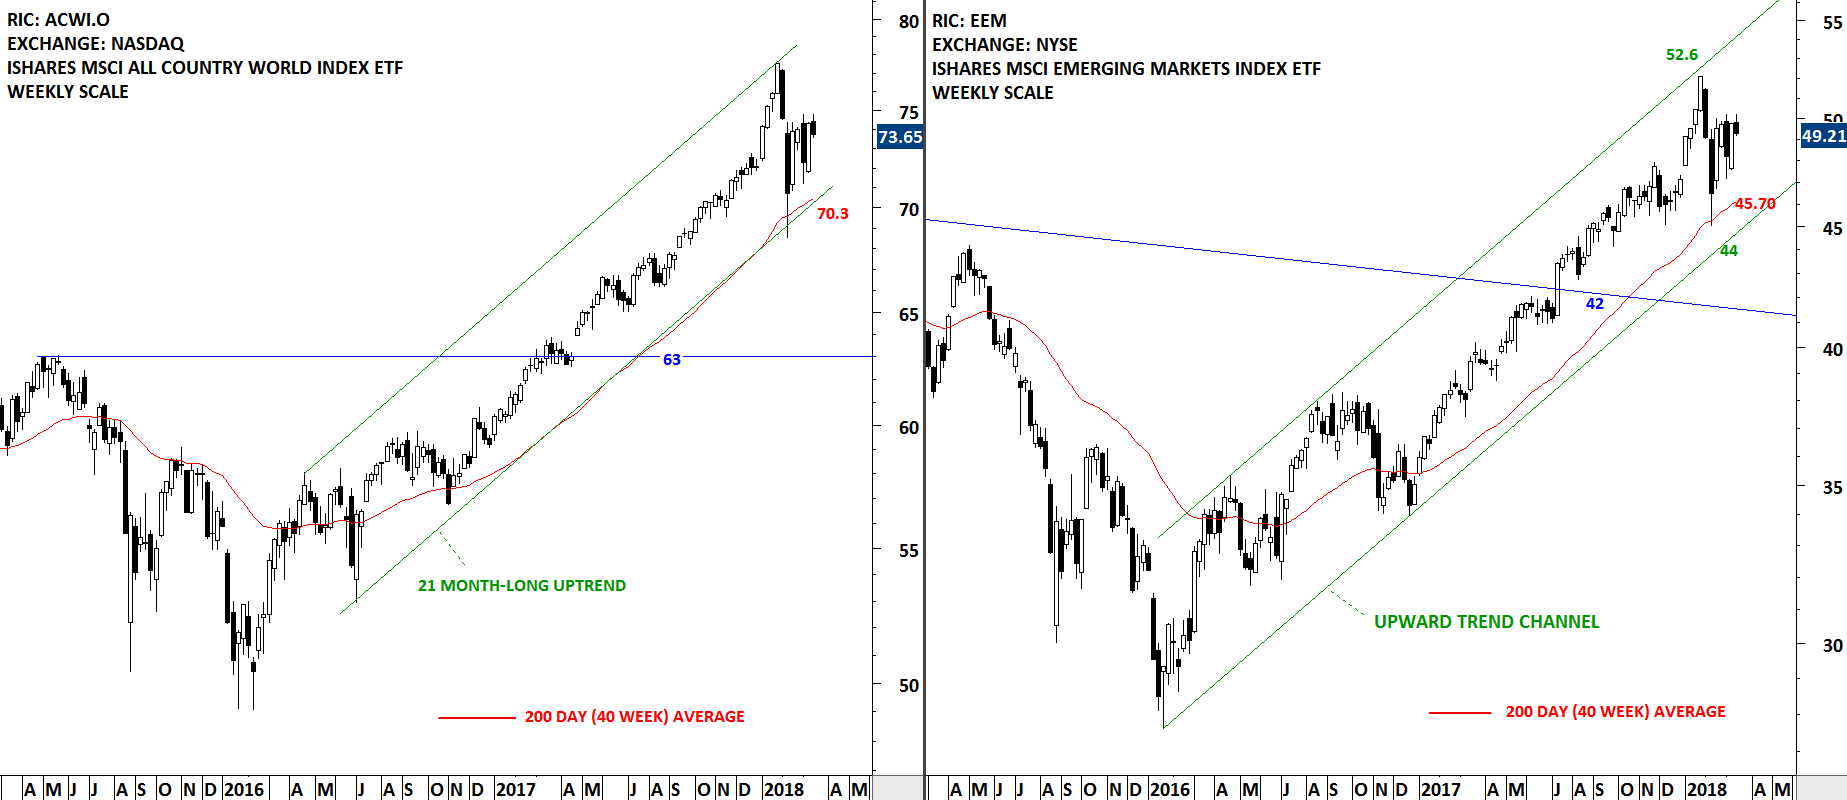
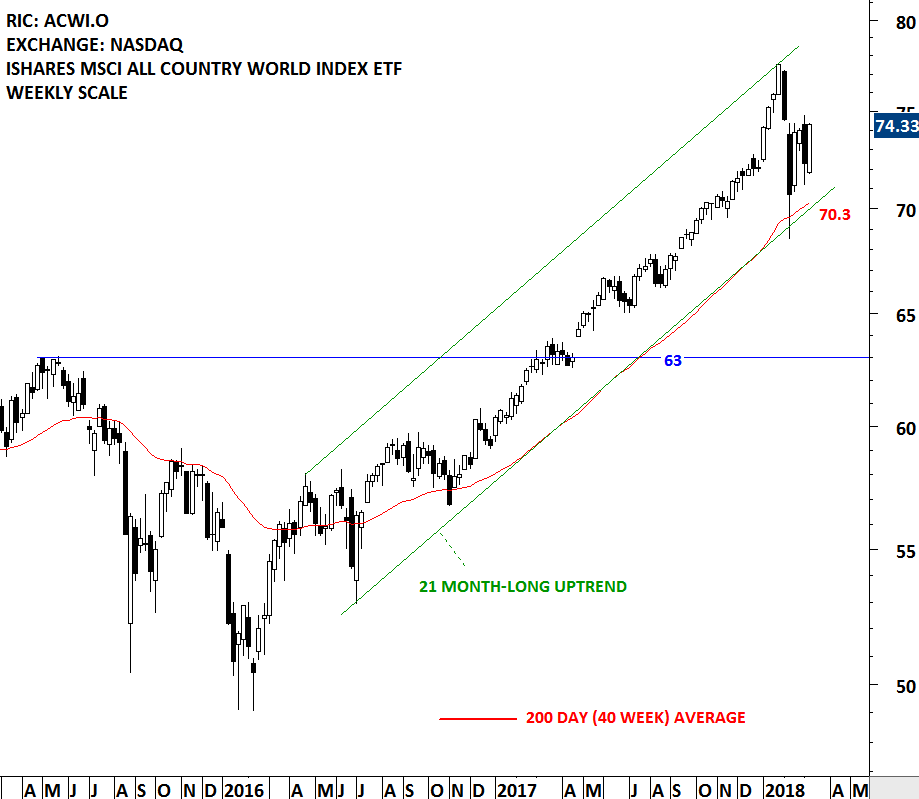
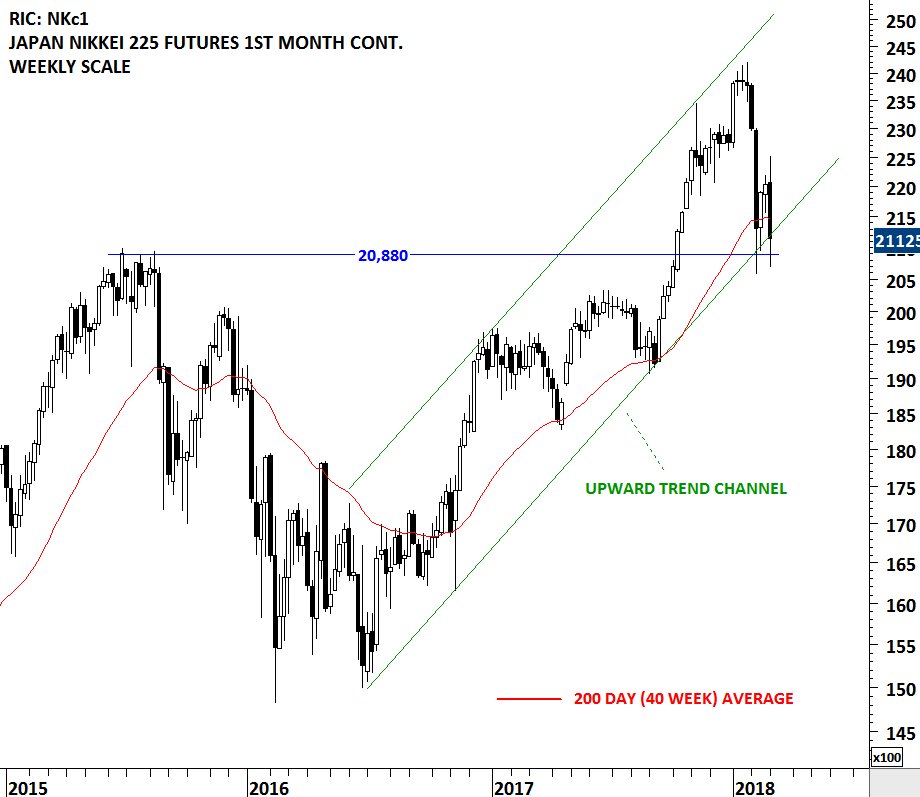
CHART PATTERNS ON DUAL-LISTED SECURITIES

Every week Tech Charts Global Equity Markets report features some of the well-defined, mature classical chart patterns under a lengthy watchlist and the chart pattern breakout signals that took place during that week. Global Equity Markets report covers single stocks from developed and emerging markets, ETF’s and global equity indices. The report starts with a review section that highlights the important chart developments on global equity benchmarks. This blog post features a dual listed equity from the watch list section of the Global Equity Markets report. Dual listed equities allow access to traders/investors that are operating in different exchanges/geographies.

Read more

GLOBAL EQUITY MARKETS – March 24, 2018

REVIEW


Both the iShares MSCI All Country World Index ETF and iShares MSCI Emerging Markets Index ETF are headed towards their February lows. Next few weeks will be important as these two Global equity benchmarks will tell us if the 2 year-long uptrend in equities is over or not. Breakdown below long-term averages will also violate the lower boundary of steady upward trend channels. While the iShares MSCI Emerging Markets index has margin towards the strong support area, the iShares MSCI All Country World Index closed the week at the support level. Unless we see a stability above 70 levels, the ETF can correct towards the next support at 63 levels.

Read more

EUROSTOXX 600 & HEDJ EUROPE EQUITY ETF

Every week Tech Charts Global Equity Markets report features some of the well-defined, mature classical chart patterns under a lengthy watchlist and the chart pattern breakout signals that took place during that week. Global Equity Markets report covers single stocks from developed and emerging markets, ETF’s and global equity indices. The report starts with a review section that highlights the important chart developments on global equity benchmarks. This blog post features a review on European equity benchmark highlighted in the review section from the Global Equity Markets report. Also you will find a chart setup developing on HEDJ Europe Equity ETF.

Read more

Ascending Triangle Chart Patterns – March 2018 Tech Charts Webinar

Ascending Triangle Chart Patterns – March 2018 Tech Charts Webinar 

  • Ascending triangle is a reliable bullish chart pattern that can act as a bottom reversal and continuation
  • Breakouts from chart patterns with horizontal boundaries are more reliable when compared with breakouts from diagonal boundaries
  • Important technical points when identifying ascending triangle chart patterns
  • Importance of several tests of chart pattern boundary before a breakout takes place
  • The broader context of price action and where the ascending triangle chart pattern forms
  • Ascending triangle as a launching pattern
  • Ascending triangle forming as a bottom reversal will take longer to develop
  • Review of ascending triangle chart pattern breakouts between May 2017 and February 2017
  • Defining chart pattern negation level and a logical point to label chart pattern negation on ascending triangle
  • Recent chart pattern breakouts
  • Developing ascending triangle chart patterns; a review of watchlist candidates
  • Q&A

Live questions from Members  

  1. Which broker do you recommend, where I can trade these stocks? I’m having a hard time finding one. 48:05
  2. If I’m new to classical charting, what should I do to learn how to identify each pattern? 49:45
  3. Any comment you care to make on the state of global markets? Europe and Japan look on edge… 51:44
  4. Do you actually search through hundreds of charts each week or do you use a software that alerts you to a breakout taking place across various markets? 53:14
  5. Science vs Art question – on the SBLK chart can you discuss your reasons for drawing the horizontal line where you did? 58:13
  6. Do you sell all your positions at profit target, if not how do you scale out? 1:00:33
  7. Do you look at currency and commodity patterns?1:01:23
  8. Do you look also for short sale candidates? 1:02:30
  9. Is there any point to consider when applying classical chart patterns on forex charts instead of stock? 1:04:50
  10. Do you have an estimate of timing – when the target should be met breaking out of these ascending triangle? 1:05:45

Recorded live 3.8.2018   

Read more

GLOBAL EQUITY MARKETS – March 17, 2018

REVIEW


To summarize the current technical outlook in the Global Equity markets, I would say “range-bound”. Global Equity benchmark charts below show the boundaries of the recent consolidations. After the sharp sell-off in the first half of February, global indices are returning back to low volatility conditions. Both the iShares MSCI All Country World Index ETF (ACWI.O) and the iShares MSCI Emerging Markets Index ETF (EEM) are in a long-term uptrend. Both benchmarks are above their long-term averages. Latest consolidations are taking place above strong support areas.


Read more

TECH CHARTS WATCHLIST & ALERTS

Every week Tech Charts Global Equity Markets report features some of the well-defined, mature classical chart patterns under a lengthy watchlist and the chart pattern breakout signals that took place during that week. Global Equity Markets report covers single stocks from developed and emerging markets, ETF’s and global equity indices. The report starts with a review section that highlights the important chart developments on global equity benchmarks. This blog post features one of several great chart analysis that were highlighted in the watchlist section from the previous Global Equity Markets report. Also you will find another similar H&S continuation chart setup that completed on the upside and was featured in the breakout alerts section.

Read more

GLOBAL EQUITY MARKETS – March 10, 2018

REVIEW


A strong weekly close and especially a strong Friday price action is positive for Global equities. However, it is still early to conclude that the short term consolidation is over and we are headed to new all-time highs. I think we are still in the consolidation phase and choppy price action can continue for some time.

The long-term trend is upwards for the iShares MSCI All Country World Index ETF (ACWI.O). The benchmark for Global equity market performance continues to remain above its long-term average. In the short/medium-term, the ETF is in a trading range between the all-time high at 77.55 and 70 levels.

Read more

INTERIM UPDATE – March 7, 2018

Reminder on Live Webinar

Due to very positive feedback we got for the last webinar on rectangle chart patterns, we are continuing the webinar series with another reliable horizontal chart pattern; the ascending triangle. Live Webinar and Q&A with Aksel – Thursday, March 8, 11am mountain. You can register here (Register for the Live Webinar)

Over the past few weeks Global Equity Markets report featured some great chart setups in U.S. Regional Banks & Financials. Some of those chart patterns are resolved on the upside and some are about to complete. As we see more strength in the sector I thought it is a good time to review some of those recent chart pattern developments. Read more

GLOBAL EQUITY MARKETS – March 3, 2018

Reminder on Live Webinar

Due to very positive feedback we got for the last webinar on rectangle chart patterns, we are continuing the webinar series with another reliable horizontal chart pattern; the ascending triangle. Live Webinar and Q&A with Aksel – Thursday, March 8, 11am mountain. You can register here (Register for the Live Webinar)


REVIEW


Equity indices that had weak rebound from the lows, tested the same support areas. Japan’s Nikkei Index is one of them. On the weekly scale we can see that the upward trend channel is still intact with the support forming at 20,880 levels. On the daily scale price chart (futures price data to capture Friday’s close) we can see that the Friday’s recovery on U.S. indices helped the Nikkei Futures to form a Doji candlestick at the support. Failure to hold these levels can result in a larger scale correction. In the short-term Japan’s Nikkei will try to find support around 20,880 levels and if it succeeds we will possibly label the price action as a double bottom.

Read more

Live Webinar and Q&A with Aksel – Thursday, March 8, 11am mountain

Dear Tech Charts Members,

(Register below)

Due to very positive feedback we got for the last webinar on rectangle chart patterns, we are continuing the webinar series with another reliable horizontal chart pattern; the ascending triangle. Ascending triangle is a chart pattern with horizontal boundaries and has bullish implications. It can form as a bottom reversal or a bullish continuation chart pattern. Over the past couple of months the Global Equity Markets report has featured great chart setups that I identified as well-defined ascending triangles.

The upcoming webinar is dedicated to a thorough discussion on this reliable horizontal chart pattern.

  • We will review some of those chart pattern breakouts that were featured in the Global Equity Markets report.
  • We will look at some of the developing chart pattern breakout opportunities.
  • We will continue to highlight Tech Charts members favorite ascending triangle setups in different equity markets. I would like to discuss and share some of the best classical chart patterns that members identified or those charts that members might have questions about.
  • As usual we will have a member Q&A at the end of the webinar.

Read more