
CHART PATTERNS ON DUAL-LISTED SECURITIES
Every week Tech Charts Global Equity Markets report features some of the well-defined, mature classical chart patterns under a lengthy watchlist and the chart pattern breakout signals that took place during that week. Global Equity Markets report covers single stocks from developed and emerging markets, ETF’s and global equity indices. The report starts with a review section that highlights the important chart developments on global equity benchmarks. This blog post features a dual listed equity from the watch list section of the Global Equity Markets report. Dual listed equities allow access to traders/investors that are operating in different exchanges/geographies.
TRUBNAYA METALLURGICHESKAYA KOMPANIYA PAO (TRMK.MM, TRMKq.L)
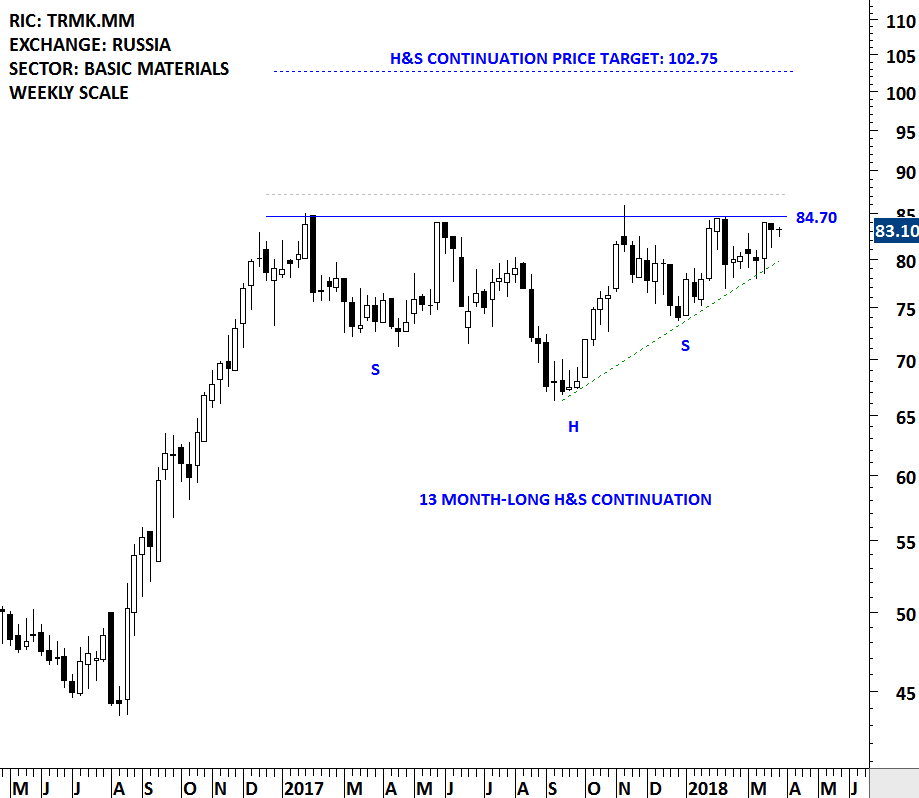
Trubnaya Metallurgicheskaya Kompaniya PAO (TMK PAO or Pipe Metallurgical Company PJSC), formerly Trubnaya Metallurgicheskaya Kompaniya OAO, is a Russia-based company, which is engaged in the production and distribution of seamless and welded pipes for the oil and gas industry and for general use. The Company’s product lines include drill pipe, oil country tubular goods (OCTG), line pipe, boiler tube, mechanical pipe and structural pipe made of carbon, alloy and stainless steel. The Company operates through a number of subsidiaries and branches, located in the Russian Federation and in Germany, Switzerland, the United States of America and Kazakhstan. The stock is listed on the Moscow Interbank Currency Exchange. Price chart formed a 13 month-long head and shoulder continuation chart pattern with the neckline acting as strong resistance at 84.70 levels. The horizontal boundary was tested several times over the course of the chart pattern. A daily close above 87.25 levels will confirm the breakout from the 13 month-long head and shoulder continuation with the possible chart pattern price target of 102.75 levels.
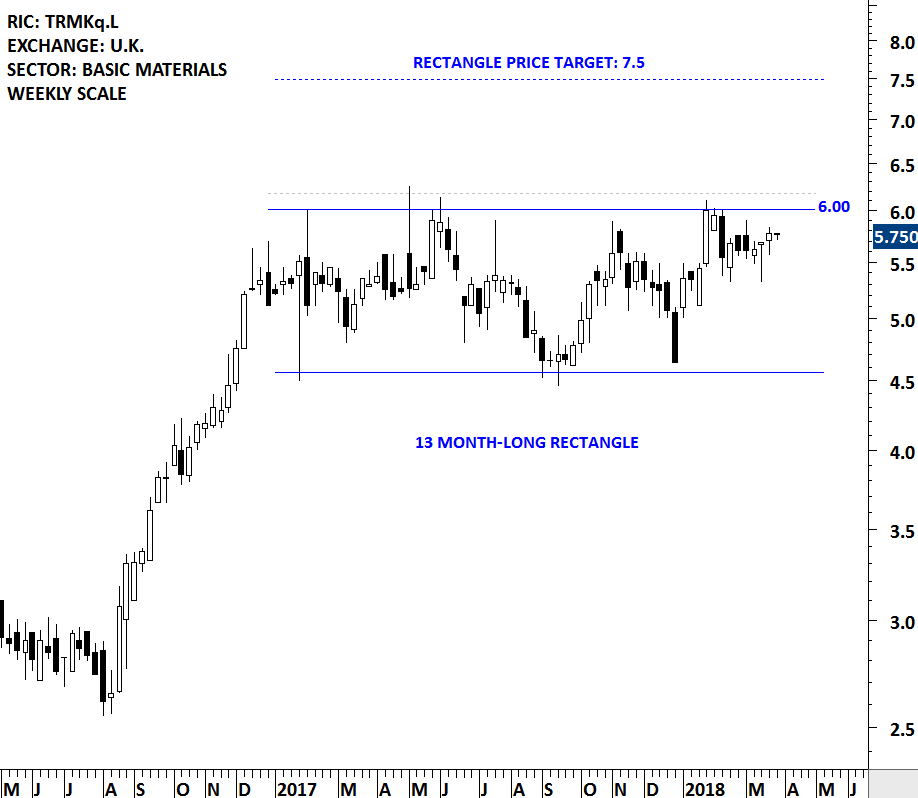
TRMK is dual listed via depository receipts on the London Stock Exchange. Price chart on the London listing formed a 13 month-long rectangle with the upper boundary acting as resistance at 6.00 levels. A daily close above 6.18 levels will confirm the breakout from the multi-month long consolidation with the possible chart pattern price target of 7.5 levels.
Tech Charts Membership

By becoming a Premium Member, you’ll be able to improve your knowledge of the principles of classical charting.
With this knowledge, you can merge them with your investing system. In fact, some investors use my analyses to modify their existing style to invest more efficiently and successfully.

As a Premium Member of Aksel Kibar’s Tech Charts,
You will receive:
-
Global Equities Report. Delivered weekly.
-
Classical charting principles. Learn patterns and setups.
-
Actionable information. Worldwide indices and stocks of interest.
-
Risk management advice. The important trading points of each chart.
-
Information on breakout opportunities. Identify the ones you want to take action on.
-
Video tutorials. How patterns form and why they succeed or fail.
-
Watch list alerts. As they become available so you can act quickly.
-
Breakout alerts. Usually once a week.
-
Access to everything (now and as it becomes available)o Reports
o Videos and video series -
Multi-part webinar course. You learn the 8 most common charting principles.
-
Webinars. Actionable and timely advice on breaking out chart patterns.
For your convenience your membership auto renews each year.


