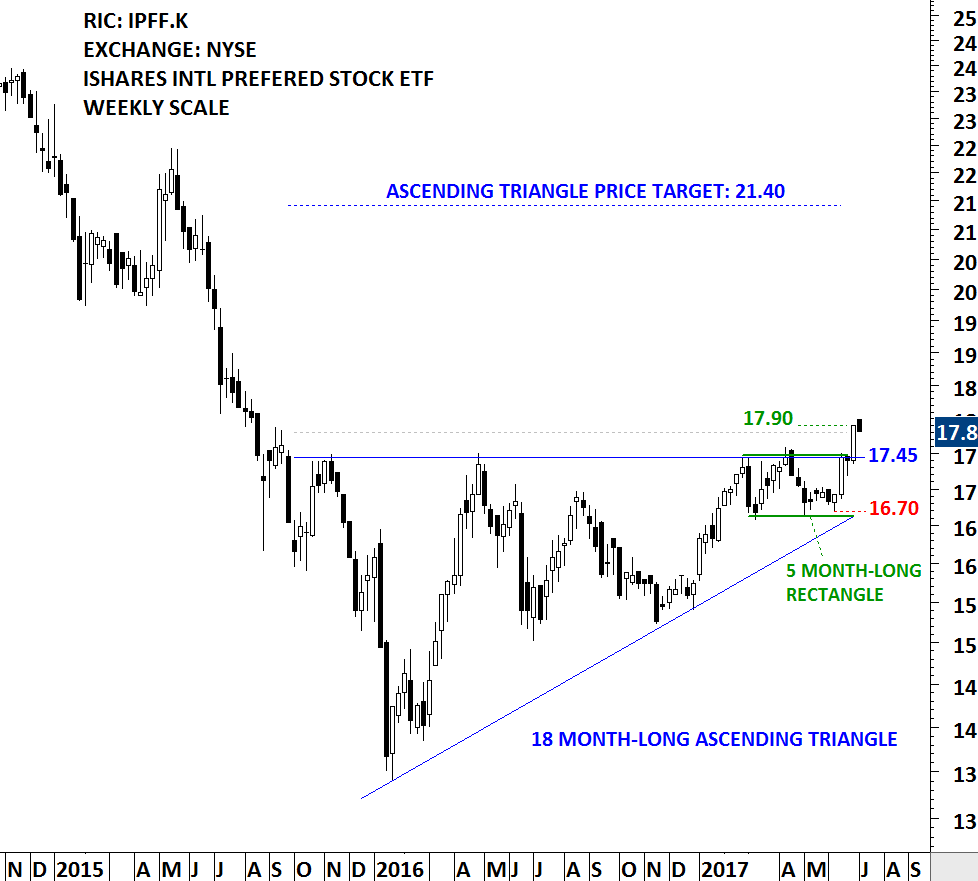
CHINA SSE 5O INDEX

Chinese equities might be on the verge of a strong breakout. This week’s price action pushed the SSE 50 Index to the horizontal resistance at 2,225 levels. Since the beginning of 2016, SSE 50 has been recording higher lows, a bullish signal. Another week of strong price action can clear the 8 month-long resistance and push the index towards 2,500 levels. Volatility is low both on the daily and weekly charts suggesting a trend period might develop after a decisive breakout.

CHINA SSE 50 INDEX W

CHINA SSE 50 INDEX D

There are several bullish chart set-ups in Hong Kong listed securities. I share below some of the clear chart patterns that are likely to resolve on the upside if we see a breakout on the Chinese benchmark equity index.

MGM CHINA

MGM CHINA formed a year-long H&S bottom, a bullish reversal chart pattern, with the neckline standing at 12.20 levels. Breakout above 12.20 can push the stock higher to test 17-18 area.

TONGDA GROUP

TONGDA GROUP formed a year-long ascending triangle, a bullish continuation chart pattern, with the strong horizontal resistance standing at 1.69. Breakout above 1.69 can push prices towards 2.0 levels.

PING AN

PING AN is now testing the horizontal resistance at 38.80. Stock closed slightly above the resistance. However, this week’s price action will confirm the breakout. Another strong weekly close will complete the multi-month base formation.

Note: According to Edwards and Magee, a daily close above the resistance by a 3% margin is required to confirm a breakout. I follow this approach to confirm a breakout.

BASIC MATERIALS and ENERGY

In the first few months of 2016, strong performance in Gold and Silver resulted in a sharp rally in precious metal stocks. Several oversold gold and silver mining companies had strong performance over the past few months. Similar bullish theme can take place in the basic materials and energy complex. Some of the commodities in the industrial metals and energy group are in the process of forming major long-term bottoms. The same bullish chart set ups can also be seen in the equities of basic materials and energy companies.

LIGHT CRUDE OIL SEP FUTURES

WTI LIGHT CRUDE is possibly forming a H&S bottom with the neckline standing at $50 levels. This chart is still at the early stages of a H&S formation. A few more weeks of strength will complete the right shoulder of a year-long base formation.

BLOOMBERG INDUSTRIAL METAL SUB INDEX

Formerly known as Dow Jones-UBS Industrial Metals Subindex Total Return (DJUBINTR), the index is a commodity group subindex of the Bloomberg CITR. The index is composed of longer-dated futures contract s on aluminum, copper, nickel and zinc. It reflects the return on fully collateralized futures positions and is quoted in USD. This chart has possibly completed a H&S bottom and currently consolidating above the neckline.

BLOOMBERG ALUMINUM SUB INDEX

Formerly known as Dow Jones-UBS Aluminum Subindex Total Return (DJUBALTR), the index is a single commodity subindex of the Bloomberg CI composed of futures contracts on Aluminum. It reflects the return of underlying commodity futures price movements only and is quoted in USD. The neckline of the year-long base formation stands at 28.20 levels.

NMDC LIMITED

NMDC Limited is an India-based company engaged in the mining of iron ore. The Company’s business segments include Iron Ore and Other minerals & services. The Company is also engaged in the exploration of various minerals, including copper, rock phosphate, lime stone, dolomite, gypsum, bentonite, magnesite, diamond, tin, tungsten, graphite and beach sands. A perfect horizontal resistance (neckline) stands at 105 levels. Breakout above this level will complete a year-long base formation.

FREEPORTMCMORAN

Freeport-McMoRan Inc. (FCX) is a natural resource company with a portfolio of mineral assets, and oil and natural gas resources. The Company’s segments include the Morenci, Cerro Verde, Grasberg and Tenke Fungurume copper mines, the Rod & Refining operations and the U.S. Oil & Gas Operations. It has organized its operations into five primary divisions: North America copper mines, South America mining, Indonesia mining, Africa mining and Molybdenum mines. This is another perfect example of a year-long H&S bottom with the neckline standing at 14.20 levels. Breakout above 14.20 will be bullish and possibly target 25 levels.

TECHNIP

Technip SA (Technip) is engaged in project management, engineering and construction for the energy sector. The Company operates through two segments: Subsea, Onshore/Offshore and Corporate. This stock is listed in France. Over the past year, 53 levels acted as strong resistance. Stock might be completing a year-long base.

WACKER CHEMIE

Wacker Chemie AG is a Germany-based company engaged in chemical industry. The Company operates through four business segments: WACKER SILICONES, which produces silicone products, ranging from silanes through silicone fluids, emulsions, elastomers, sealants and resins to pyrogenic silicas; WACKER POLYMERS, which offers a range of polymeric binders and additives; WACKER POLYSILICON, which provides polysilicon, and WACKER BIOSOLUTIONS, which is the life science division of the Company, offers solutions and products for the food, pharmaceutical and agrochemical industries. While this base formation does not have the perfect symmetry between the left and right shoulders, it is clear from the chart that the horizontal resistance at 86 levels will be critical in the coming weeks. Breakout above 86 will be bullish.


TURKEY BIST 100

Turkish equities are at critical support levels from where they can see a possible turnaround. We are talking about a country and financial markets that experienced a failed coup, an S&P downgrade and a recently declared state of emergency. Yet the magnitude of the correction is less than what BIST 100 experienced after the Gezi Park protests in 2013 and much smaller in magnitude when compared with the banking crises in 2000-2003 and the global financial melt-down in 2007-2008. Is it possible to say the worst is over?

TURKEY BIST 100 W

Long-term chart of the BIST 100 index shows the multi-year long uptrend being tested between 70K-72K area. This is also the lower boundary of a larger scale sideways correction which I label it as a symmetrical triangle.

TURKEY BIST 100 D

Daily chart shows the 3 year-long sideways consolidation. After the recent sell-off the BIST 100 index is now very close to strong support area between 70K and 72K. Unless we see a breakdown below the strong support area, we will expect a rebound and a possible reversal.

MSCI TURKEY VS MSCI EM

MSCI Turkey has underperformed MSCI Emerging Markets index. Though, the ratio between MSCI TURKEY and MSCI EM is now at a major support level. This ratio is indexed to 1 with the base year being 2016. Since the beginning of the year, including the latest sell-off the ratio stands at 0.92. This is 8% underperformance versus the MSCI EM. More important than the numbers, I think the level of the ratio suggests a possible reversal. Unless there is a breakdown below 0.90-0.94 area, being long Turkey versus MSCI EM at this inflection point could be a low risk trade.

BIST 100 INDEX

IND VS BIST

Corrections led by a financial/economic cause has been deeper and more lengthy when compared with corrections led by political turmoil. Recent data from 1996 till today supports this conclusion. 2000-2003 was the banking crisis in Turkey. 2007-2008 was the global financial melt-down. Both has been the major corrective periods on BIST 100 index. 2011-2012 was related to the global recession fears and the global equity corrections. Since 2013, BIST 100 is in a sideways consolidation.

During each corrective period, Industrials outperformed the BIST 100 index. In other words Financials have under-performed. Risk on trade for Turkish equities have always been buying the financials. Industrials have been a defensive play. The ratio between Industrial Index and BIST 100 reached 2003 levels. If there is a turnaround (a market reversal), you should keep an eye on the performance of financials in the coming weeks. This ratio should also reverse from 2003 levels.

Several charts above suggests equity markets in Turkey are at a major turning point. If we see stability at these levels I’ll weigh going long Turkey.

MEXICO IPC INDEX

A strong breakout is likely to take place on Mexico’s IPC Index. Last week’s price action breached multi-year horizontal resistance at 46,500 levels. The horizontal resistance was tested for 5 times over the past four years. Another week of strong price action will confirm the breakout on the local price index and will suggest higher levels in the coming months. It is important to note that both on weekly and monthly scale the index is going through low volatility period. Usually breakouts from such technical condition result in prolonged up/down trends depending on the direction of the breakout.

MEXICO IPC INDEX W

MEXICO IPC INDEX D

U.S. DOLLAR/TURKISH LIRA

U.S. Dollar continues to appreciate against the Turkish Lira. Over the past three years strong uptrend pushed the cross rate from 1.8 levels to 3 levels. Long-term charts suggest the uptrend can resume in the coming weeks after a year-long sideways consolidation.

USD/TRY is possibly forming a symmetrical triangle, usually regarded as a continuation chart pattern. Price is now trading between 2.8 and 3.0 levels. Breakout above 3.0 levels will complete the chart pattern and possibly target 3.2-3.3 area. Strong support remains at 2.8 levels. If there is a decisive breakdown below 2.8 levels, symmetrical triangle will serve as a major trend reversal. In that case there will be enough evidence to favor stronger Turkish Lira.

USDTRY WEEKLY

In both cases a decisive breakout is required to confirm the completion of the year-long sideways price action.

On the daily chart price formed a possible H&S continuation, increasing the likelihood of an upward break. It is clear from both daily and weekly charts that 3.0-3.05 area is very critical for USD/TRY in the following weeks.

USDTRY DAILY

MEXICO IPC INDEX

Mexico IPC index is possibly preparing for a strong breakout to all-time high levels. Over the past three years, the IPC index tested the strong horizontal resistance for the 5th time. Since the beginning of April, price held close to the upper boundary. Last two months sideways consolidation can be a symmetrical triangle and a preparation for a breakout above 46,500 levels. 46,000-46,500 will act as strong resistance in the following weeks. A decisive weekly close above the resistance area can launch a multi-month uptrend for Mexico’s IPC index. Breakdown below 44,500 can result in a lengthy consolidation.

MEXICO IPC INDEX WEEKLY SCALE PRICE CHART

MEXICO IPC INDEX WEEKLY SCALE PRICE CHART

MEXICO IPC INDEX DAILY SCALE PRICE CHART

MEXICO IPC INDEX DAILY SCALE PRICE CHART


U.S. DOLLAR/CHINESE YUAN

Once again emerging market currencies started weakening against the U.S. Dollar. Earlier update analyzed the Turkish Lira, South African Rand and Mexican Peso.  In this blog post I review the existing uptrend on USD/CNY.

U.S. Dollar/Chinese Yuan is reversing from a critical support level. Since the second half of 2015, USD/CNY has been recording higher highs and higher lows. First, a breakout above 6.26 followed by another strong breakout above 6.448, clearly established the strong dollar weak yuan trend. Last 4 months price action was possibly a pullback to the previously broken resistance at 6.448 and it might be over. Reversal from strong support area can be followed by another upward spike towards 6.65-6.70 area.

Weekly scale price chart of USD/CNY

Weekly scale price chart of USD/CNY

The daily scale chart shows the breakout from the last 4 months downward trend channel. As long as the USD/CNY remains above 6.45-6.50 area, strong USD weak CNY trend will remain intact in the second half of the year.

Daily scale price chart of USD/CNY

Daily scale price chart of USD/CNY

EURO STOXX 50 INDEX

Euro Stoxx 50 index is either offering a rare buying opportunity similar to 2011 or one last chance for the bulls to exit before the downtrend resumes.

The bearish case suggests that the Euro Stoxx 50 index peaked in April 2015 after completing a 2 year-long head and shoulder top which was followed by the breakdown of the multi-year uptrend (2009-2015). According to this outlook, last few months price action is a pullback to the broken trend line. Pullbacks are usually followed by the continuation of the dominant trend.

STOXX 50 I

Weekly scale chart showing the bearish case

The bullish case suggests that the Euro Stoxx 50 index completed a 2 year-long head and shoulder top but found support at the lower boundary of a long-term trend channel. According to this outlook, last few months price action is a consolidation above trend line support (lower boundary of possible trend channel). Once the index completes the consolidation it can reverse and trend higher.

STOXX 50 II

Weekly scale chart showing the bullish case

Daily scale chart shows the last 3 months consolidation between 2550 and 2900. For the bullish case I will be looking for a breakout above 2900 levels. For the bearish case, a breakdown below 2550-2650 area will signal lower prices for the coming months.

STOXX 50 III

TRY, ZAR and MXN

This could be a critical day for most of the emerging market currencies against the U.S. dollar. USD/TRY, EUR/TRY, USD/ZAR and USD/MXN are few cross rates worth mentioning in this update.

USD/TRY is possibly completing a rectangle chart pattern. The lower boundary of the year-long consolidation formed support between 2.75 and 2.80. A strong weekly close around 2.85 and above will likely reverse the last couple of months strong TRY trend and result in an upward move towards 3.05 levels.

USDTRY

EUR/TRY is possibly completing a symmetrical triangle. Low volatility on weekly scale suggests a strong trend period for the coming months. Again, a decisive breakout on weekly scale is required to confirm the completion of 7 month-long sideways consolidation. A weekly close above 3.30 levels will breach the resistance with enough margin.

EURTRY

Monthly scale price chart of USD/ZAR shows the importance of 13.80-14.15 area. 13.80 was the historical high that was broken on the upside. 14.15 is the 1 year-long moving average that acted as strong support since the uptrend on USD/ZAR began in 2011. Unless we see a decisive break below 13.80-14.15 area, USD should continue to gain strength against the Rand.

USDZAR

USD/MXN is another emerging market currency that found support at the 200 day moving average. 17 level was not only the long-term average but also the lower boundary of the possible 2 year-long trend channel. If USD/MXN is reversing from these levels, cross rate should rebound towards 19.5 levels in the following weeks.

USDMXN


SILVER and SOYBEANS

Poor man’s gold might be setting up for a strong performance in the metal complex. SILVER/GOLD ratio is reversing from a historical support area. This level acted as a medium/long-term turning point for the ratio in 1997, 2003 and in 2008. Not only the relative performance of Silver is showing strength but also the price chart of Silver forming a possible base formation. Silver has been outperforming another precious metal that has industrial use; platinum. SILVER/PLATINUM ratio is on the rise with the latest chart development suggestion even more to come. In the metals, silver can be a winner.

SILVER VS GOLD WEEKLY SCALE RATIO

SILVER VS GOLD WEEKLY SCALE RATIO

SILVER VS PLATINUM WEEKLY SCALE RATIO

SILVER VS PLATINUM WEEKLY SCALE RATIO

Over the past year, Silver possibly formed a head and shoulder base with a neckline at 16.35 levels. Breakout above 16.35 will clear multi-year downward trend lines and also the year-long horizontal resistance. Weekly price closed at 16.21 levels.

SILVER

Another long-term opportunity might be developing on Soybeans price chart. Over the past few weeks, Soybeans reversed from an important inflection point. Two long-term trend lines overlapped around 850 levels. Last week’s strong weekly price bar suggests possible strength for the following weeks. Resistance area on the first month continuation chart is around 1070.

WEEKLY SCALE PRICE CHART

WEEKLY SCALE PRICE CHART