INTERIM UPDATE – December 20, 2019
Dear Tech Charts members,
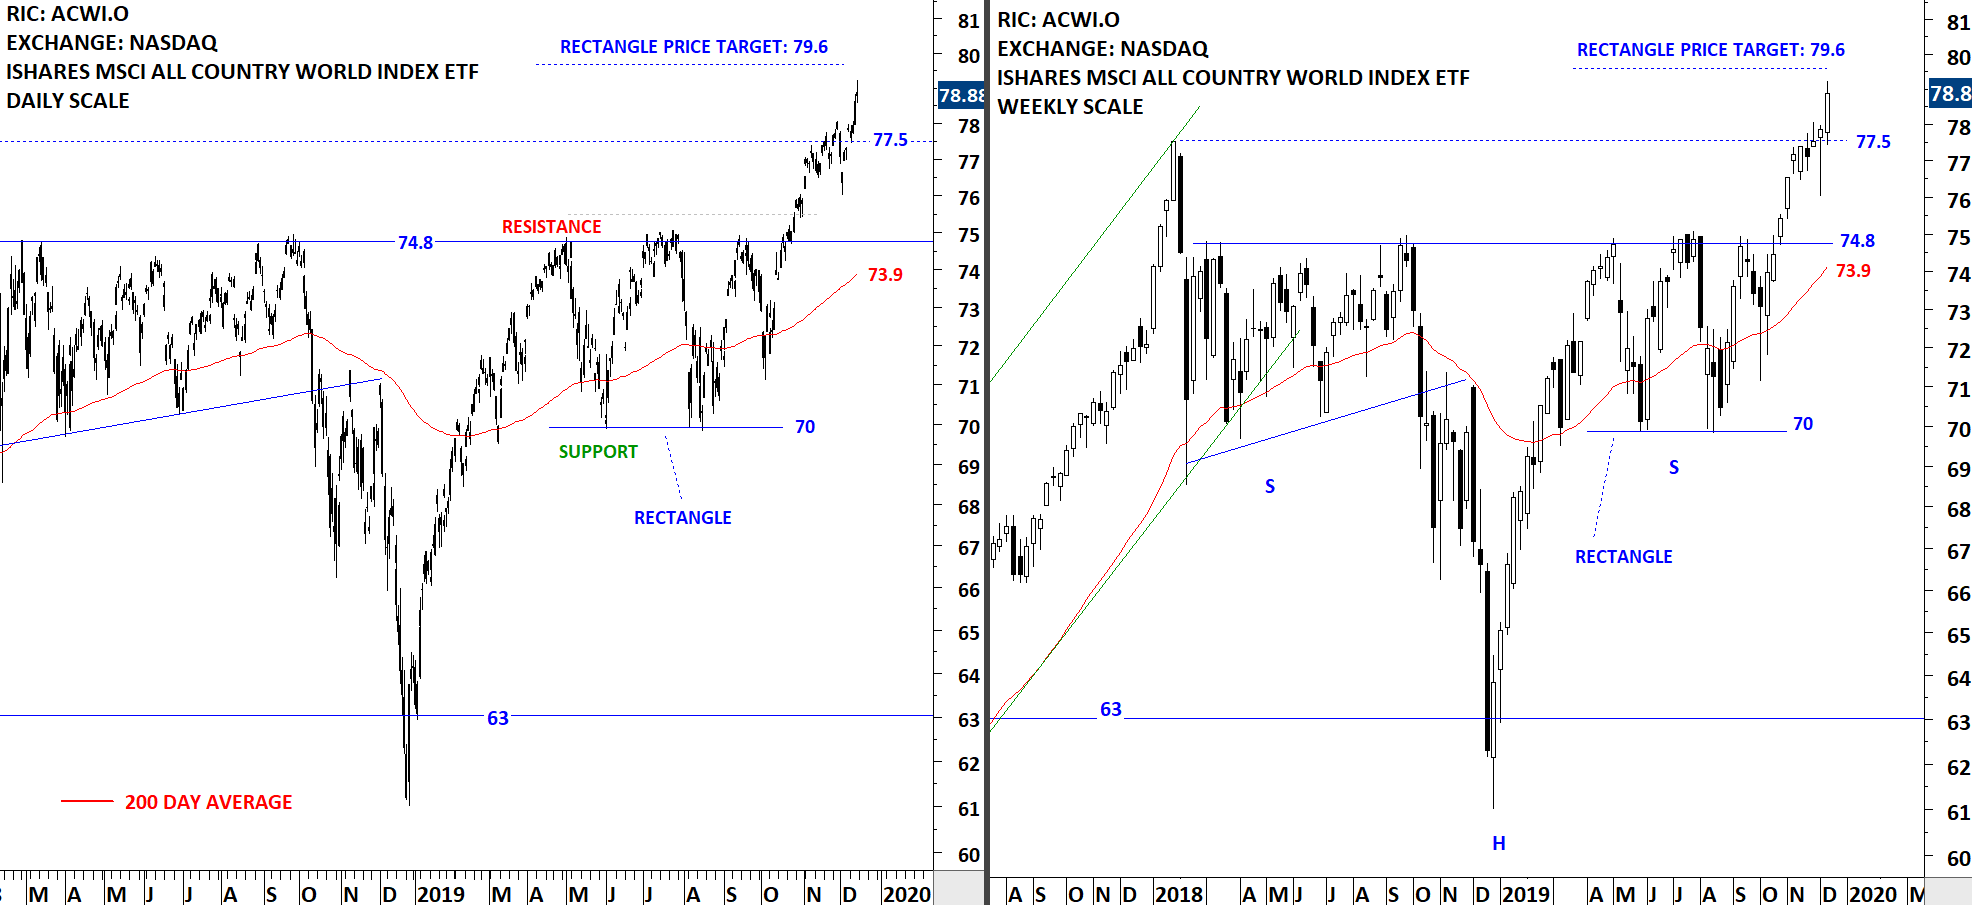
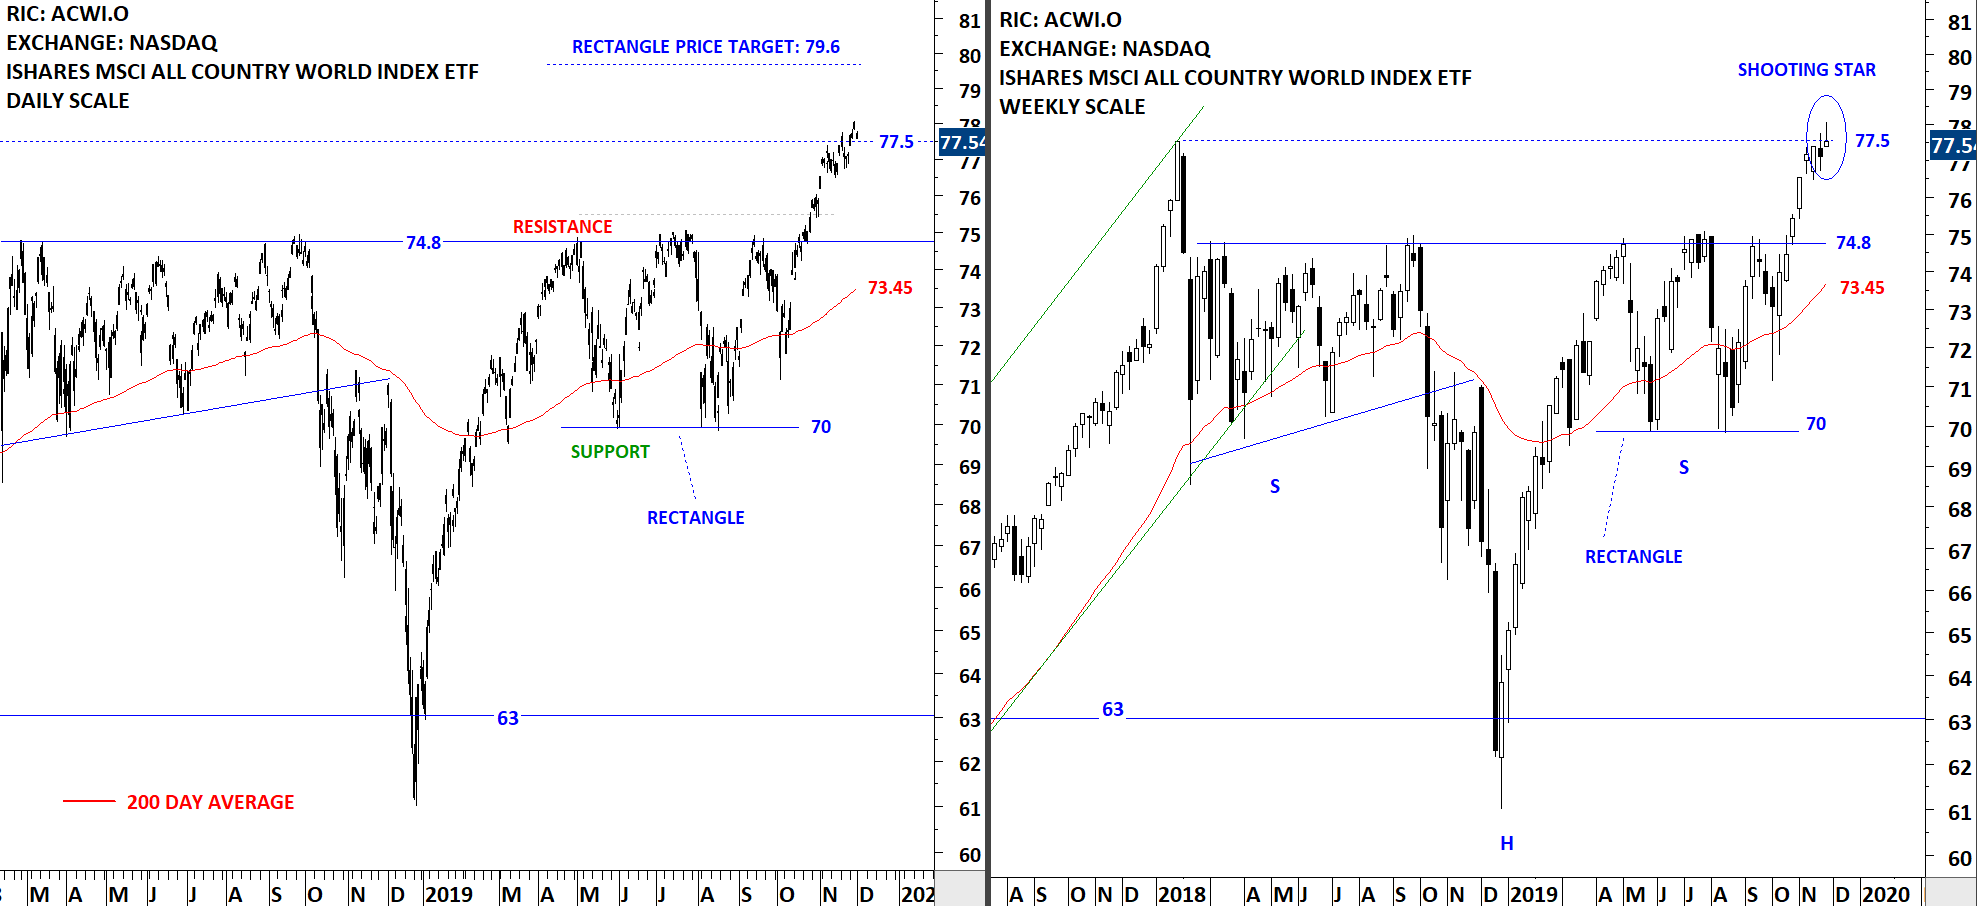
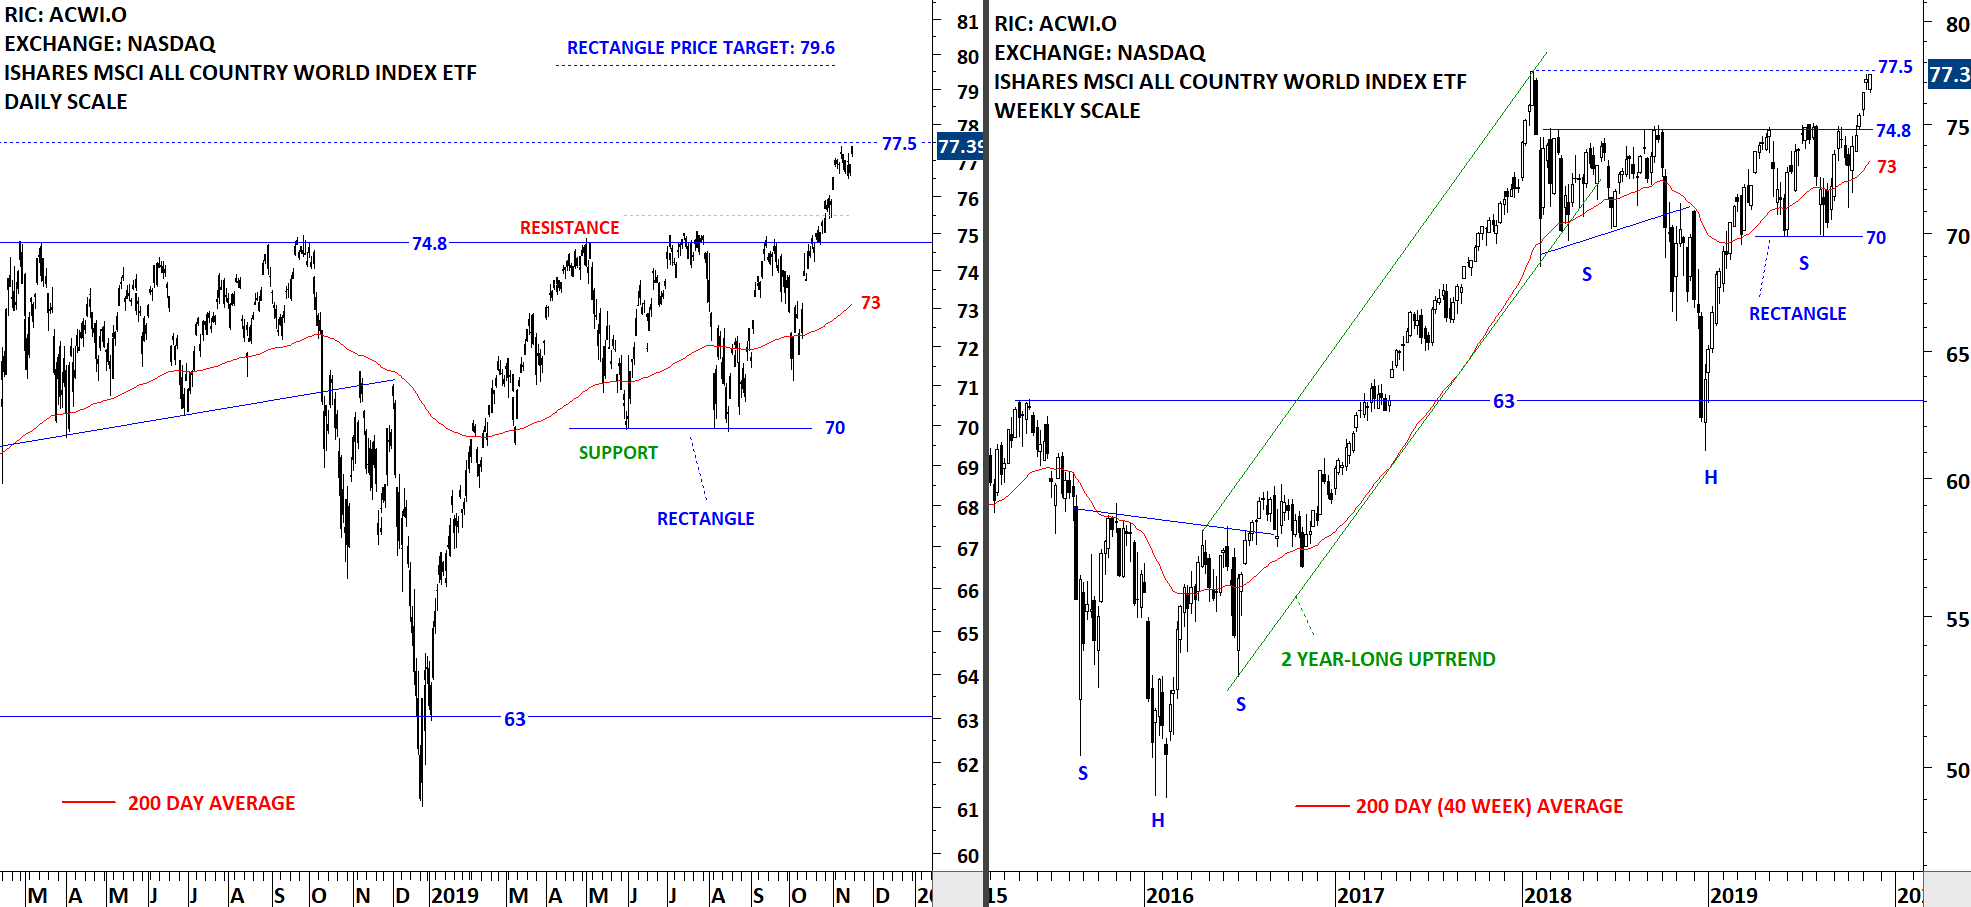
As mentioned in our previous communications I've been working on bringing more short-term chart pattern setups into your attention from the Global equity markets. In doing so I'm paying close attention to have liquid names. Tech Charts Global Equity markets report featured mostly chart pattern in duration between 4 months - 24 months. We are now focusing as well on chart patterns in duration between 2 months - 4 months featured on daily scale. I will continue to bring those opportunities either via Interim Updates or the weekly Global Equity Markets report. Below are 4 additions to Tech Charts watchlist that may experience breakouts in the last trading day of the week. These charts will also be included in the weekly update.
Read More