I want to start this special cryptocurrency report with couple of important points. Chart pattern price targets (especially in cryptocurrency markets) should be used as guidelines only. Price can exceed or fall short of price objective. With upside price projections, I'm taking absolute price change. With downside price projections I'm taking % change (to avoid negative number price targets). Both methods will give us conservative price targets.
There has been several major breakouts in cryptocurrencies, especially in alt space. How can we monetize on those? How can we capture those breakouts. First and foremost, a disciplined approach and a routine review of each and every chart is required to be on top of market movements. If we look, we see. If we know what we are looking for we will see it clearly.
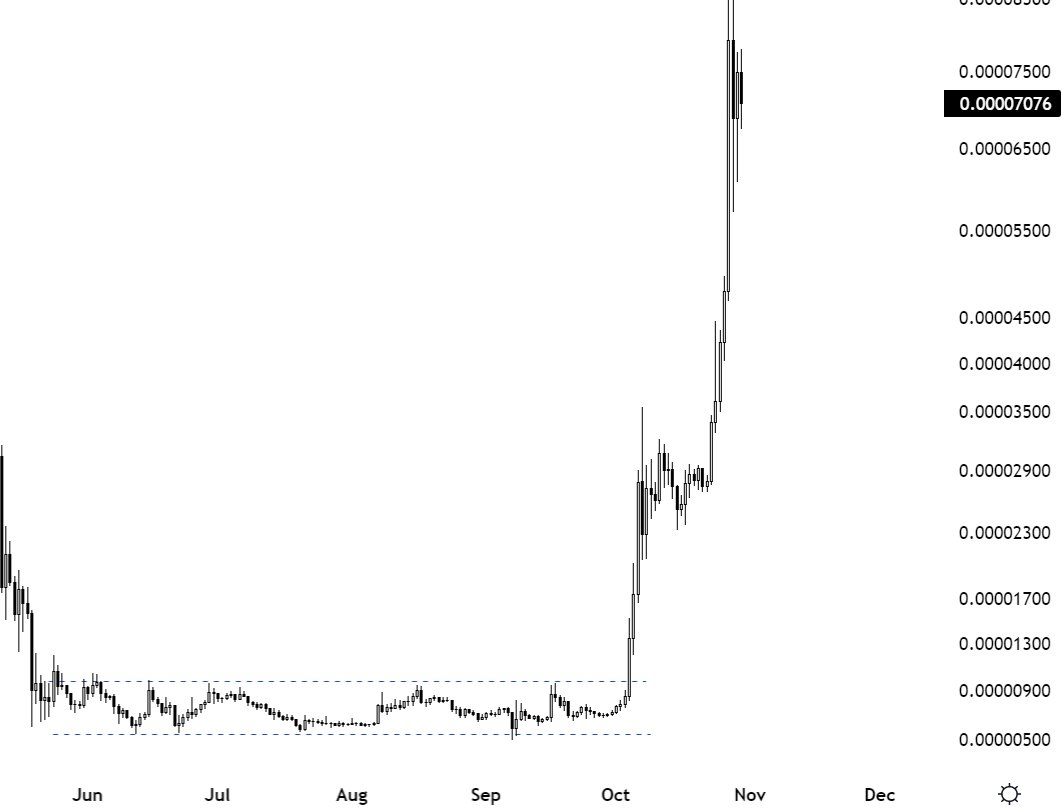
I.e. SHIBA INU/USD had a massive move. This move started from a tight and lengthy, well-defined consolidation range.
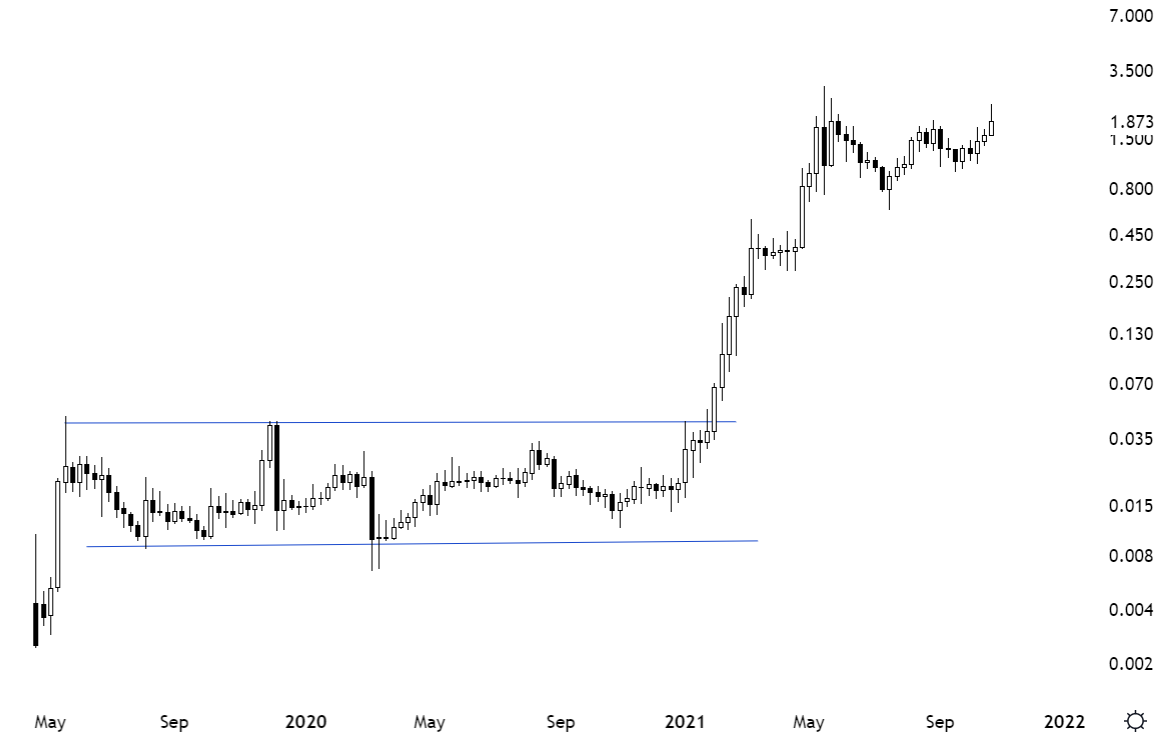
Another great example was MATICUSD. The breakout took place after the pair consolidated in a tight and well-defined range.
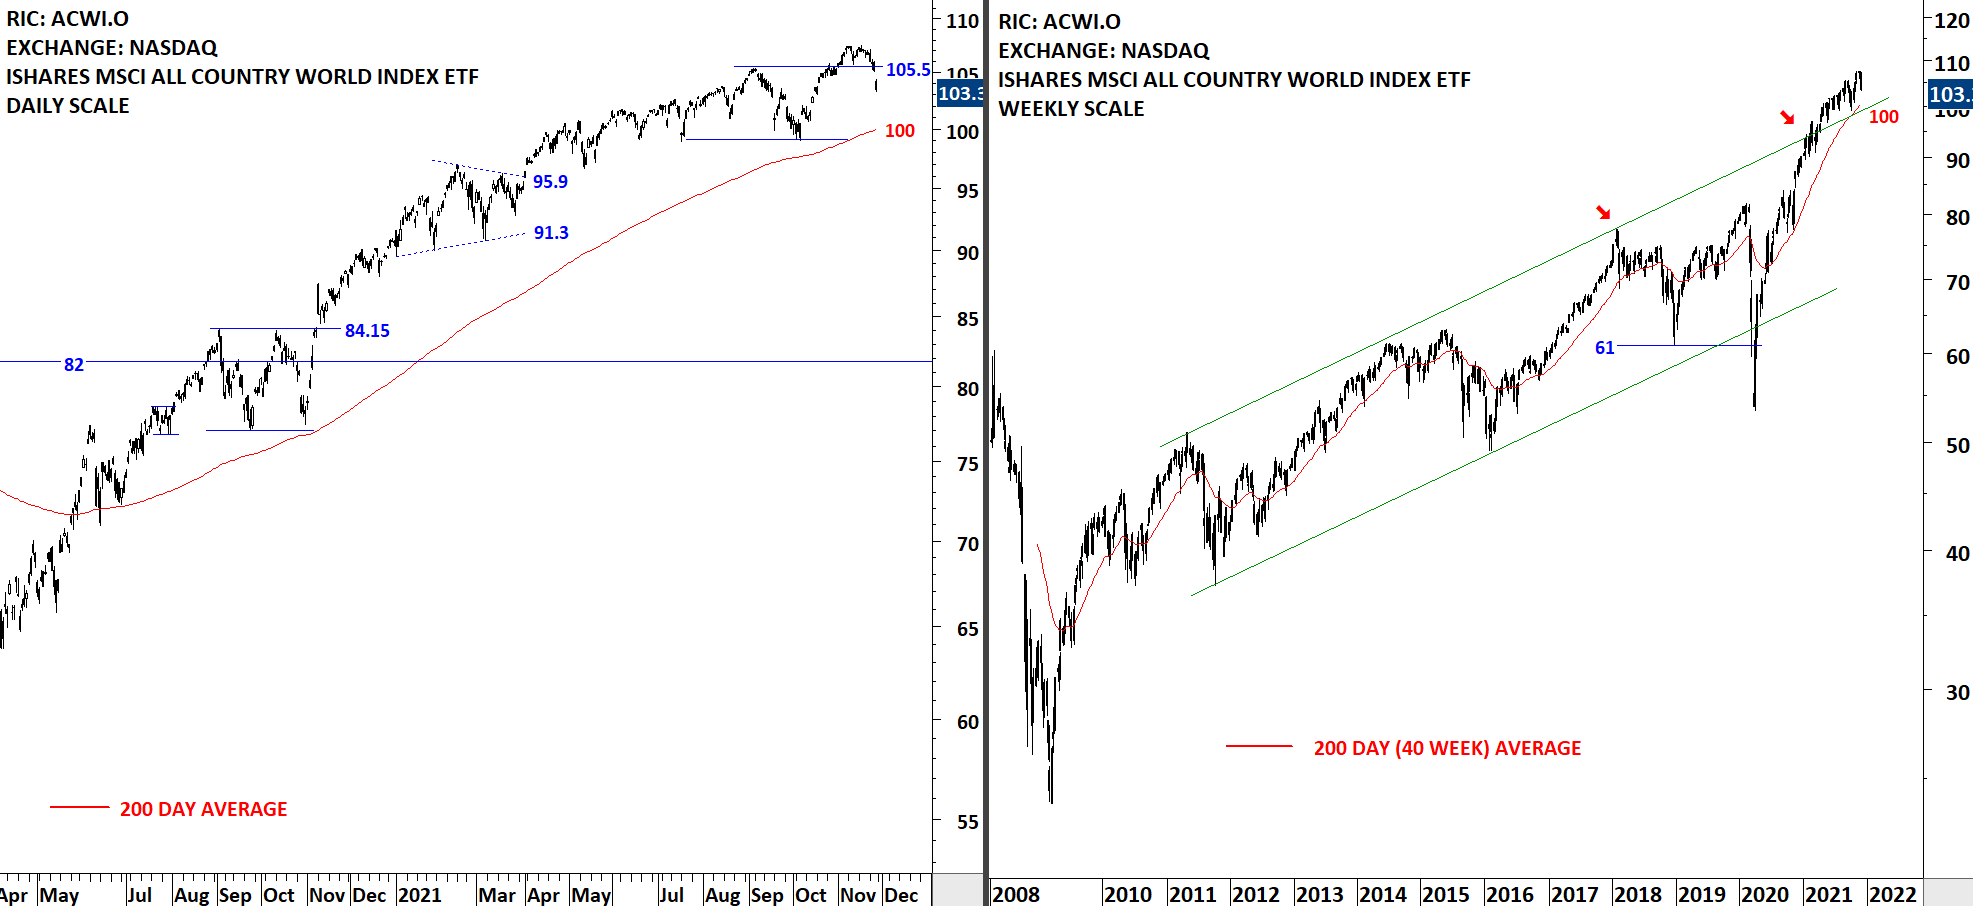
The following chart feature similar tight consolidations and breakout opportunities. Some opportunities are highlighted on daily scale price chart and some are larger scale patterns so weekly scale is utilized. I hope you find these findings valuable. Updates on those opportunities will be issued in following reports.
A quick note on how to trade those breakout opportunities. The daily scale price charts need a daily close above the chart pattern boundary. The weekly scale price charts need a weekly close above the pattern boundary for breakout confirmation. However, if you are thinking that by the time that confirmation candle forms it is usually too late to get on board, an intraday entry can be utilized. Though you need to be prepared for false breakouts in such cases.
Read More

 Read More