GLOBAL EQUITY MARKETS – April 8, 2017
It has been a volatile week in the Global equity markets. There were 2 new breakout alerts. Both stocks cleared strong multi-month horizontal resistances.
#TECHCHARTSALERT
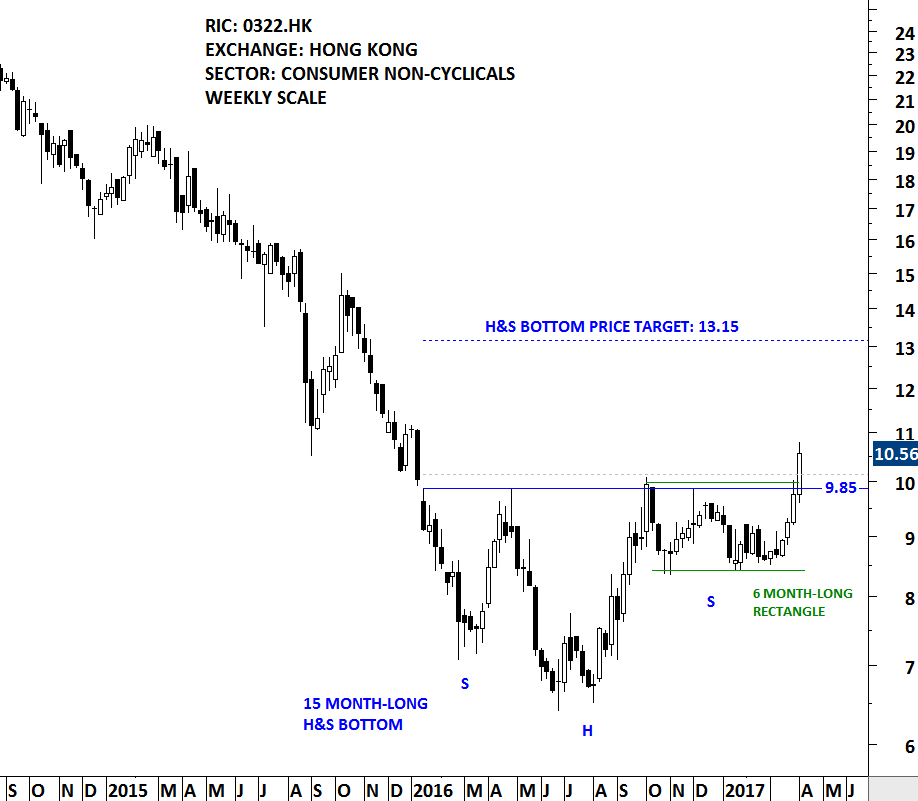
TINGYI CAYMAN ISLANDS HOLDING CORP (0322.HK)
Tingyi (Cayman Islands) Holdings Corp. is a Hong Kong-based investment holding company principally engaged in the production and sales of instant noodles, beverages and instant food products. The stock is listed on the Hong Kong Stock Exchange. Price chart formed a 15 month-long H&S bottom with the right shoulder in the form of a 6 month-long rectangle. The neckline of the H&S bottom standing as a resistance at 9.85 has been tested for 4 times over the past year. The daily close above 10.15 confirmed the breakout from the multi-month base formation. 9.85 levels will now become support. Possible chart pattern price target stands at 13.15 levels.