Posts

MSCI DOMESTIC U.S. REAL ESTATE PRICE INDEX

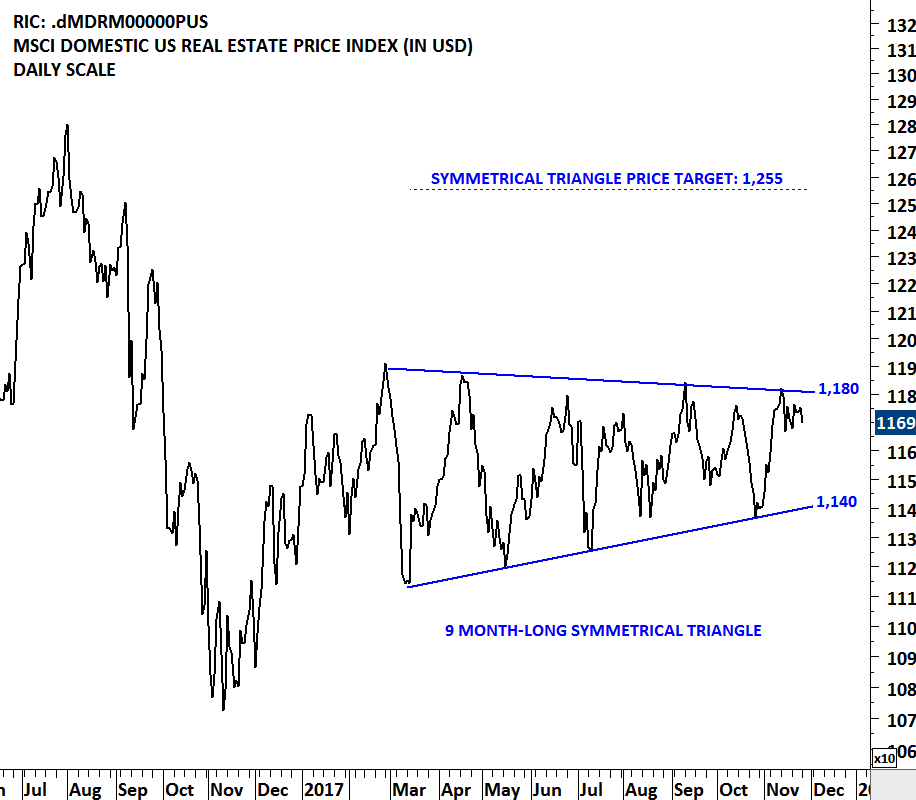
The MSCI Domestic U.S. Real Estate Index and related REIT ETFs are going through a lengthy consolidation. Breakouts from tight and lengthy consolidations are usually followed by strong directional movement. Price index respected the boundaries of the 9 month-long symmetrical triangle. Both boundaries were tested several times over the past months. The upper boundary of the possible symmetrical triangle is acting as resistance at 1,180 levels and the lower boundary as support at 1,140 levels. A decisive breakout above 1,180 levels will confirm the symmetrical triangle as a bullish continuation with a possible chart pattern price target of 1,255 levels.
Read More

GLOBAL EQUITY MARKETS – November 25, 2017

REVIEW


The MSCI Domestic U.S. Real Estate Index and related REIT ETFs are going through a lengthy consolidation. Breakouts from tight and lengthy consolidations are usually followed by strong directional movement. Price index respected the boundaries of the 9 month-long symmetrical triangle. Both boundaries were tested several times over the past months. The upper boundary of the possible symmetrical triangle is acting as resistance at 1,180 levels and the lower boundary as support at 1,140 levels. A decisive breakout above 1,180 levels will confirm the symmetrical triangle as a bullish continuation with a possible chart pattern price target of 1,255 levels. Below you can find related ETFs to take advantage of a possible directional movement on the MSCI Domestic US Real Estate Price Index.

Read More

GLOBAL EQUITY MARKETS – September 9, 2017

REVIEW


I am not sure if Volatility index can be analyzed from a classical charting perspective but over the past few months, the VIX futures and since 2016, the CBOE Volatility Index respected important support/resistance levels. Irrespective of the headlines related to geopolitical tensions, the three different continuation future price charts of the Volatility Index (Oct, Nov, Dec) are showing signs of multi-month bottoming process. The importance of 15-16 area as a resistance can be seen on the Volatility Index and the VIX futures price charts. Last one month's price action arguably formed tight consolidations in the form of a pennant/symmetrical triangle below the important horizontal resistance. I think we should keep a close eye on these charts in the coming weeks. Completion of the month-long tight consolidation range can result in a breakout above the strong resistance area between 15 and 16 levels.

Read More

GLOBAL EQUITY MARKETS – August 26, 2017

REVIEW


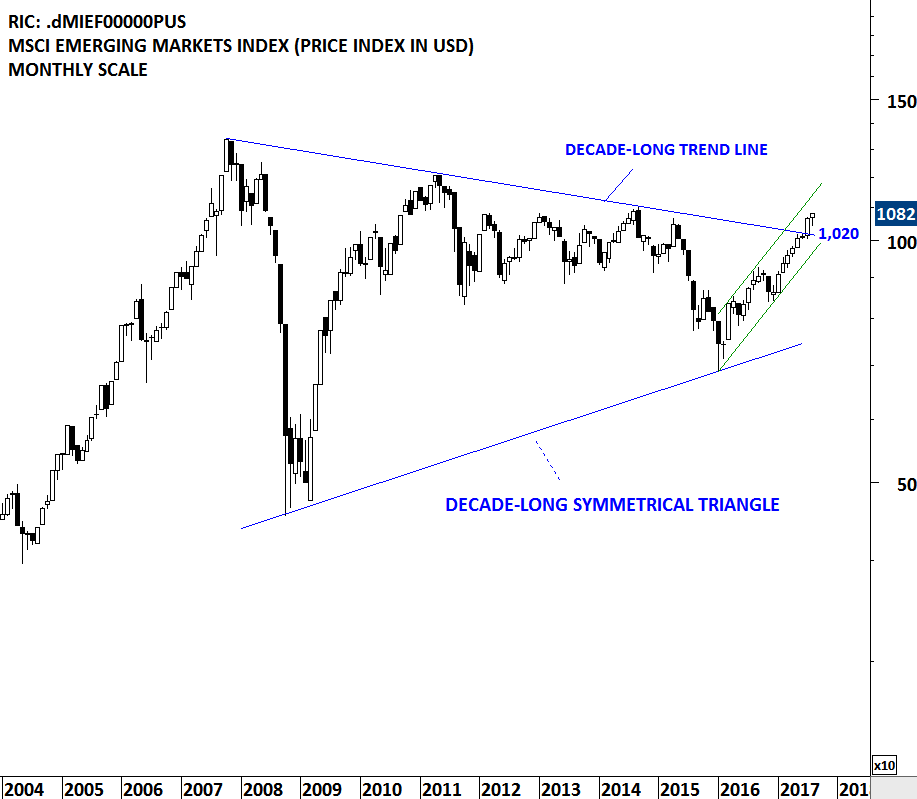
Strong weekly performance of the Chinese SSE Composite Index is worth mentioning in this weeks update. Strength in the Chinese equities helped MSCI Emerging Markets Index to remain resilient during the last few week's of global equity market weakness. MSCI Emerging Markets index that cleared decade-long trend resistance in July, held on to its earlier gains during the month of  August.

Read More

GLOBAL EQUITY MARKETS – August 5, 2017

REVIEW


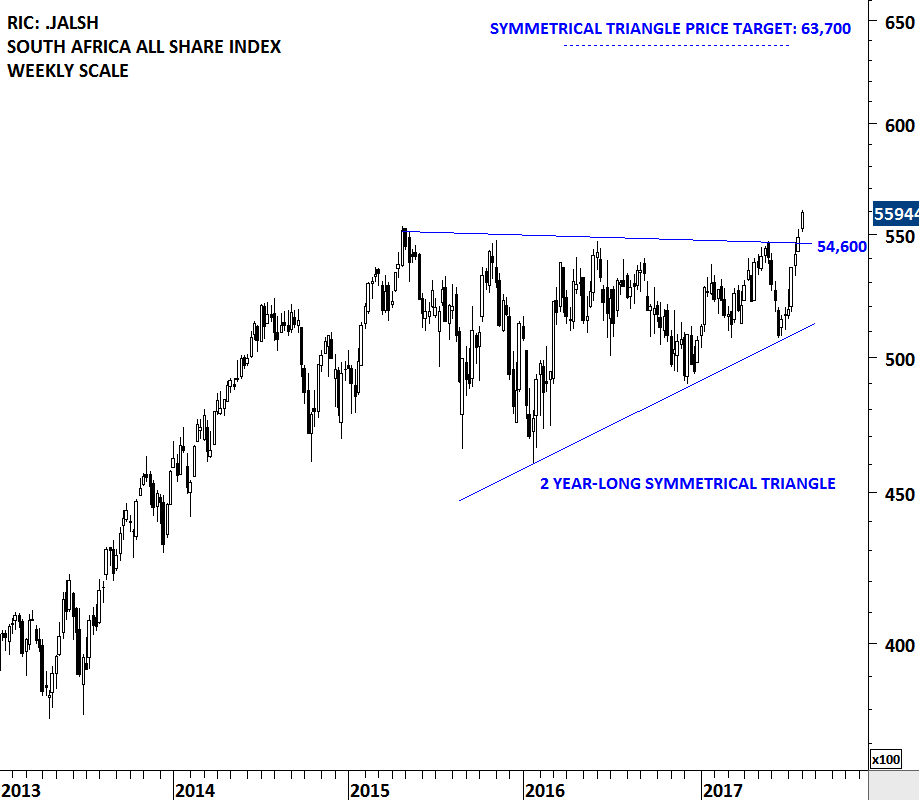
South Africa equities are possibly entering into a strong uptrend with the completion of a 2 year-long sideways consolidation. This week's price action breached the multi-year trend resistance on the South Africa All Share index and pushed the local equity benchmark to all-time highs. Breakouts from multi-year consolidations usually result in multi-month trends. 54,600 levels will remain as strong support. Possible chart pattern price target for the South Africa All Share Index stands at 63,700 levels.

There are several tradable ETFs listed on the local exchange and also on the global exchanges. Below is a chart of South Africa listed ETF.

Read More