Posts

VIETNAM VN INDEX

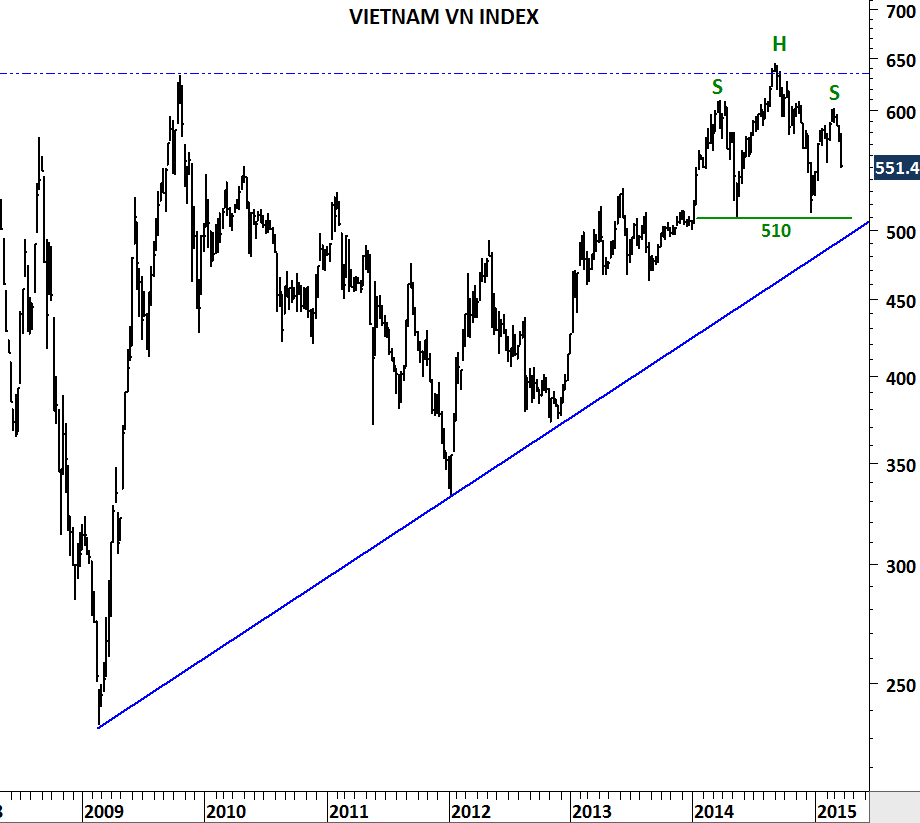
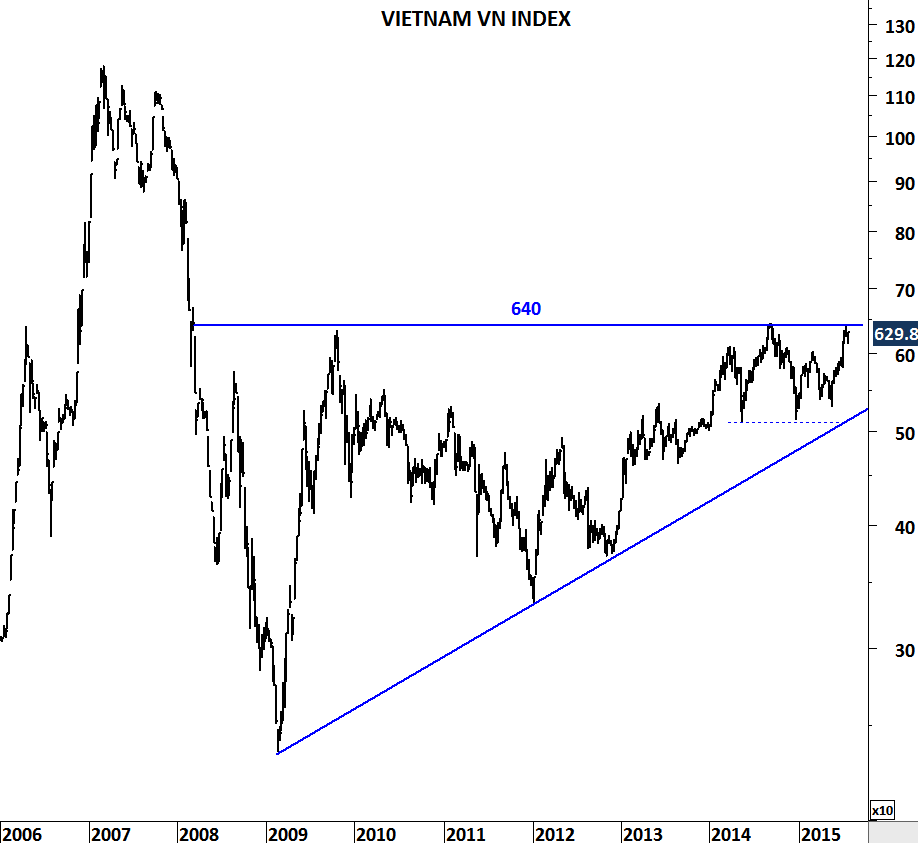
Vietnam equities are showing strength. Massive multi-year base formation may be close to completion. Vietnam’s VN Index is testing 640 levels for the third time since 2009. Breakout above 640 will be very positive and can push the index towards 1,000-1,100 area.

VIETNAM VN INDEX

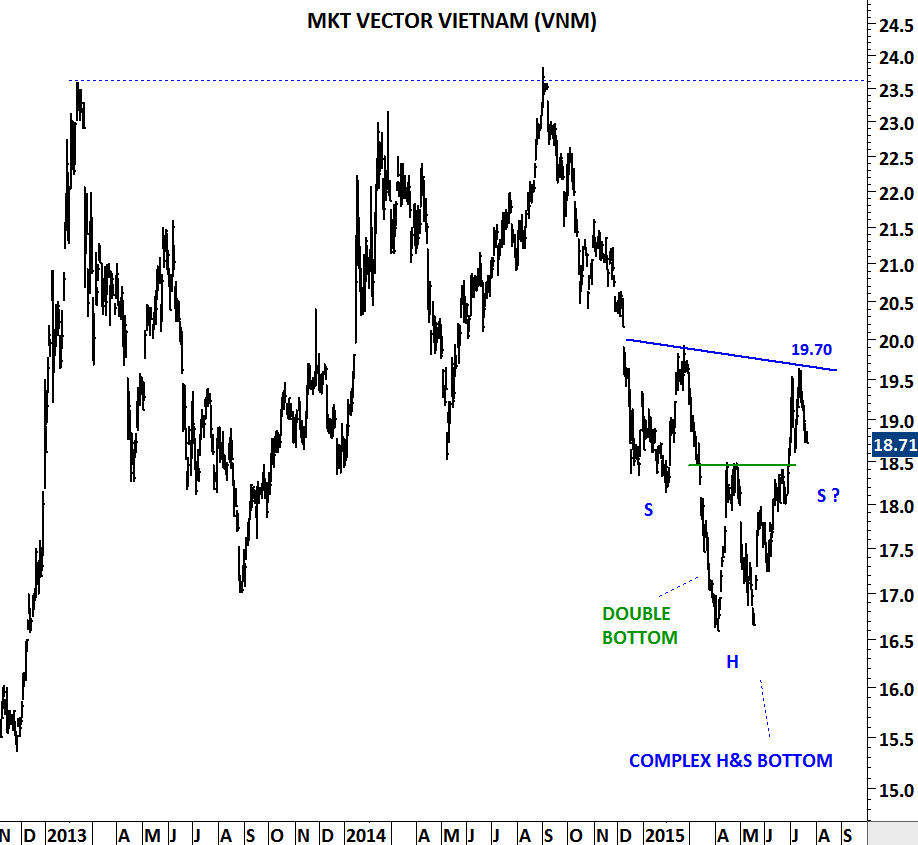
Another form of base formation can be seen on the VIETNAM Market Vector ETF that trades in NYSE (VNM). The ETF is forming a possible complex head and shoulder bottom with the strong resistance at 19.7 levels. Breakout above 19.70 will confirm the H&S bottom on VNM.

Both charts suggest following months and year can be positive for Vietnam equities. 

MKT VECTOR VIETNAM

VIETNAM VN INDEX and QATAR DSM 20 INDEX

In 2014, Qatar has been upgraded to emerging market status with the United Arab Emirates. Vietnam is still in the frontier market universe. Over the past year both indices formed head and shoulder top chart patterns. Head and shoulder is a common reversal chart pattern, that usually forms after a long up/down-trend. Since the beginning of 2009, global equity markets had  strong uptrends. Some of the equity markets are now showing signs of weakness.

Qatar DSM 20 index formed a head and shoulder top with a downward sloping neckline. Downward sloping neckline is usually more negative than a horizontal neckline. Vietnam VN index has a horizontal neckline at 510 levels. Breakdown below the neckline is a confirmation of larger scale correction. For Qatar DSM 20 index breakdown below 10,700-10,920 area will signal further weakness and for Vietnam VN index, a decisive break below 510 levels will confirm the year-long head and shoulder chart pattern.

QATAR DSM 20 INDEX

VIETNAM VN INDEX