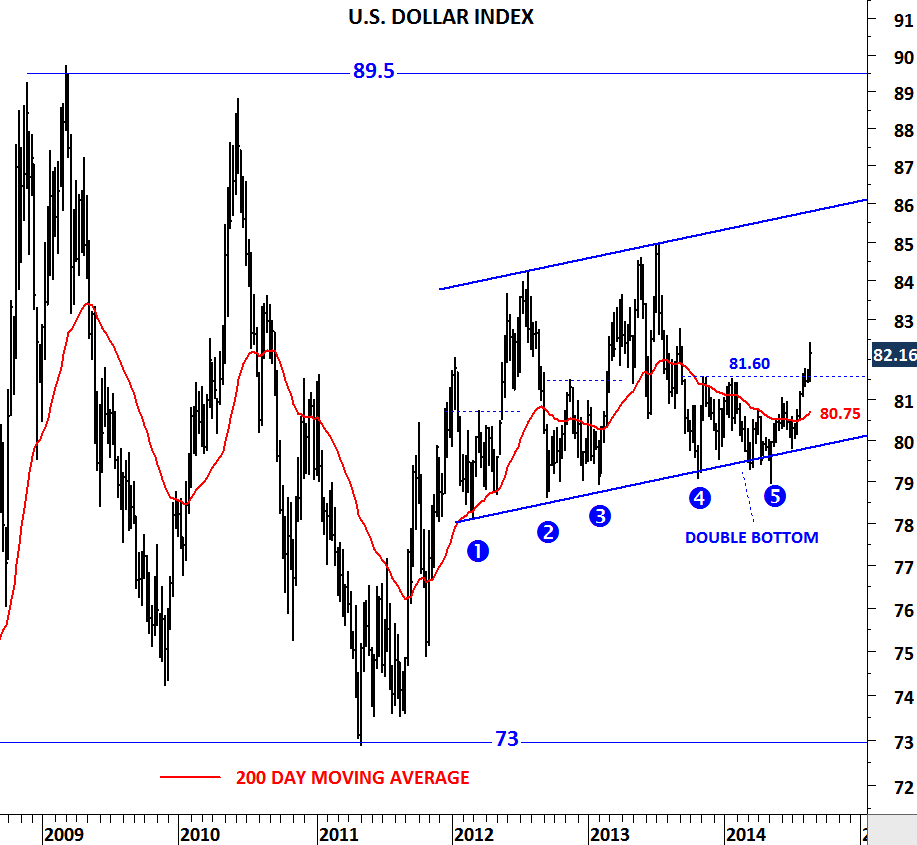
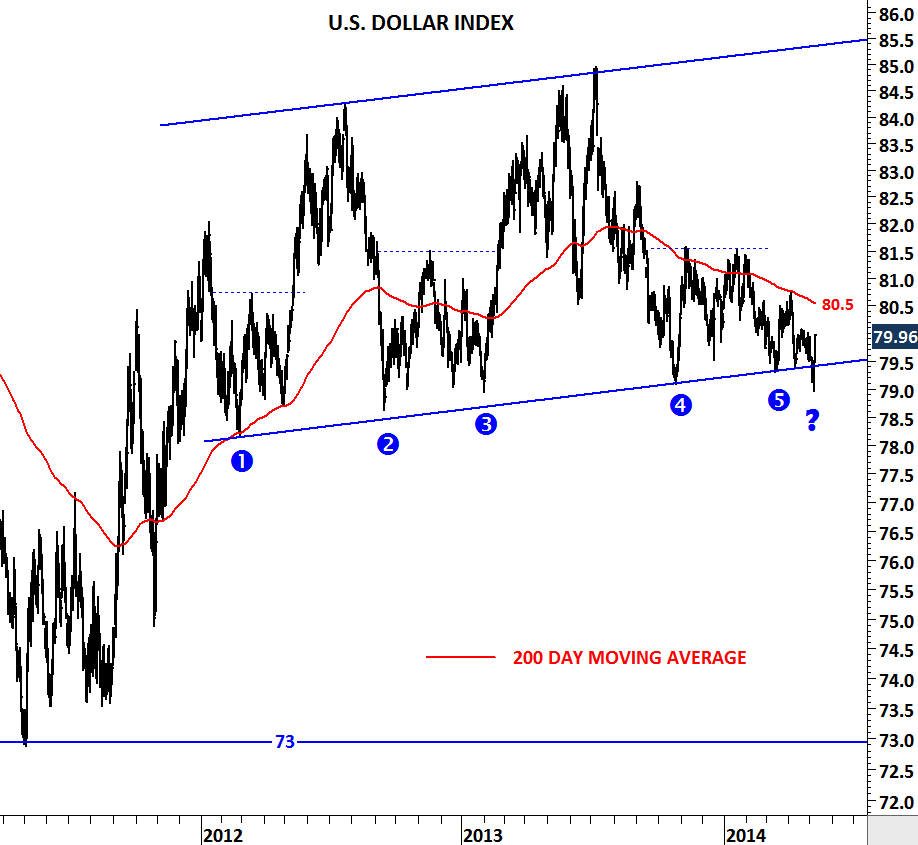
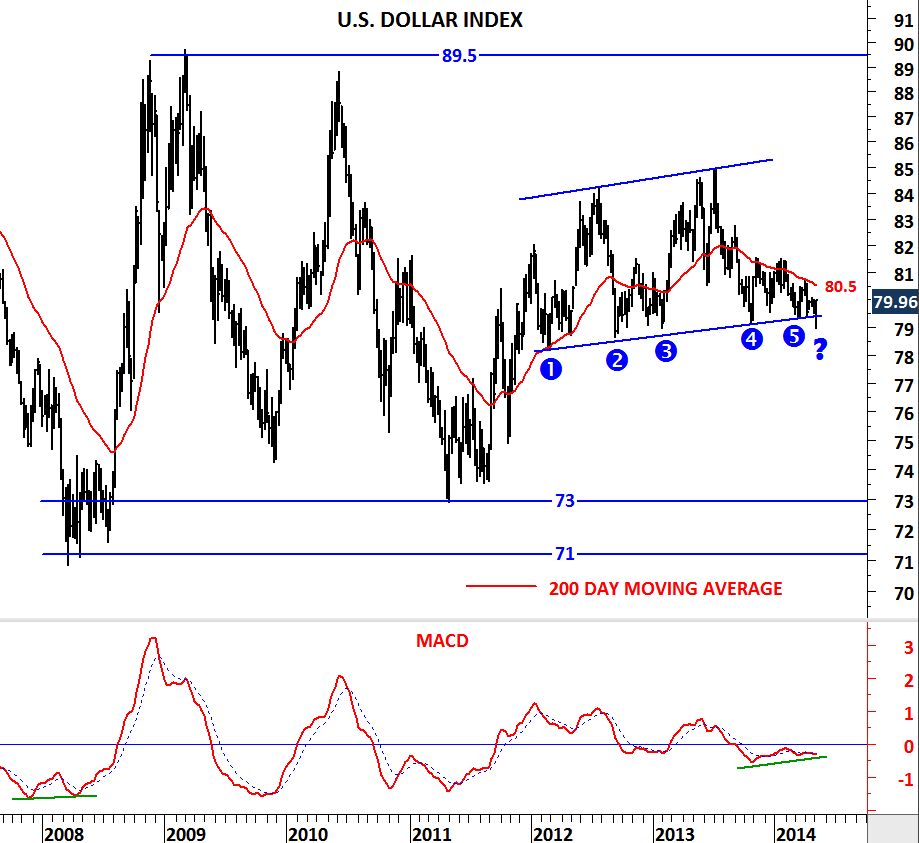
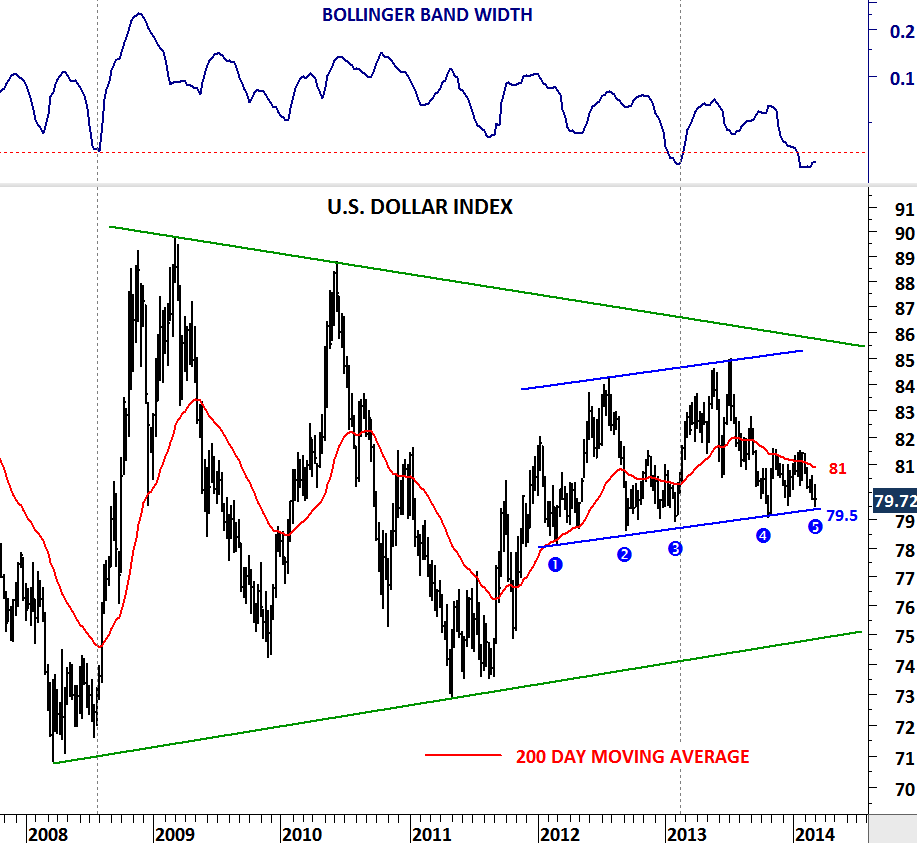
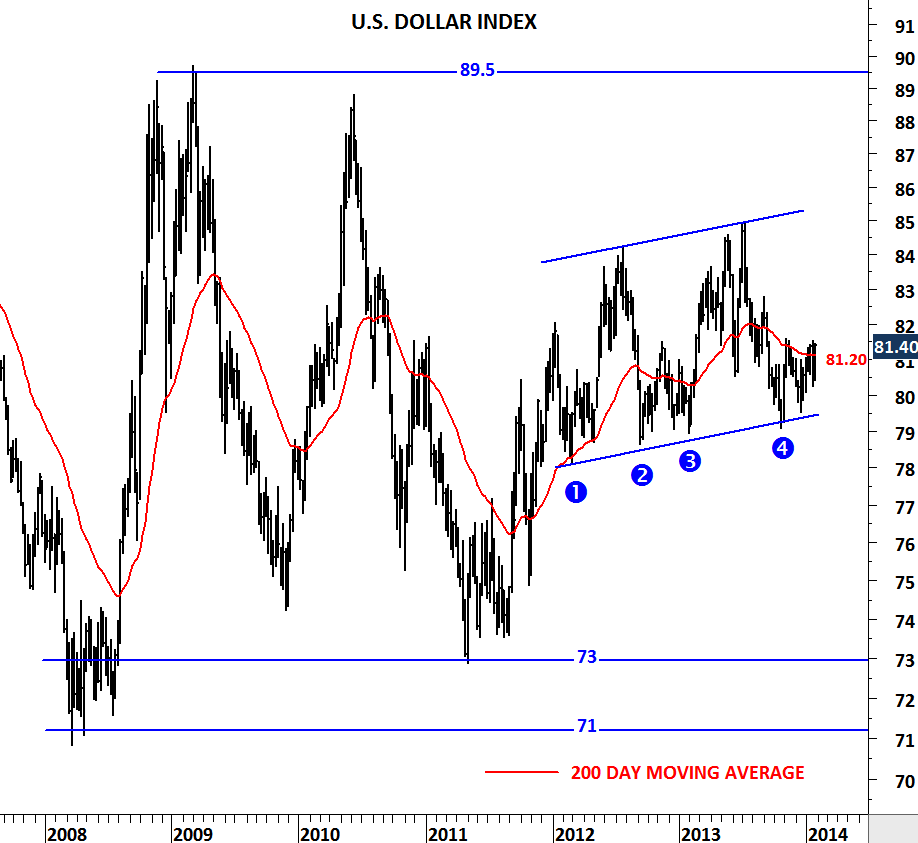
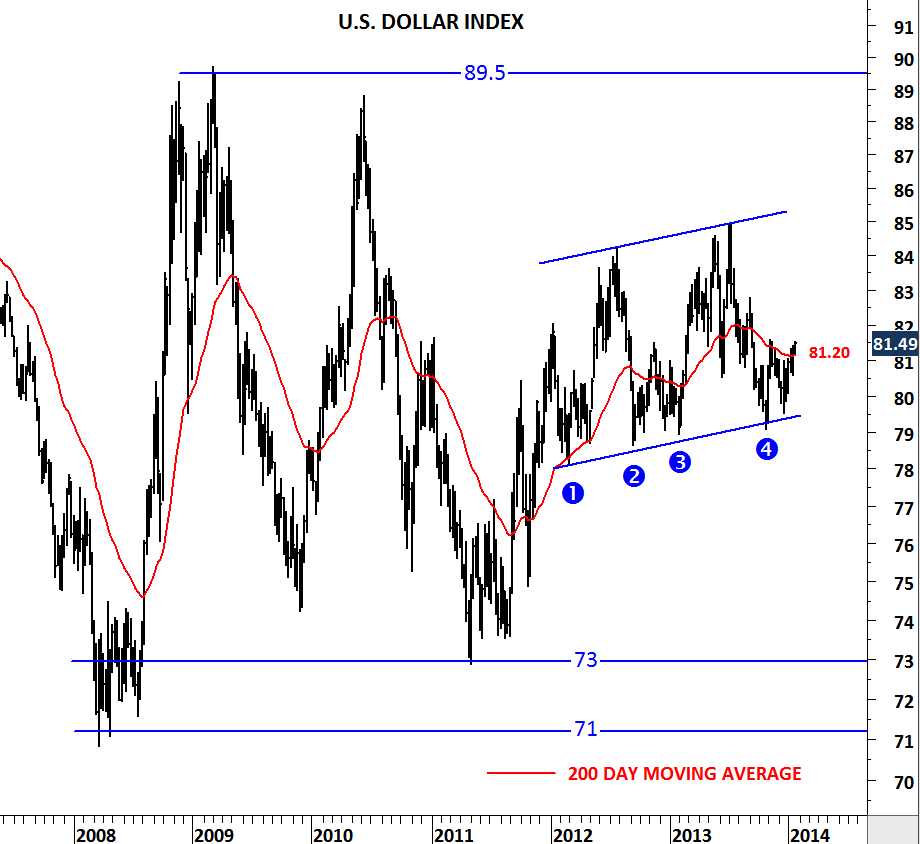
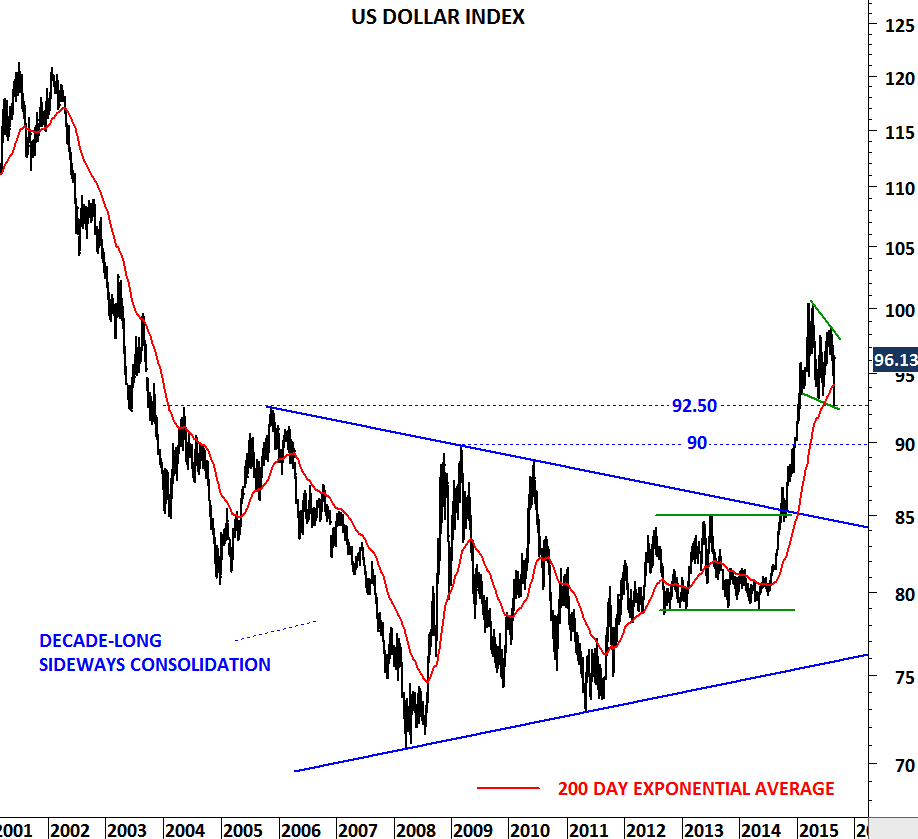
Posts

U.S. DOLLAR INDEX

U.S. dollar strength is here to stay. Greenback had a strong recovery last week. Strong dollar will continue to put pressure on commodities, commodity currencies and also emerging markets. In other words, weak emerging markets, commodities and strong U.S. Dollar trend is likely to continue in the following months.

After its breakout from a decade-long consolidation in the last quarter of 2014, U.S. Dollar index rallied from 85 to 100 levels. Since March 2015, price has been pulling back to the strong support at 92 levels. Last week, the dollar index tested the strong support and rebounded sharply. Latest consolidation is more like a counter trend move in the context of a short/medium-term correction. Uptrend in the U.S. Dollar remains intact and once the choppy sideways consolidation is over we can expect the continuation of the uptrend.

US DOLLAR INDEX

MAJOR U.S. DOLLAR CROSS RATES

EURUSD

USDSGD

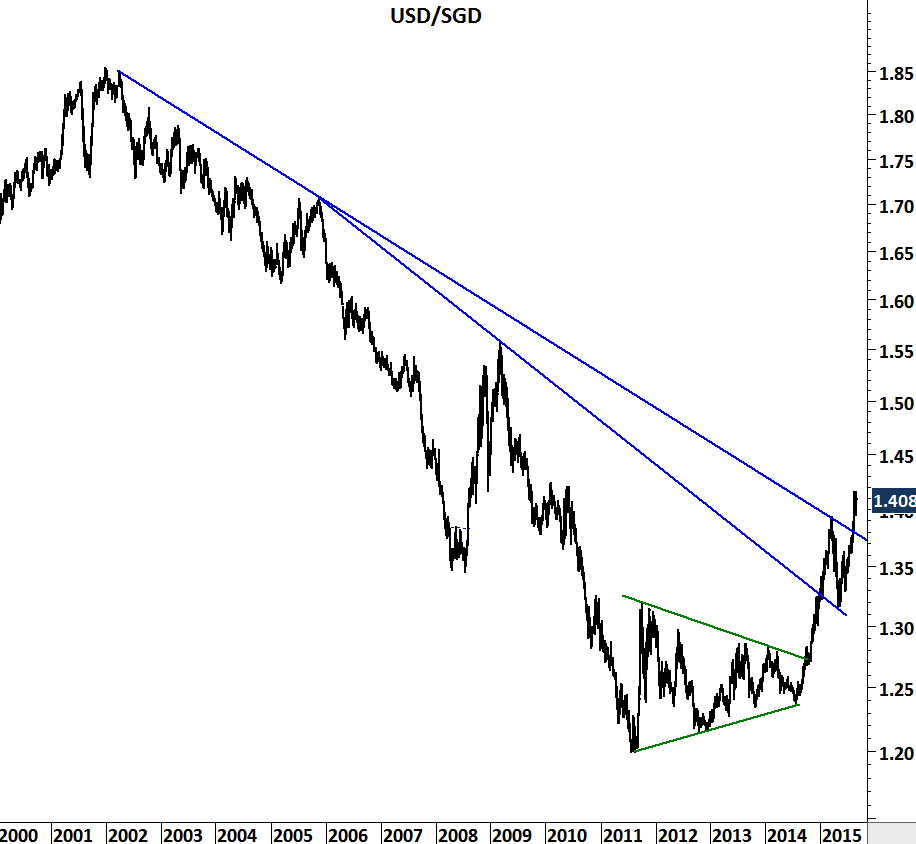
U.S DOLLAR VS. SINGAPORE DOLLAR

USDSEK

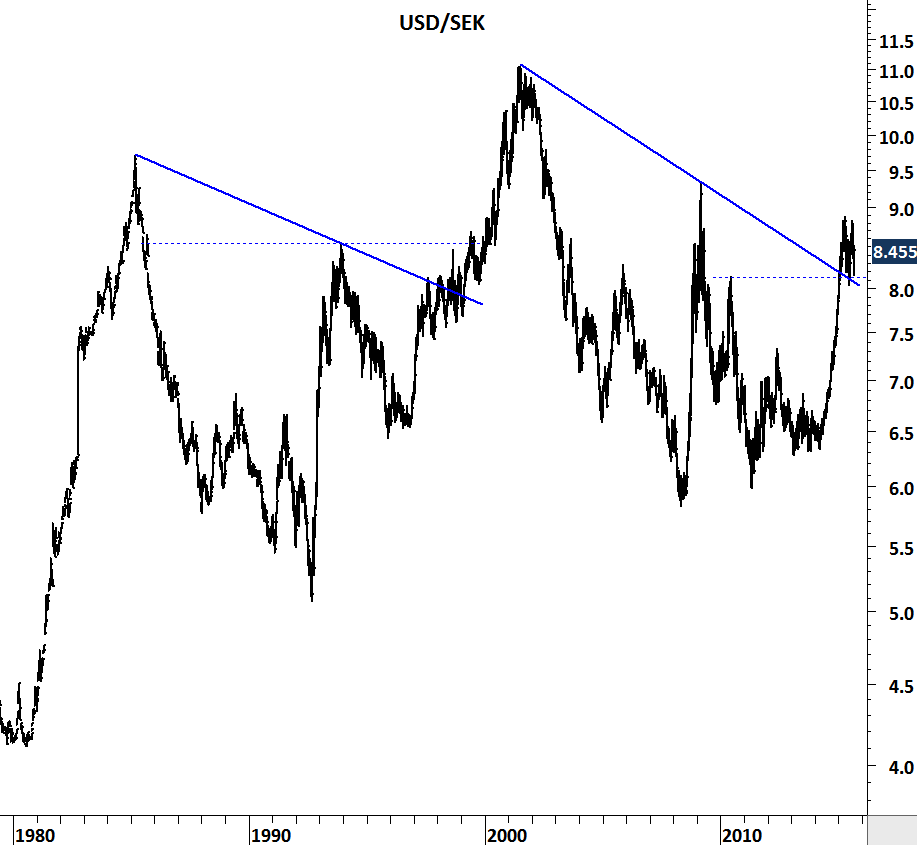
U.S. DOLLAR VS. SWEDISH KRONA

USDNOK

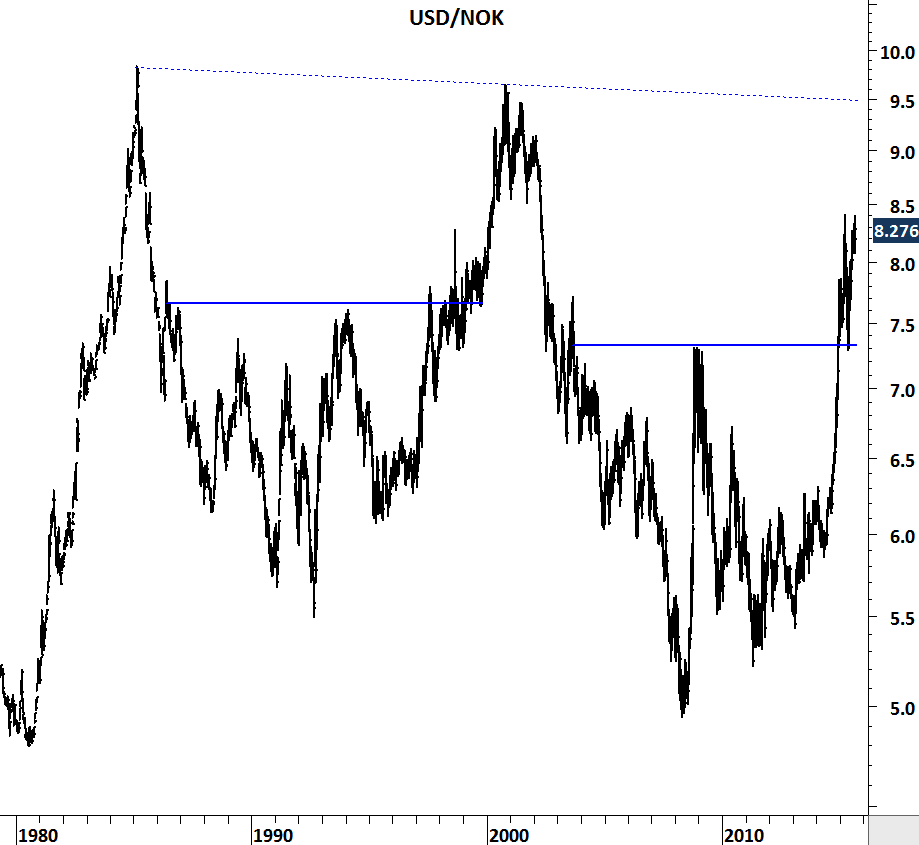
U.S. DOLLAR VS. NORWEGIAN KRONE

USDCAD

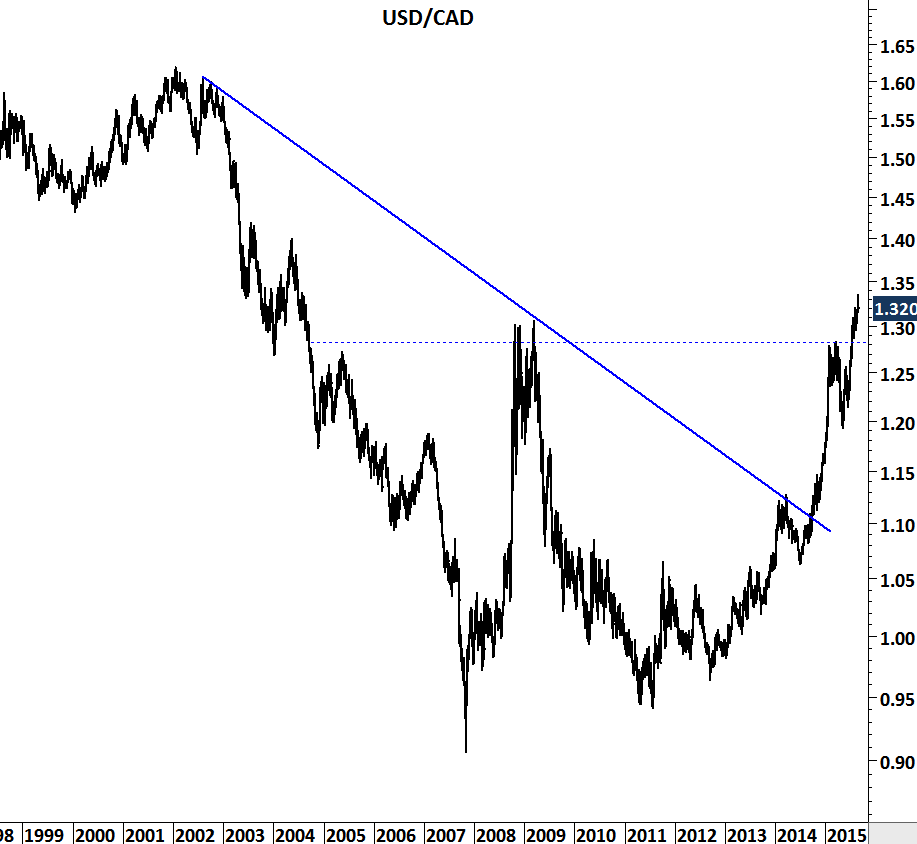
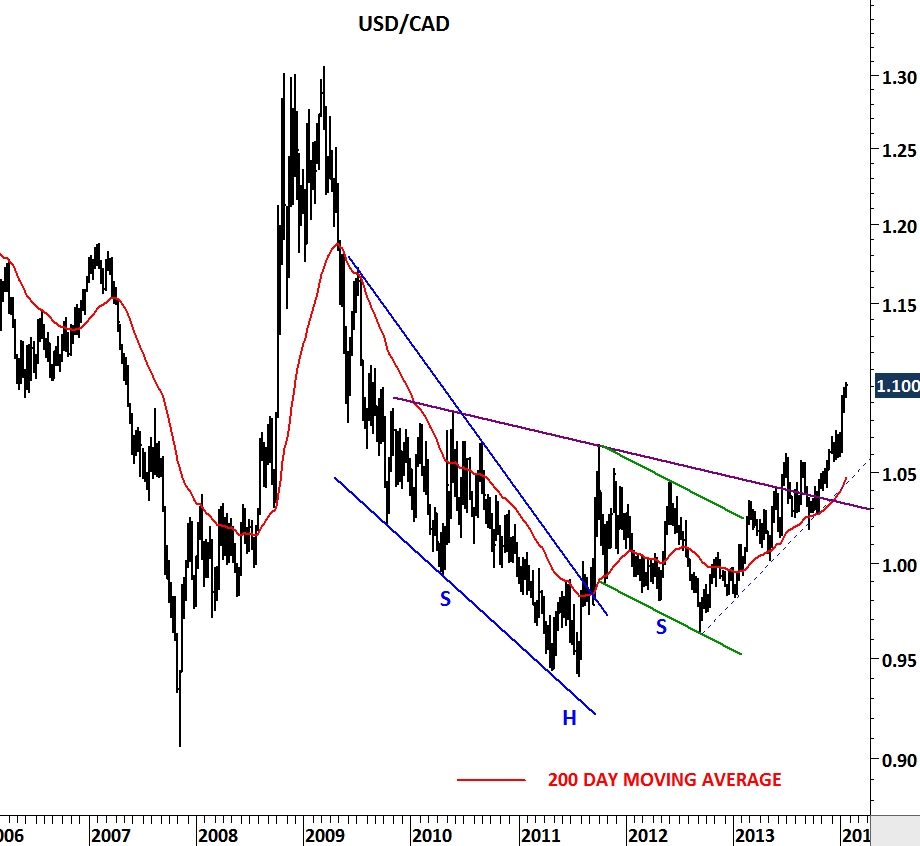
U.S. DOLLAR VS. CANADIAN DOLLAR

USDJPY

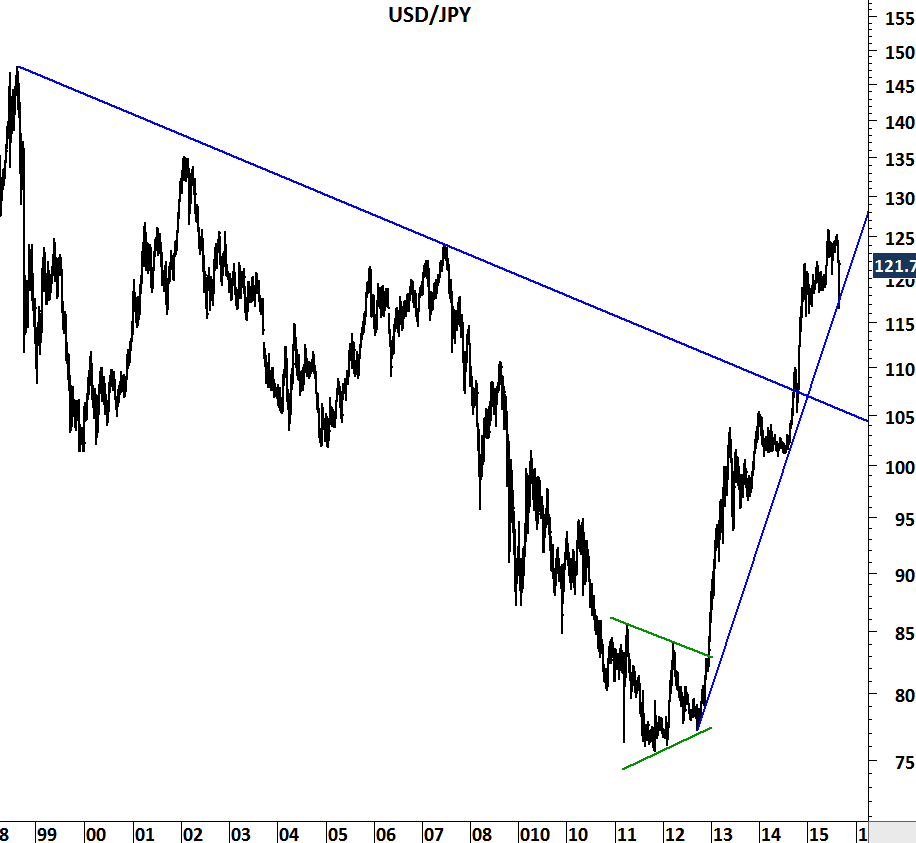
U.S. DOLLAR VS. JAPANESE YEN

GBPUSD

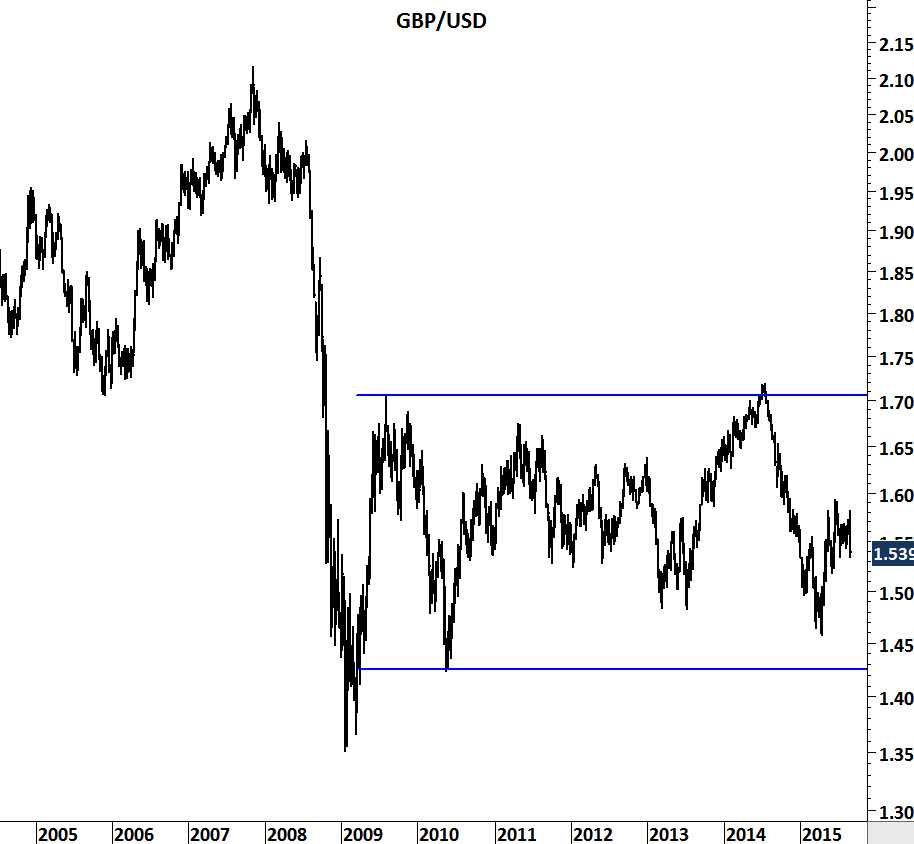
BRITISH POUND VS. U.S. DOLLAR

NZDUSD

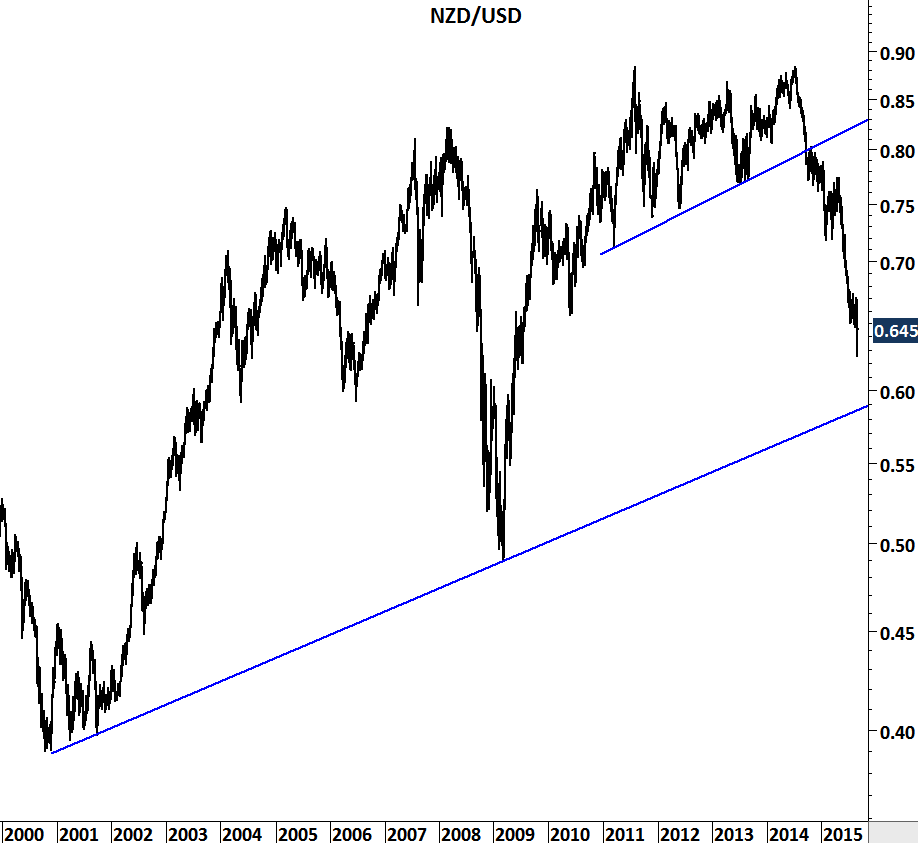
NEW ZEALAND DOLLAR VS. U.S. DOLLAR

AUDUSD

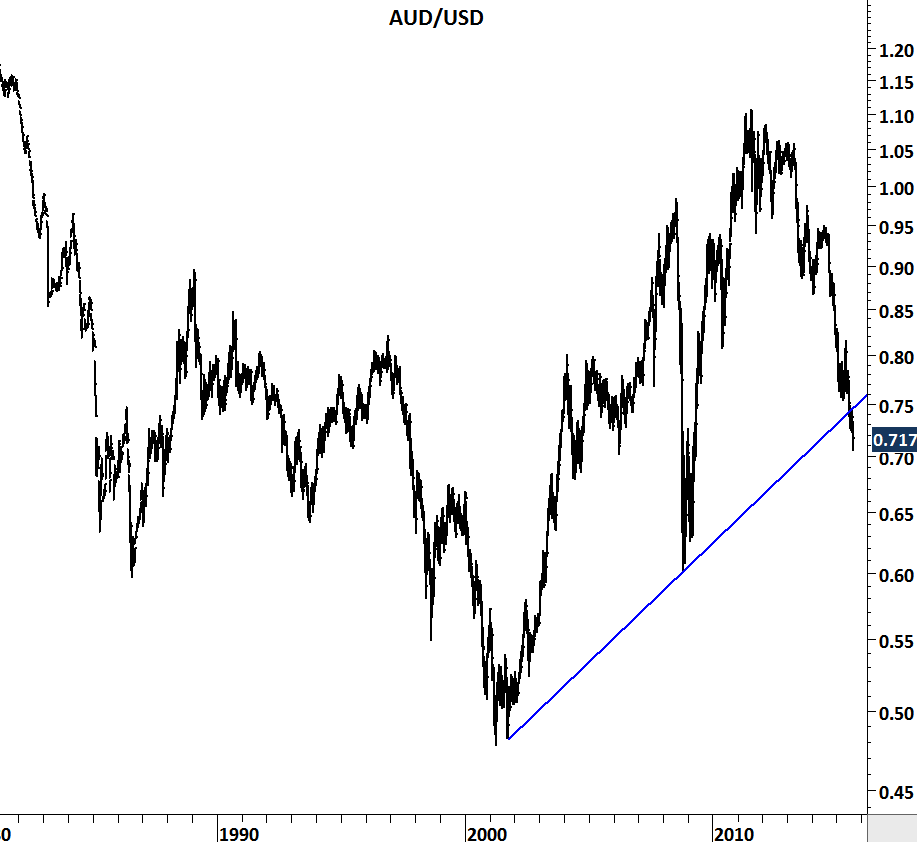
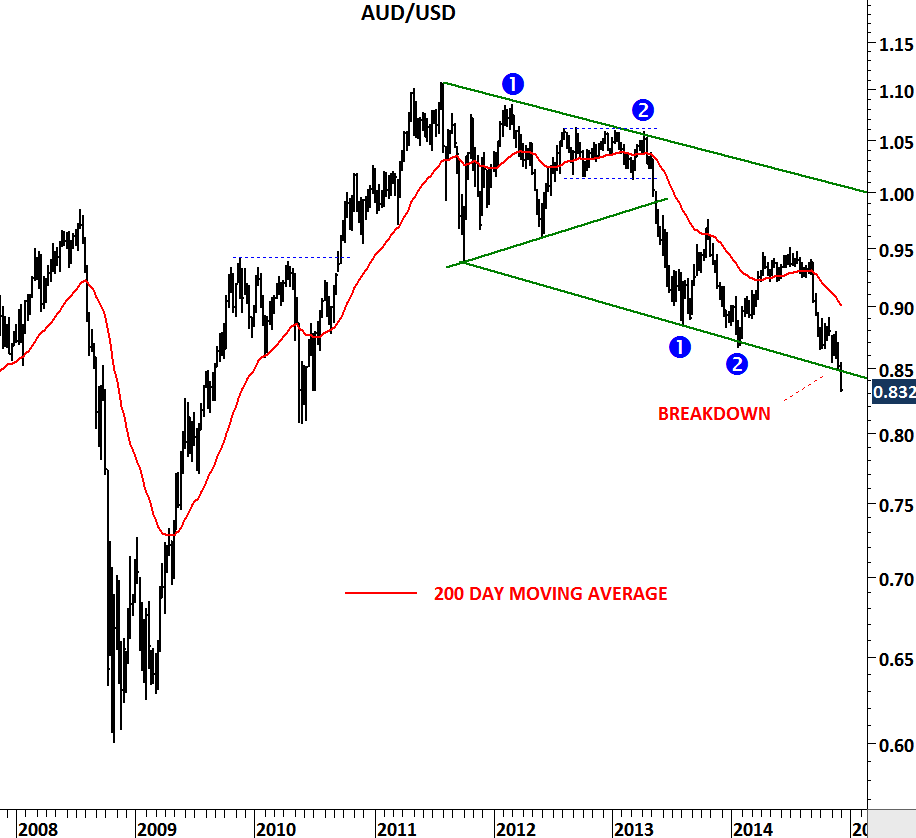
AUSTRALIAN DOLLAR VS. U.S. DOLLAR

AUD/USD

In a downtrend the lower boundary of a trend channel represents the “negative” extreme and the upper boundary the “positive” extreme. Price is expected to rebound from the positive and negative extremes. A downtrend is likely to reverse when the upper boundary is broken on the upside. Likewise an uptrend is likely to reverse when the lower boundary is broken on the downside.

CHANGE IN TREND DIRECTION

But what happens when the price doesn’t rebound from the lower or the upper boundary of the trend channel? Breaking down a negative extreme is usually a sign of an accelerated move in the direction of the breakdown.

ACCELERATION IN CURRENT TREND

This is the case with AUD/USD. Since 2011, Australian Dollar vs. U.S. Dollar has been in a downtrend. Cross rate rebounded from the lower boundary twice in 2013. With the latest sell-off AUD/USD breached the lower boundary, failing to rebound. Unless the cross rate recovers above 0.85 levels in the following weeks, latest breakdown will be the beginning of an accelerated move on the downside. In the short/medium-term and Australian dollar is weak against the U.S. dollar.

AUDUSD

USD/RUB (U.S. DOLLAR/RUSSIAN RUBLE)

USDRUB

Parabolic moves are not sustainable. They are also not easy to trade. It is costly to pick a top or a bottom. Price usually doesn’t stop where we think it would stop. However as a chartist I feel the urge to bring such imbalances to your attention. Whatever the instrument, these type of price movements are the perfect case studies to examine crowd psychology. USD/RUB entered into a parabolic move after breaking above 36.50 – historical high level. Sharp reversals are experienced after such steep price actions. In the past, similar price movements took place on few other charts.

USDKES

In 2011, USD/KES (U.S. DOLLAR/KENYAN SHILLING) had a similar long-term breakout followed by a 8 month-long parabolic move. Steep price action was reversed by Central Bank of Kenya’s bold action to raise interest rates from 6 percent to 18 percent in less than a year.

KENYA INTEREST RATES

In 2008, Rough Rice price rallied from 11.45 to 25 levels. Rice made the headlines (news on Rough Rice). Hoarding and export bans were the result of the sharp price increase. Rough rice fell back to 11.45 levels in the following year.

ROUGH RICE

U.S. DOLLAR INDEX

Dollar is gaining strength against major currencies. Recent breakout on the U.S. dollar index confirms this. Other than Euro and Japanese yen weakness we are also seeing depreciation in emerging market currencies. Combined weakening effect of the developed and emerging market currencies resulted in a sharp price movement on the U.S. dollar index. Latest breakout above 81.60 completed a “double bottom” chart pattern with a price target of 84-85 area for the coming weeks. Price should remain above 81.60 levels for the dollar strength to resume in the medium-term. 81.60 becomes the new support level.

US DOLLAR INDEX

Some exciting chart developments are taking place in the emerging market currencies. Peruvian Nuevo Sol; local currency of Peru is losing strength against the U.S. dollar. Latest chart development – ascending triangle on the weekly scale – is bullish for the dollar and suggests further depreciation of the Peruvian Nuevo Sol. Breakout above 2.82 levels will confirm the bearish case for PEN.

USDPEN

Another currency pair that is at the edge of a breakout is the Russian Ruble. Since the beginning of 2009 USD/RUB tested 36.50 for the third time. Breakout above 36.50 will be negative for the Russian currency. It is important to note that 36.50 is the historical high for the USD/RUB.

USDRUB

U.S. DOLLAR INDEX

Friday’s move on the U.S. dollar index could be a major medium-term reversal for some of the cross rates out there. I’ve discussed the U.S. dollar index chart in my earlier updates and drew attention to the importance of the strong medium-term support at 79.5 levels. (Earlier update is here) During last week U.S. dollar index breached the support level at 79.5 but failed to close below it. Instead the weekly close was at the highest level of the weekly bar. The low levels in March-April and May formed positive divergence on the MACD. Positive divergence on MACD is a bullish technical development. Following the same thought process on my earlier analysis, I will focus on two levels in the following weeks. 1) 200-day average at 80.50 levels which will act as resistance. 2) Medium-term support area between 79 and 79.50.

Do you see other bullish developments favoring U.S. dollar strength in the coming weeks? How would emerging market currencies react to possible strength in the U.S. dollar index? You can share your views with other followers. Have a very good week.

U.S. Dollar Index (Daily scale)

US DOLLAR INDEX daily

U.S. Dollar Index (Weekly scale)

US DOLLAR INDEX weekly

U.S. DOLLAR INDEX

Multi-year low volatility reading on the U.S. dollar index suggests strong directional movement in the following weeks/months. U.S. dollar index tested the strong support level for the 5th time over the past two years and a breakdown below this support level at 79.5 could push the U.S. dollar index towards 75 levels. Unless we see another rebound from the strong support in the following weeks, we will favor a bearish scenario for the U.S. dollar. Low volatility is something we should keep an eye on. Previous breakouts from such low volatility readings resulted in sharp price swings.

US DOLLAR INDEX


U.S. DOLLAR INDEX

February will be an important month for currencies and especially for the U.S. dollar. U.S. dollar index rebounded from the lower boundary of its 2 year-long consolidation for the 4th time and now the index is challenging the minor resistance at 81.50 levels. Similar breakouts resulted in a strong U.S. dollar in the first half of 2012 and in the beginning of 2013. Breakout above 81.50 can push the U.S. dollar index towards 84-85 area in the following months. Strong medium-term support remains at 79.5.

U.S. Dollar Index (Weekly scale)

US DOLLAR INDEX weekly

U.S. Dollar Index (Daily scale)

US DOLLAR INDEX daily

U.S. dollar vs. MXN, TRY, PHP, TWD…

My latest updates on twitter. I believe these charts are very valuable and suggest U.S. dollar strength against the currencies analyzed.

U.S. DOLLAR vs. CAD, MXN, TWD, TRY …

Yes, it is a global trend and the dollar is gaining strength against most of the currency pairs. U.S. dollar index is trying to clear its 200 day moving average. Emerging market currencies have depreciated against the U.S. dollar over the past few months and seems like more and more weak signals are being generated by the recent breakouts. Here are some of the charts I shared earlier during the month and some new charts I want to draw attention to.

US DOLLAR INDEX

USDCAD

USDMXN

USDTRY

USDPHP

USDRUB

USDZAR

USDTWD