Posts

GLOBAL EQUITY MARKETS – March 3, 2018

Reminder on Live Webinar

Due to very positive feedback we got for the last webinar on rectangle chart patterns, we are continuing the webinar series with another reliable horizontal chart pattern; the ascending triangle. Live Webinar and Q&A with Aksel - Thursday, March 8, 11am mountain. You can register here (Register for the Live Webinar)


REVIEW


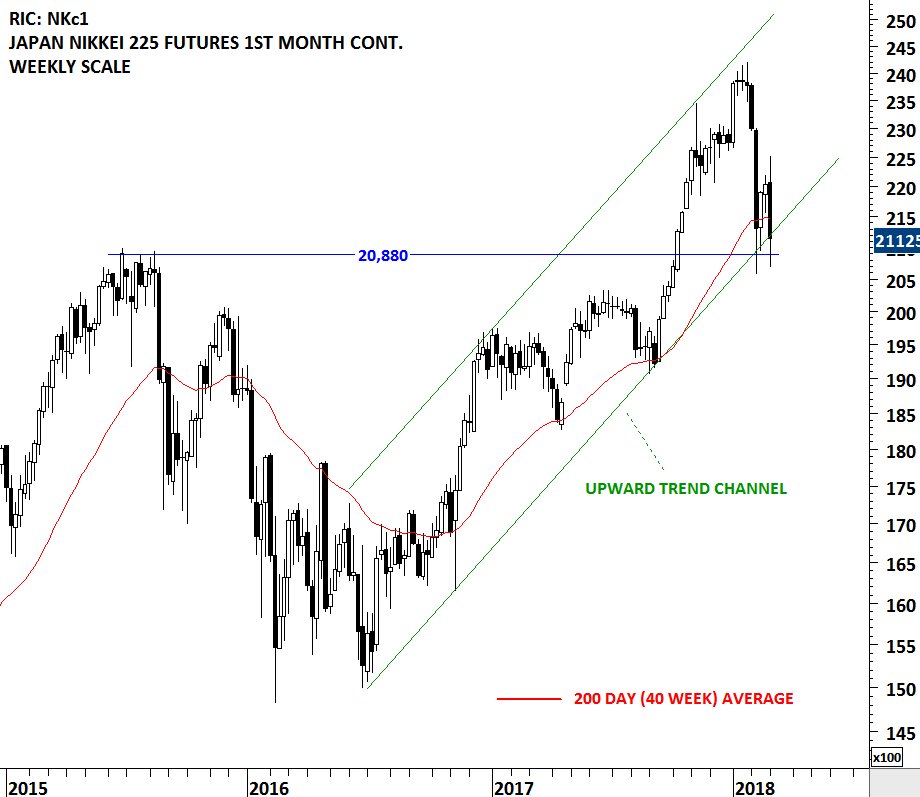
Equity indices that had weak rebound from the lows, tested the same support areas. Japan's Nikkei Index is one of them. On the weekly scale we can see that the upward trend channel is still intact with the support forming at 20,880 levels. On the daily scale price chart (futures price data to capture Friday's close) we can see that the Friday's recovery on U.S. indices helped the Nikkei Futures to form a Doji candlestick at the support. Failure to hold these levels can result in a larger scale correction. In the short-term Japan's Nikkei will try to find support around 20,880 levels and if it succeeds we will possibly label the price action as a double bottom.
Read More

TOP DOWN vs. BOTTOM UP ANALYSIS

Bottom-up research & investing focuses on the individual stocks and deemphasizes the significance of economic cycles and market cycles. In bottom-up investing, the investor focuses his attention on a specific company, rather than on the industry in which that company operates or on the economy as a whole. This is the opposite of top-down research & investing, which is a strategy that first considers macroeconomic factors when making an investment decision. Top-down investors instead look at the broad performance of the economy, and then seek industries that are performing well, investing in the best opportunities within that industry.

Read More

GLOBAL EQUITY MARKETS – February 17, 2018

REVIEW


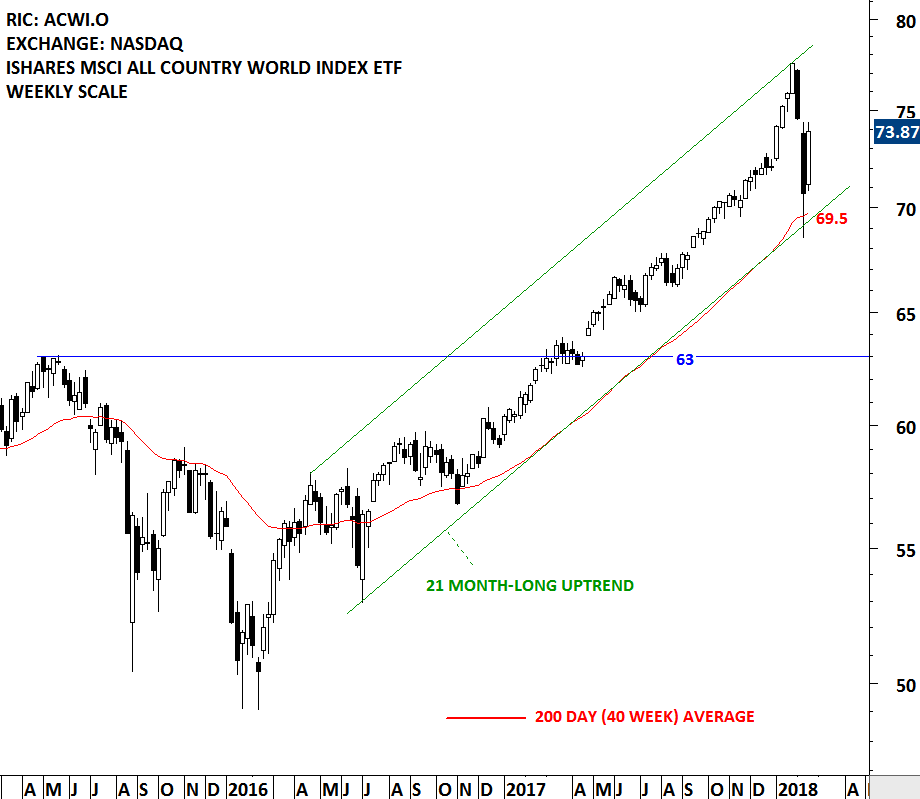
Global Equity Markets had a strong rebound from their long-term averages. A benchmark for Global equity market performance; the iShares MSCI All Country World Index ETF rebounded from its 200-day (40 week) average and the lower boundary of its multi-month long upward trend channel. Long-term uptrend remains intact. In the following weeks Global equity indices will possibly continue to consolidate in a range until volatility is back to lower levels. In case of a re-test of last week's lows, both the lower boundary of the uptrend and the long-term average will act as strong support levels.

Read More