CHINA SSE 50 INDEX & FTSE A 50 ETF
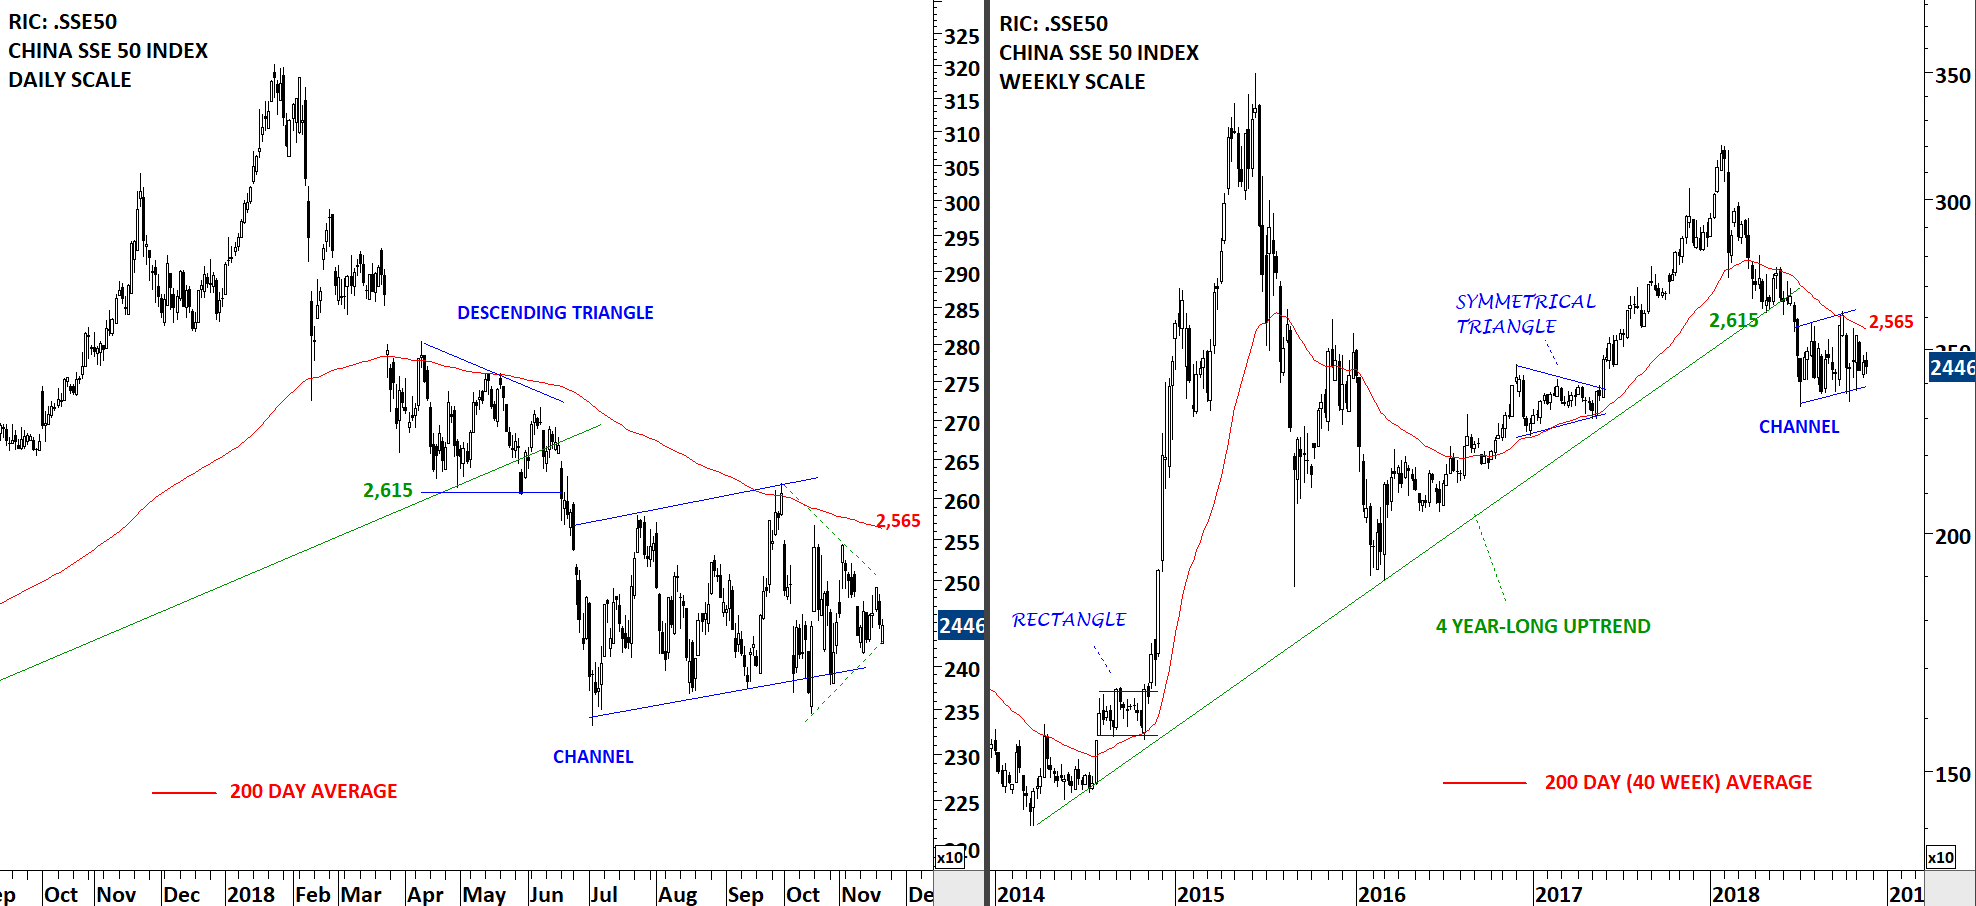
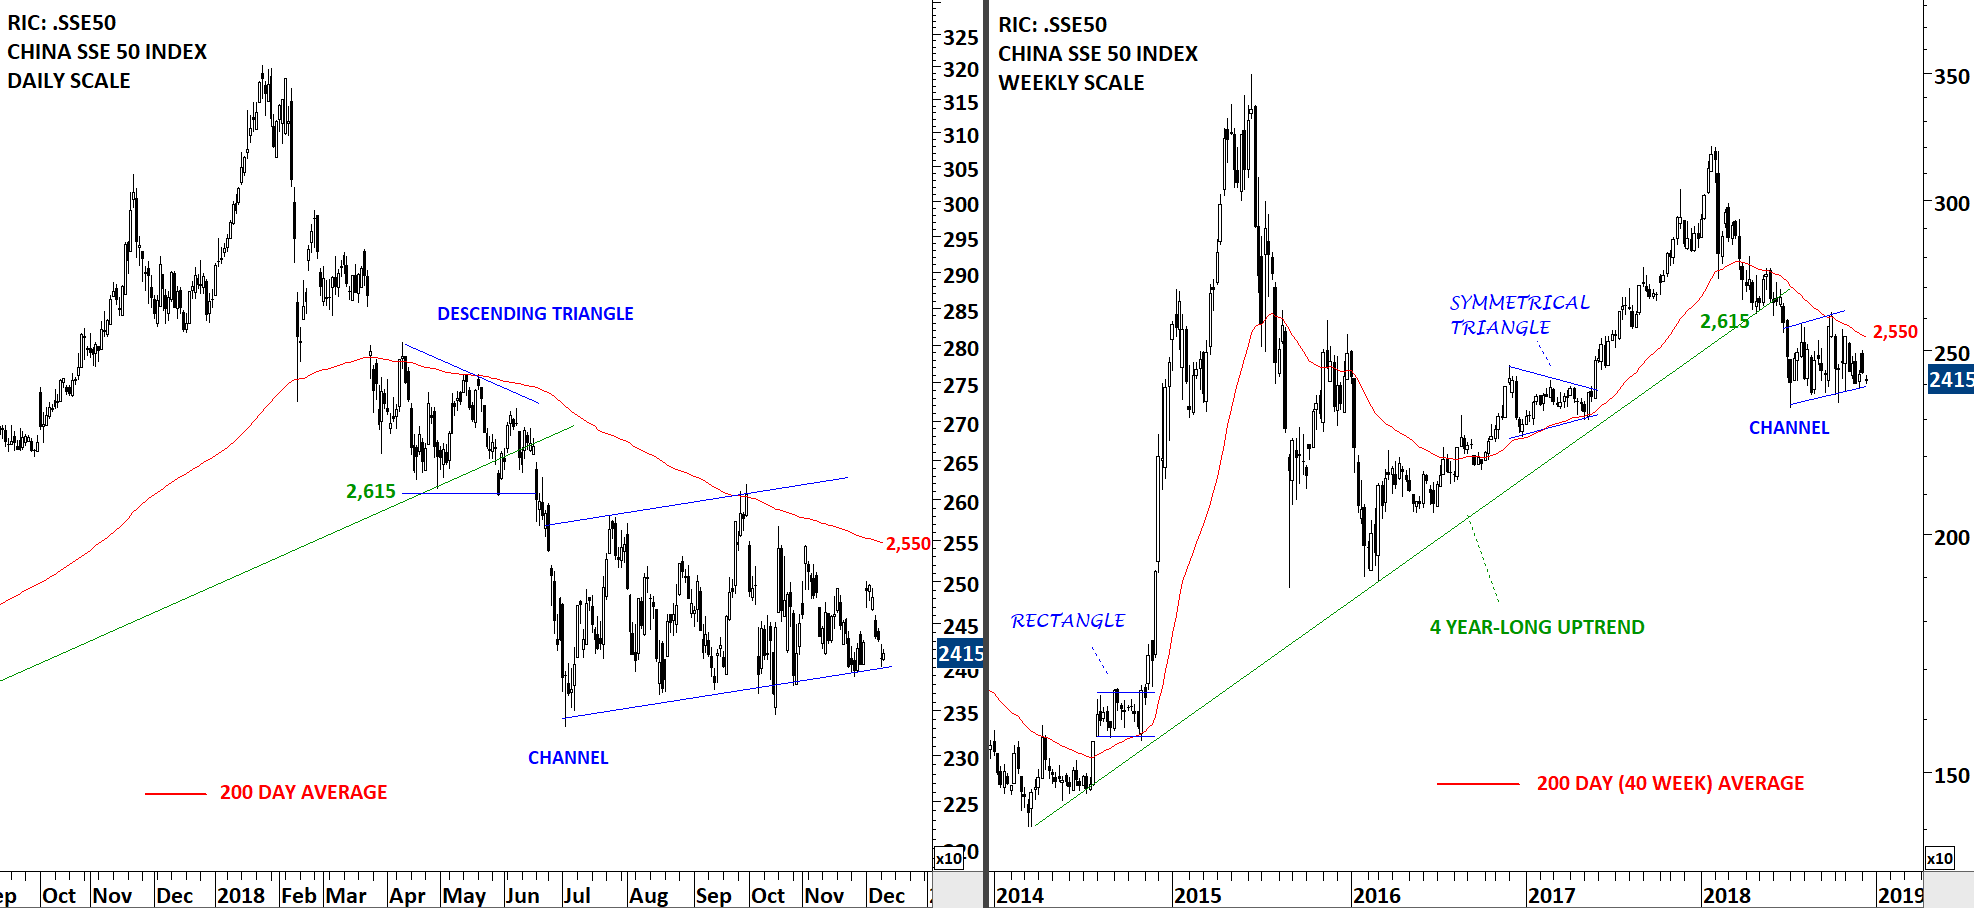
Low volatility period begets high volatility and vice versa. Price charts when going through those low volatility periods form one of the classical chart pattern (symmetrical triangle, rectangle, flag/pennant, H&S continuation, right angle triangle) and alert us for a possible breakout. Breakouts from lengthy and low volatility consolidation periods are usually followed by strong breakouts and directional movements. We would like to capture those strong directional movements.
One of the best example for the cyclicality of volatility is the China SSE 50 Index. Strong directional move that took place in the first half of 2018 is now being followed by a tight consolidation (low volatility period) which is likely to be followed by sharp price action in the following weeks/months. Past 5 month’s price action formed a channel in a tight range. Breakout from the 5 month-long channel can either reverse the downtrend that has been intact since the beginning of the year, or resume the downtrend. In either case we are likely to see a strong directional movement. Resistance stands at 2,550 levels.
For those who would like to take advantage of a possible breakout/breakdown on China SSE 50 Index, I feature below the iShares FTSE A50 China Index ETF that is listed on the Hong Kong Stock Exchange.
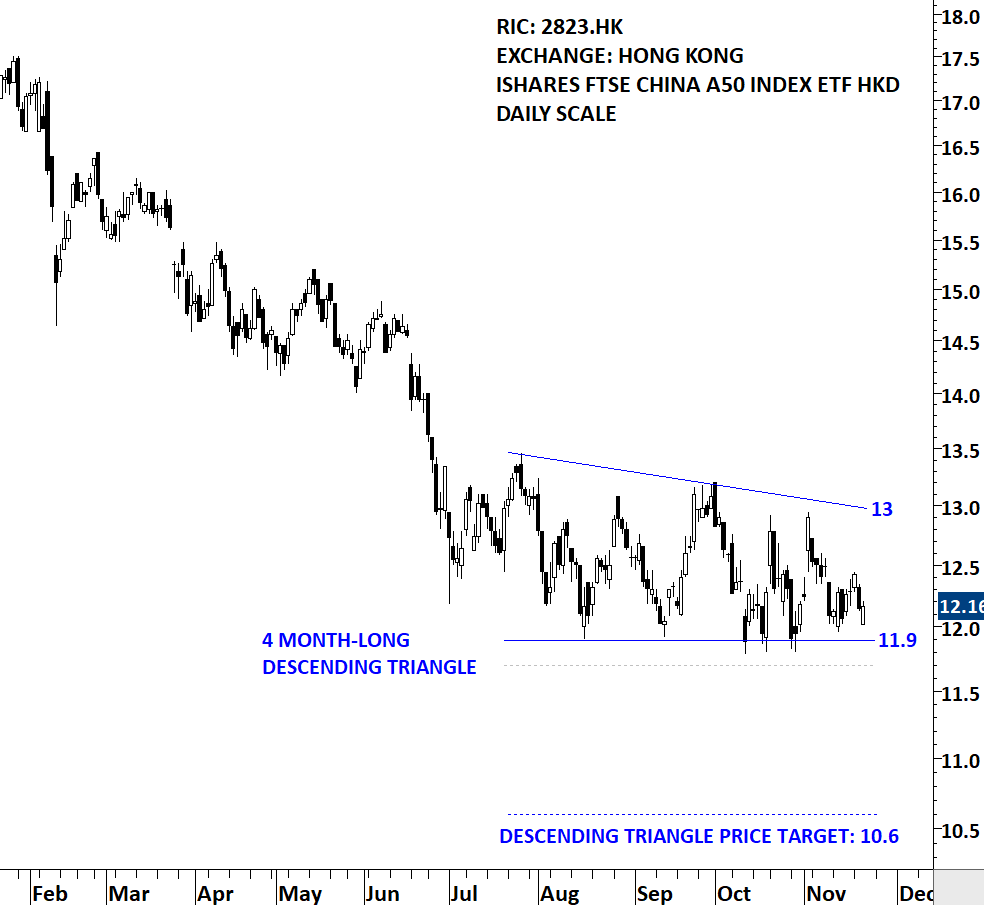
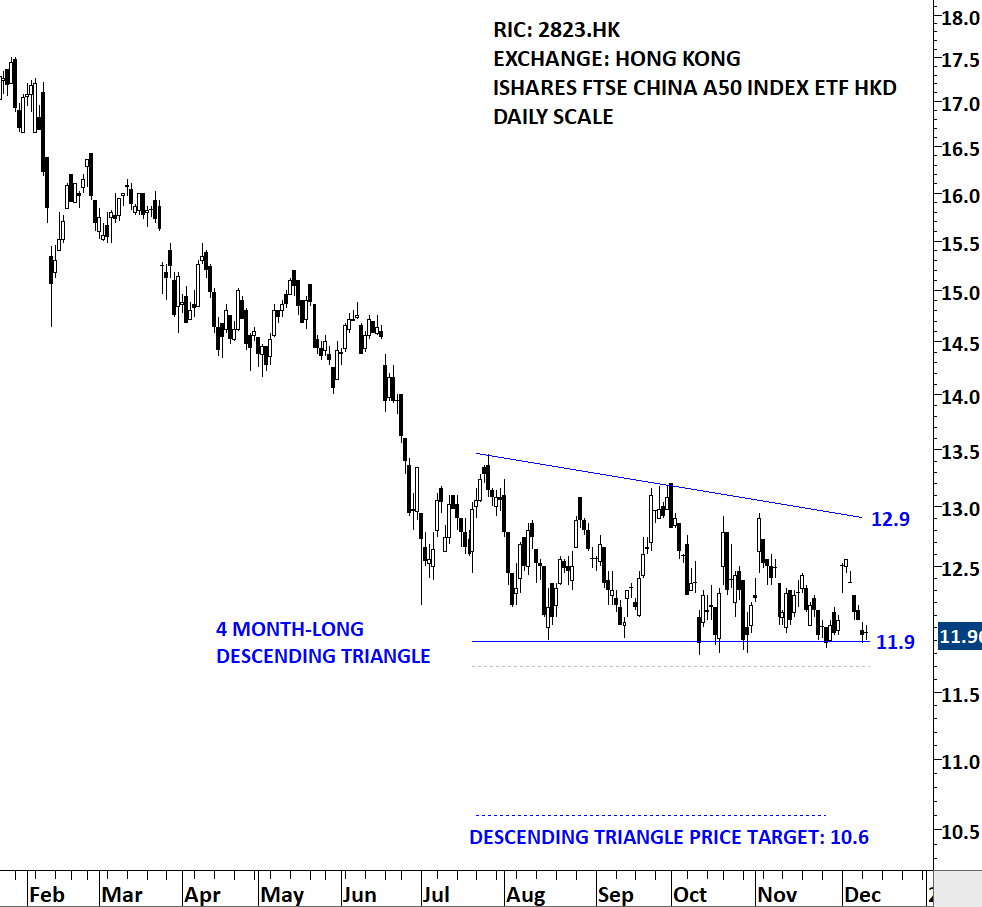
ISHARES FTSE A50 CHINA INDEX ETF HKD (2823.HK)
The Ishares FTSE A50 China Index ETF aims to provide investment results that, before fees and expenses, closely correspond to the performance of the FTSE China A50 Index.The ETF is listed on the Hong Kong Stock Exchange. Price chart formed a 4 month-long descending triangle with the horizontal boundary acting as strong support at 11.9 levels. The horizontal boundary was tested several times over the course of the chart pattern. A daily close below 11.7 levels will confirm the breakdown from the 4 month-long descending triangle with the possible chart pattern price target of 10.6 levels.
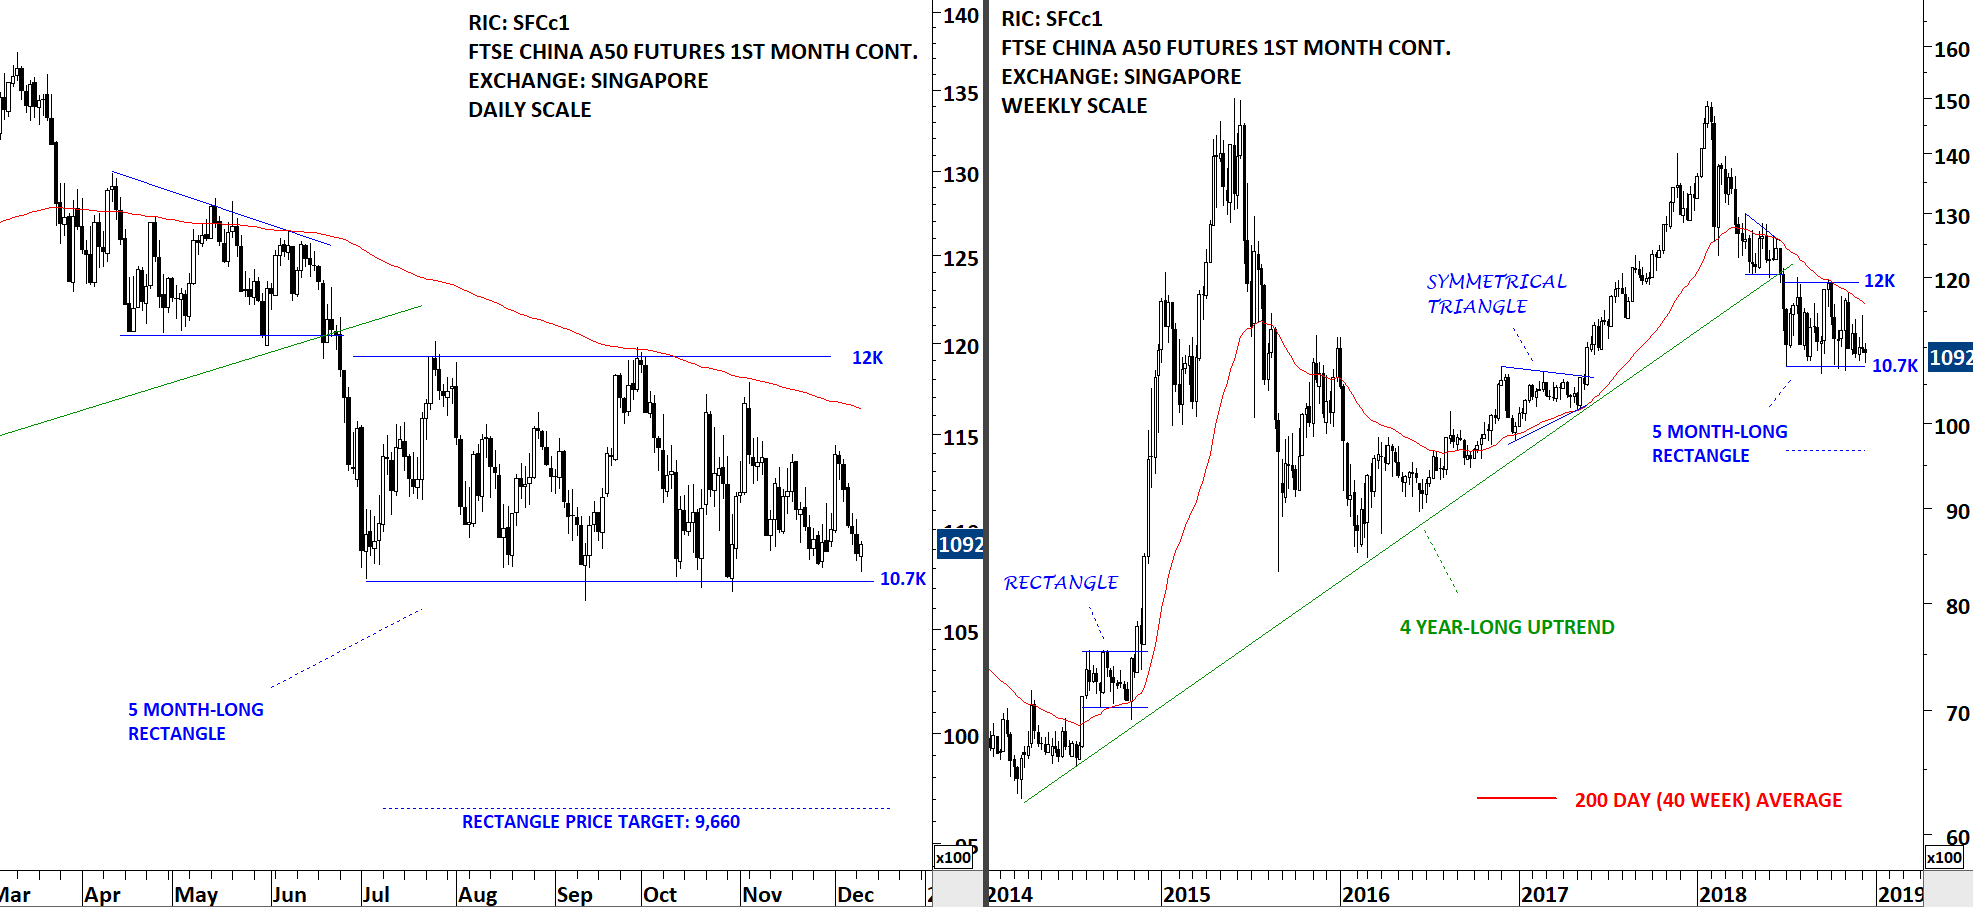
The charts below show another market, Singapore Derivatives Exchange, where China A50 index can be traded. Both the daily and weekly scale price charts show the developing rectangle with well-defined horizontal boundaries. The lower boundary of the 5 month-long consolidation has been tested several times. A decisive breakdown can confirm the rectangle as a bearish continuation with the possible chart pattern price target of 9,660 levels.
Tech Charts Membership

By becoming a Premium Member, you’ll be able to improve your knowledge of the principles of classical charting.
With this knowledge, you can merge them with your investing system. In fact, some investors use my analyses to modify their existing style to invest more efficiently and successfully.

As a Premium Member of Aksel Kibar’s Tech Charts,
You will receive:
-
Global Equities Report. Delivered weekly.
-
Classical charting principles. Learn patterns and setups.
-
Actionable information. Worldwide indices and stocks of interest.
-
Risk management advice. The important trading points of each chart.
-
Information on breakout opportunities. Identify the ones you want to take action on.
-
Video tutorials. How patterns form and why they succeed or fail.
-
Watch list alerts. As they become available so you can act quickly.
-
Breakout alerts. Usually once a week.
-
Access to everything (now and as it becomes available)o Reports
o Videos and video series -
Multi-part webinar course. You learn the 8 most common charting principles.
-
Webinars. Actionable and timely advice on breaking out chart patterns.
For your convenience your membership auto renews each year.