GLOBAL EQUITY MARKETS – August 3, 2019
REVIEW
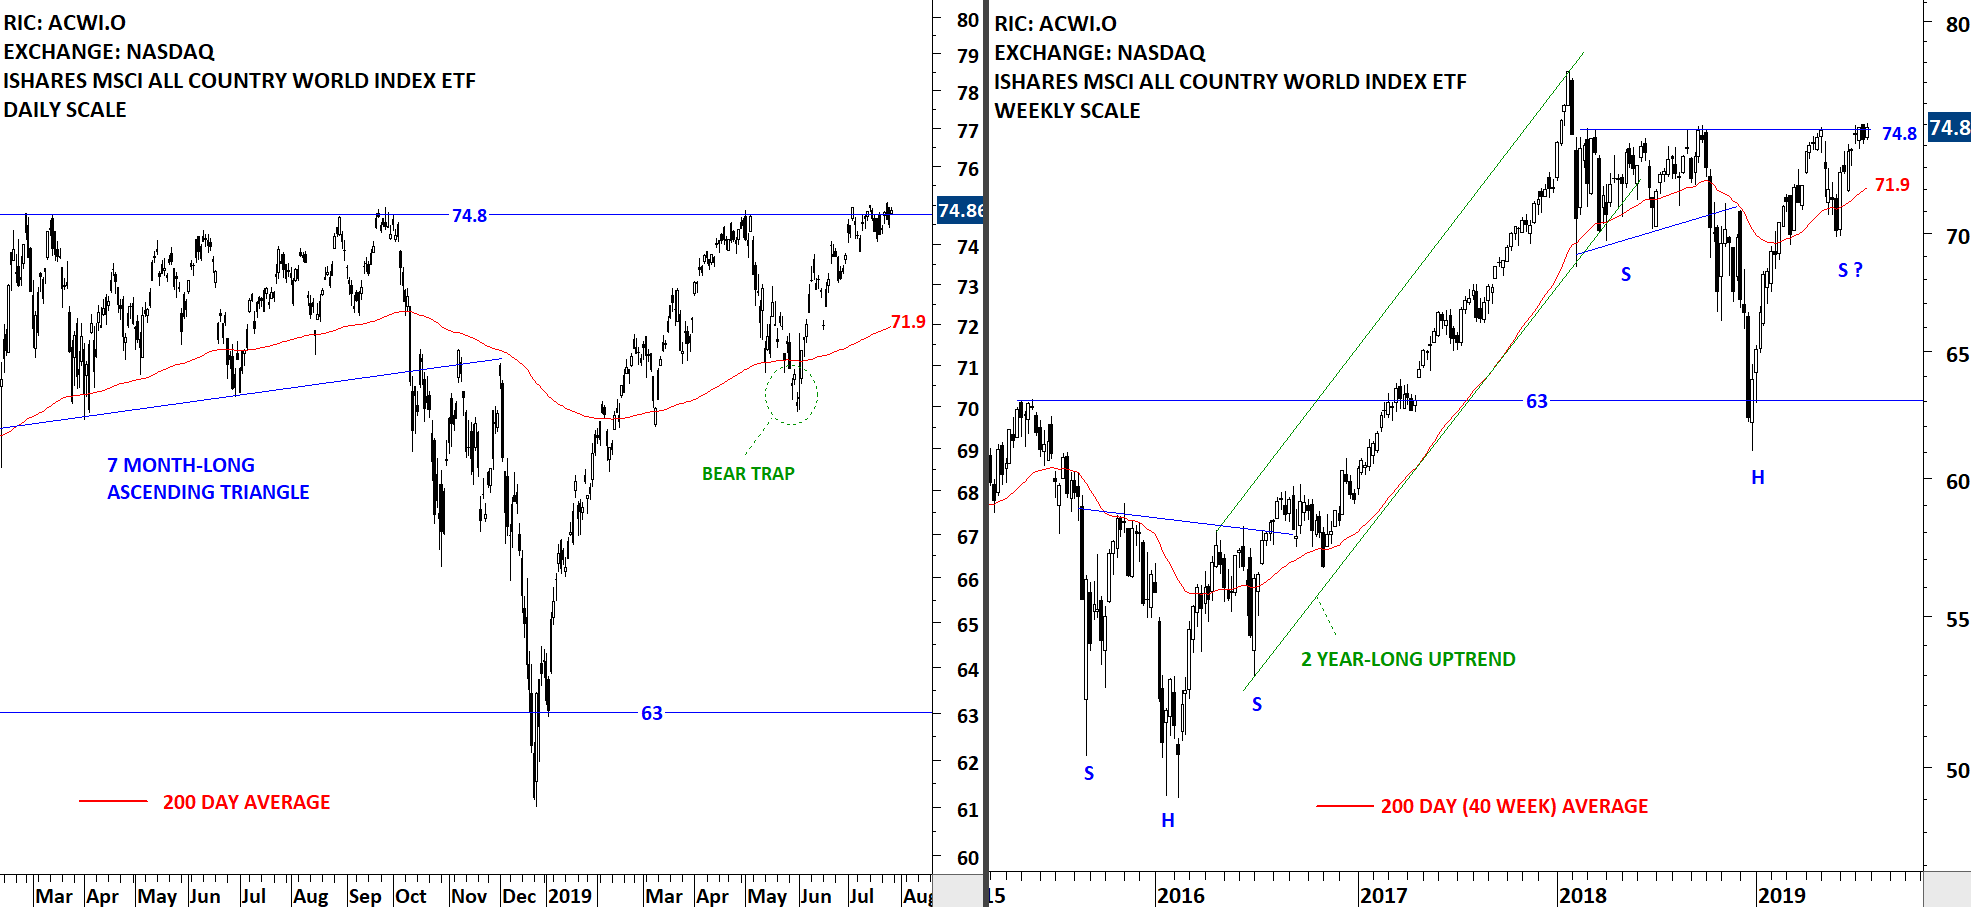
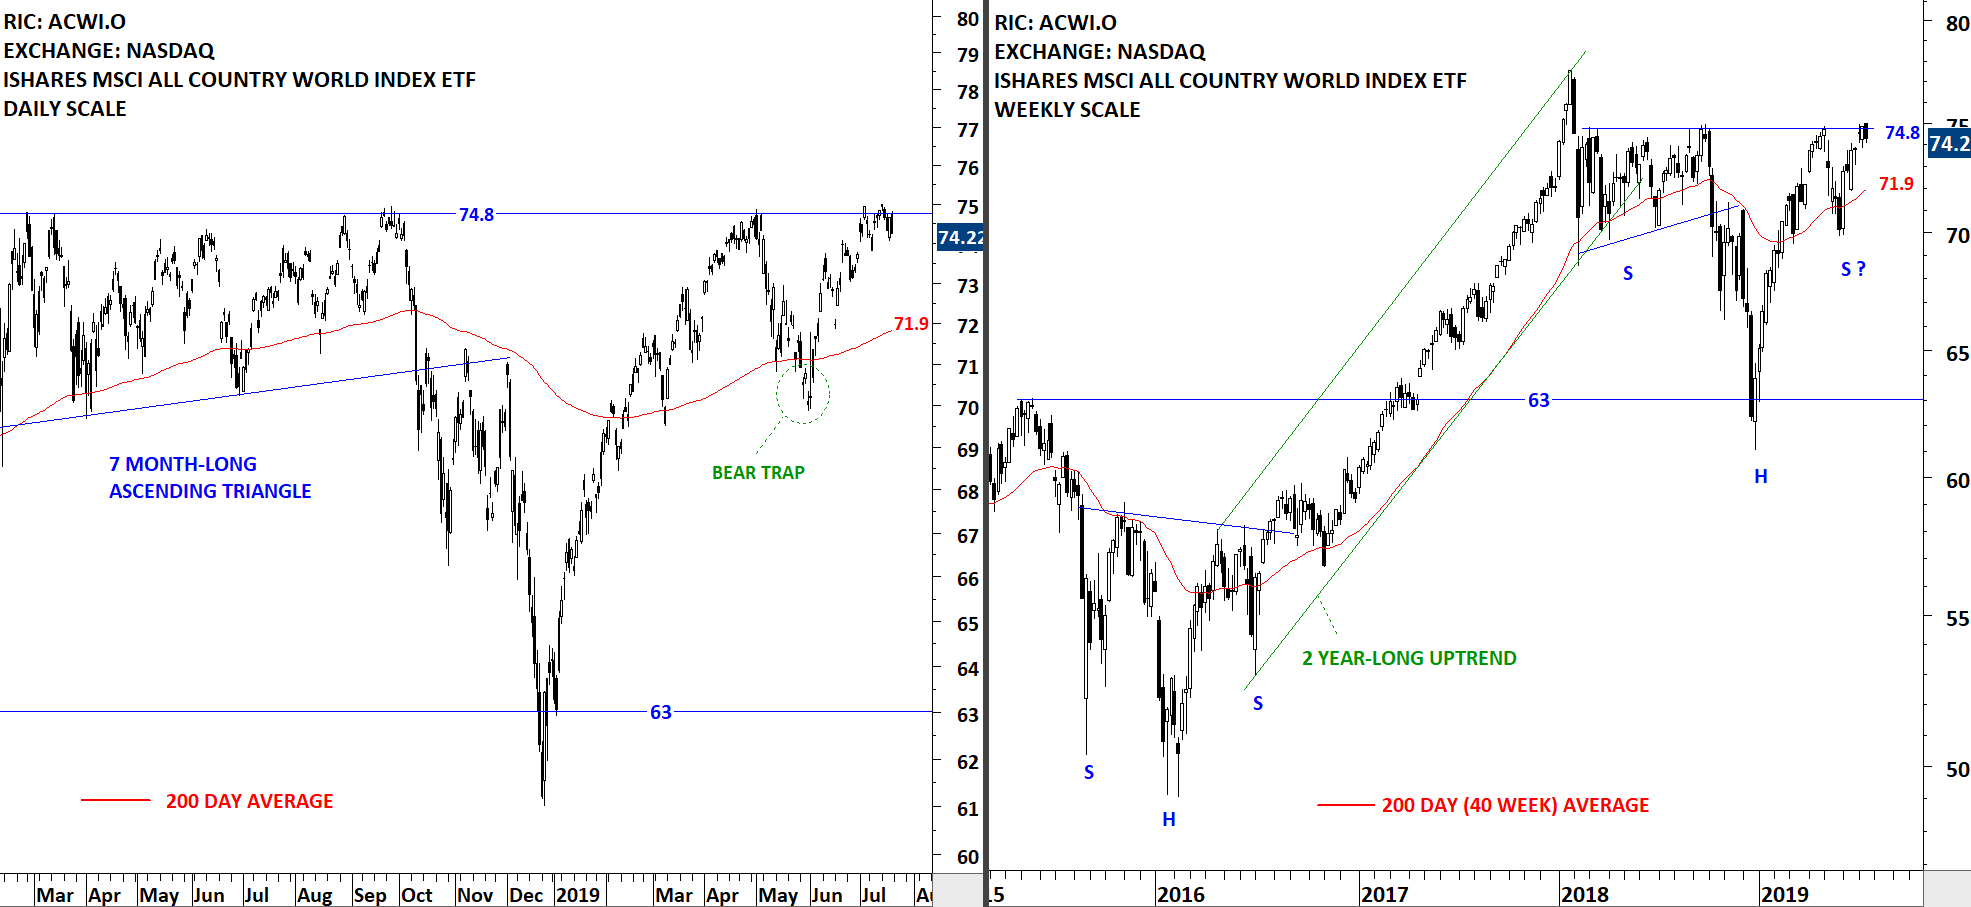
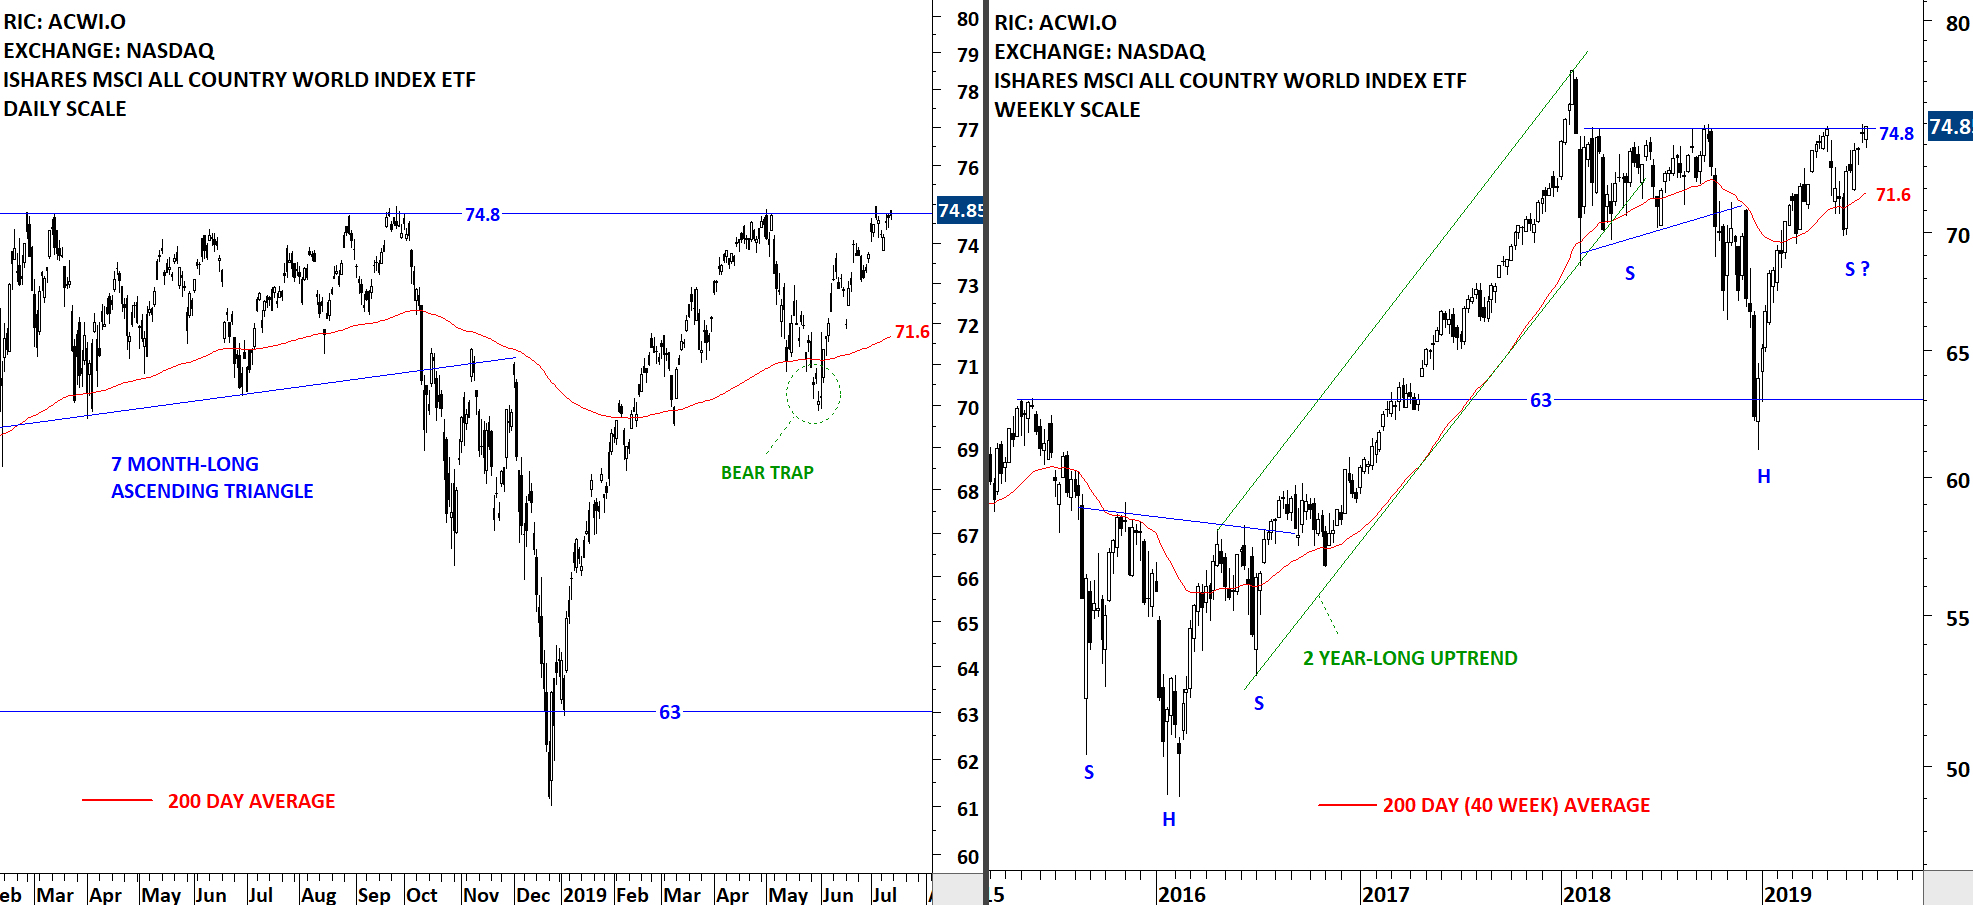
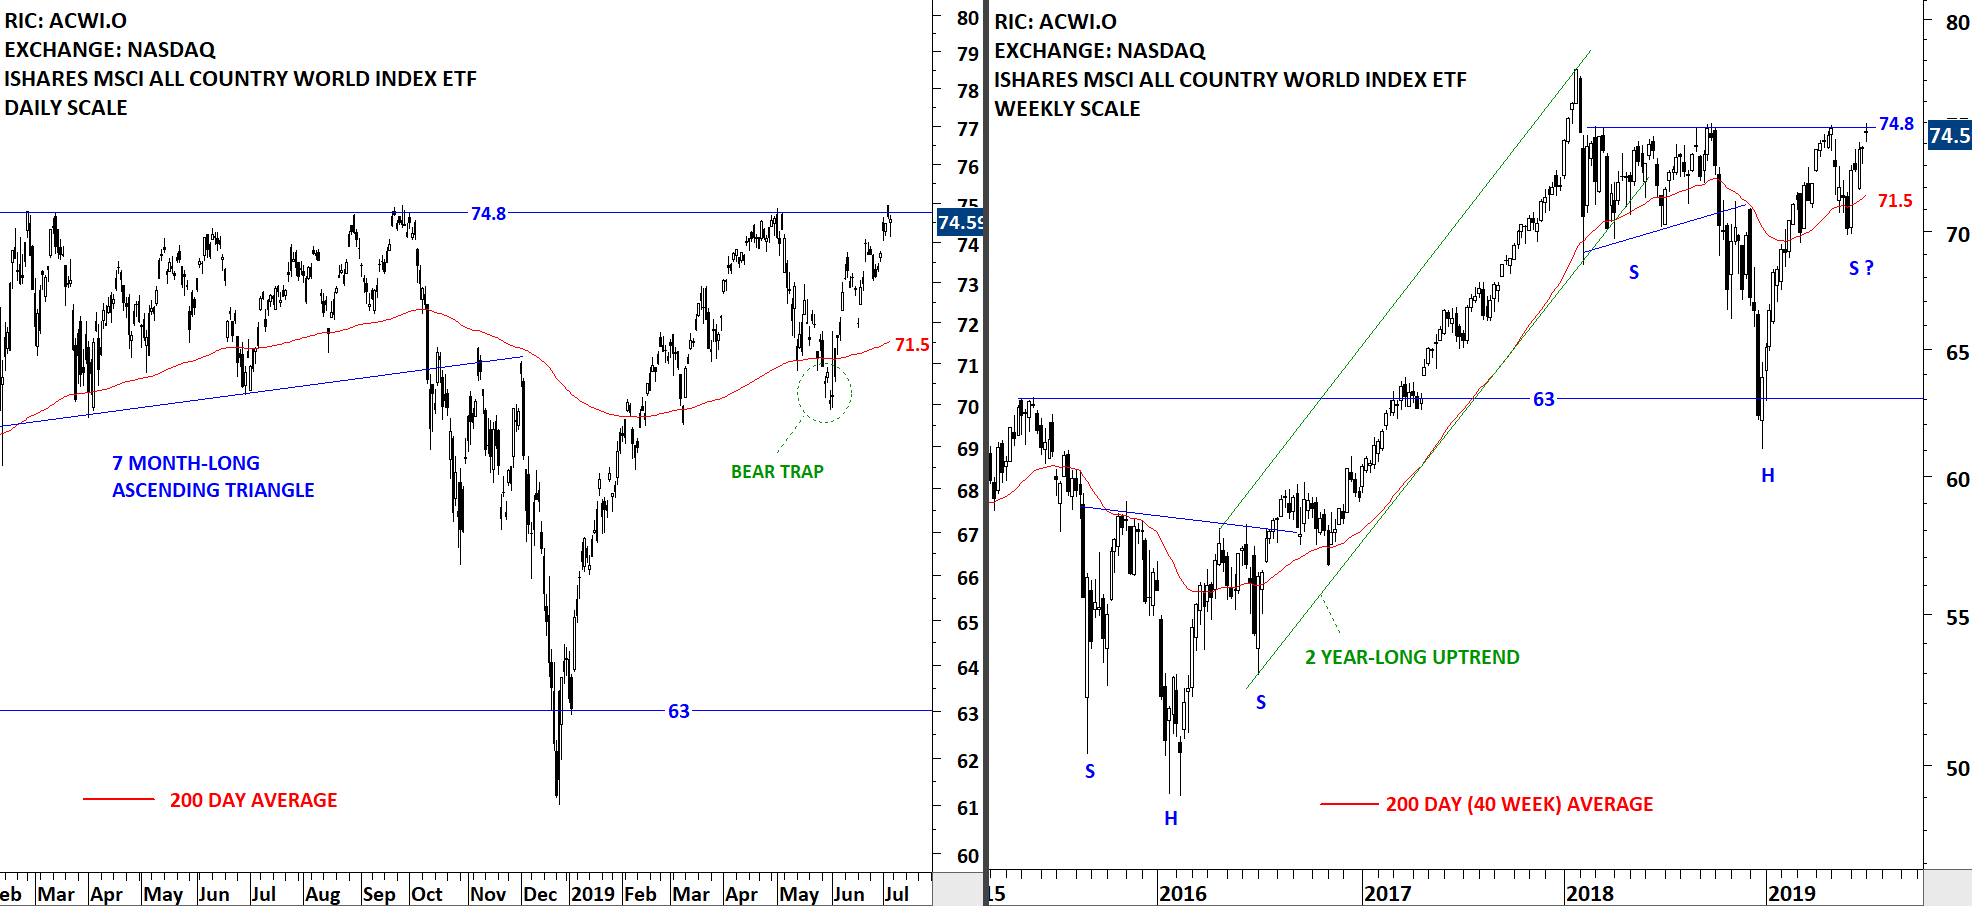
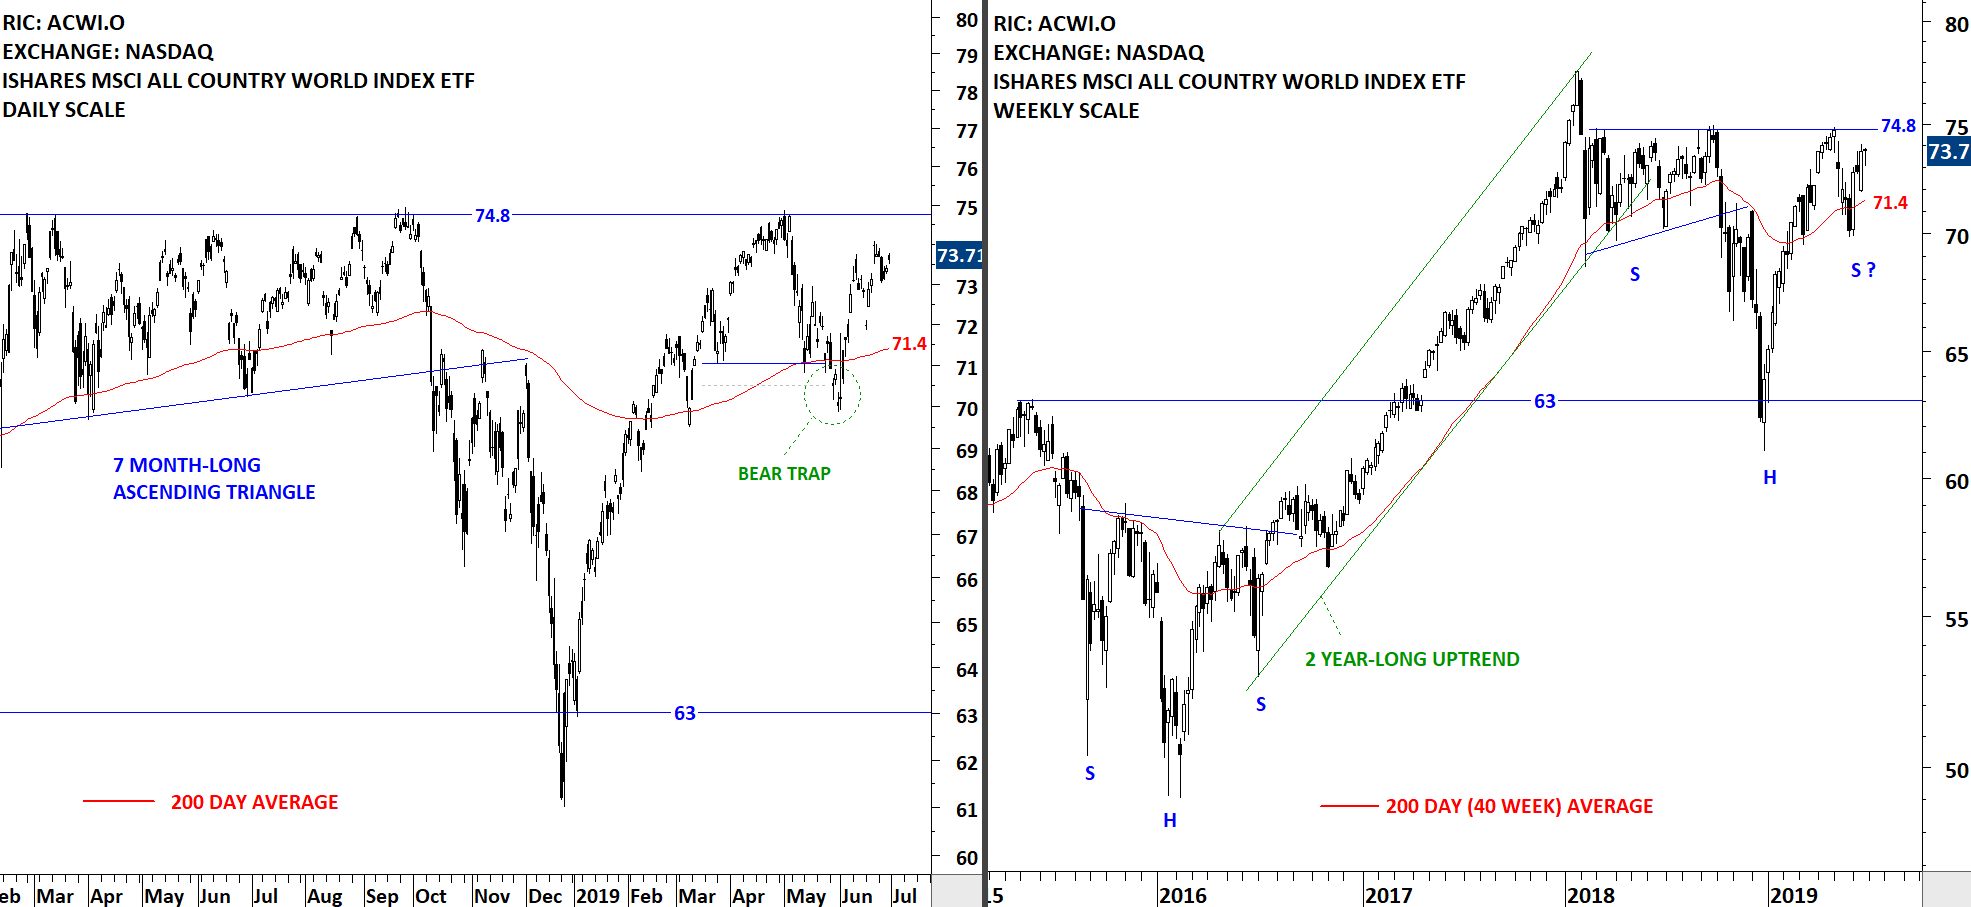
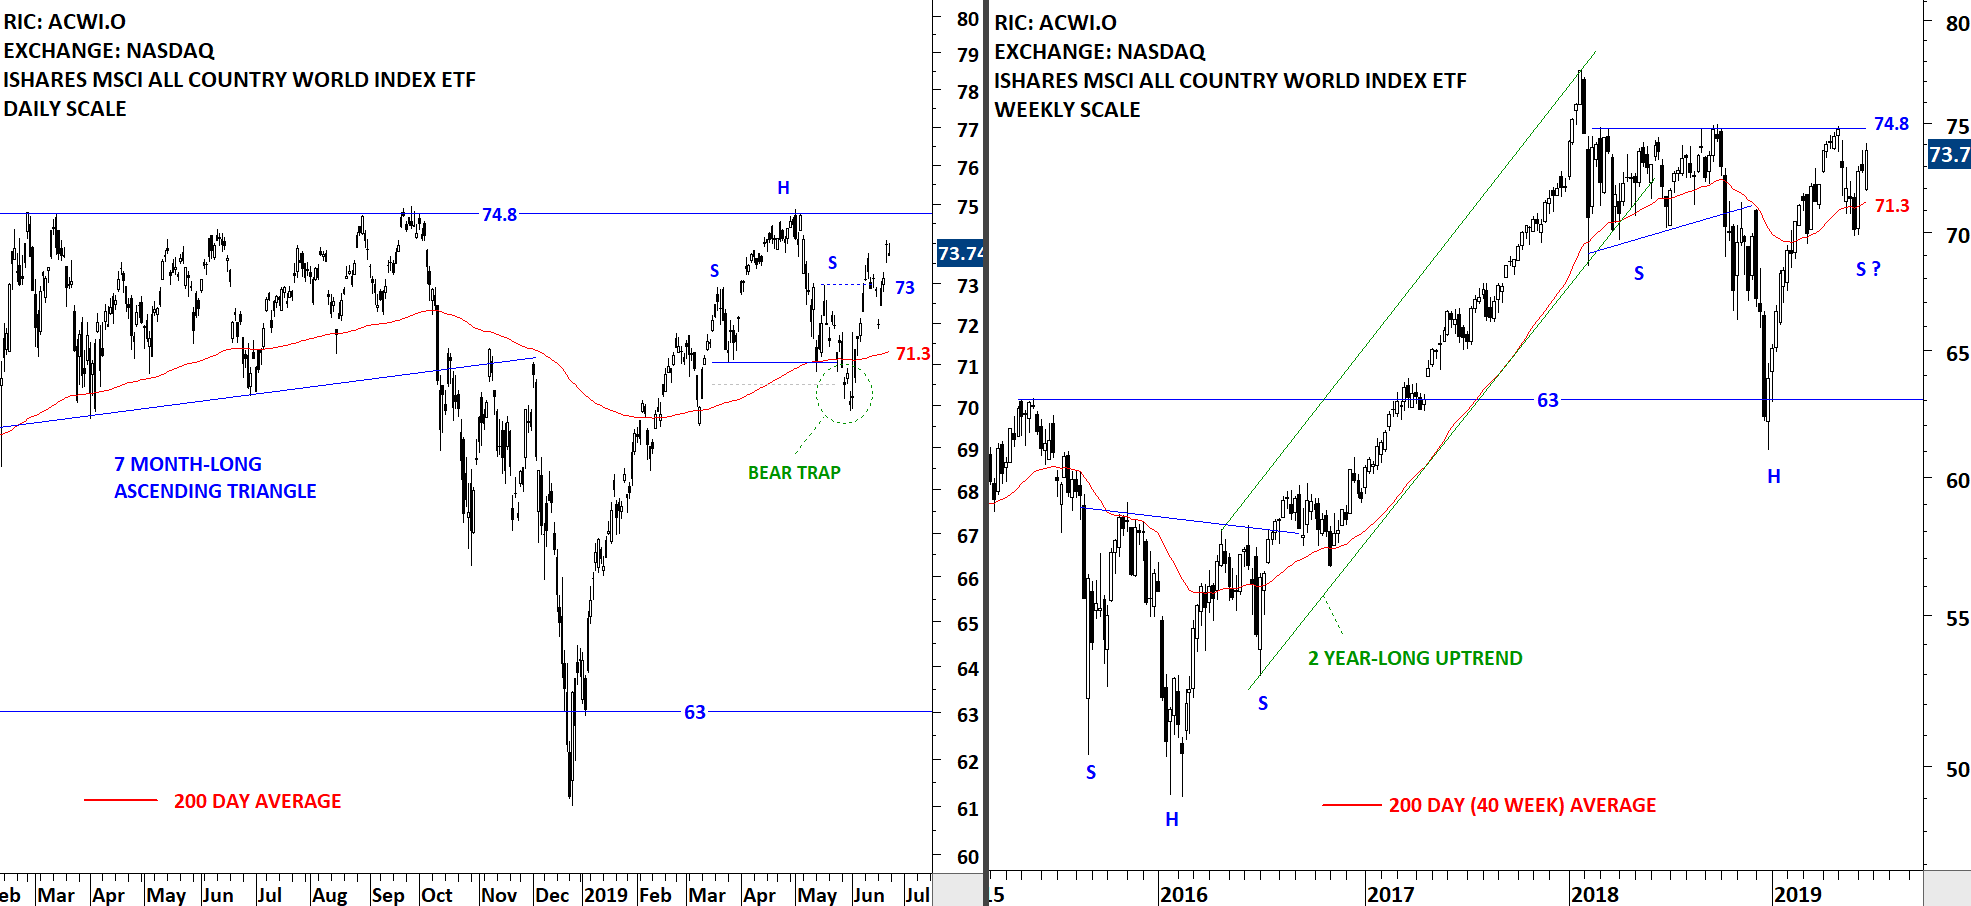
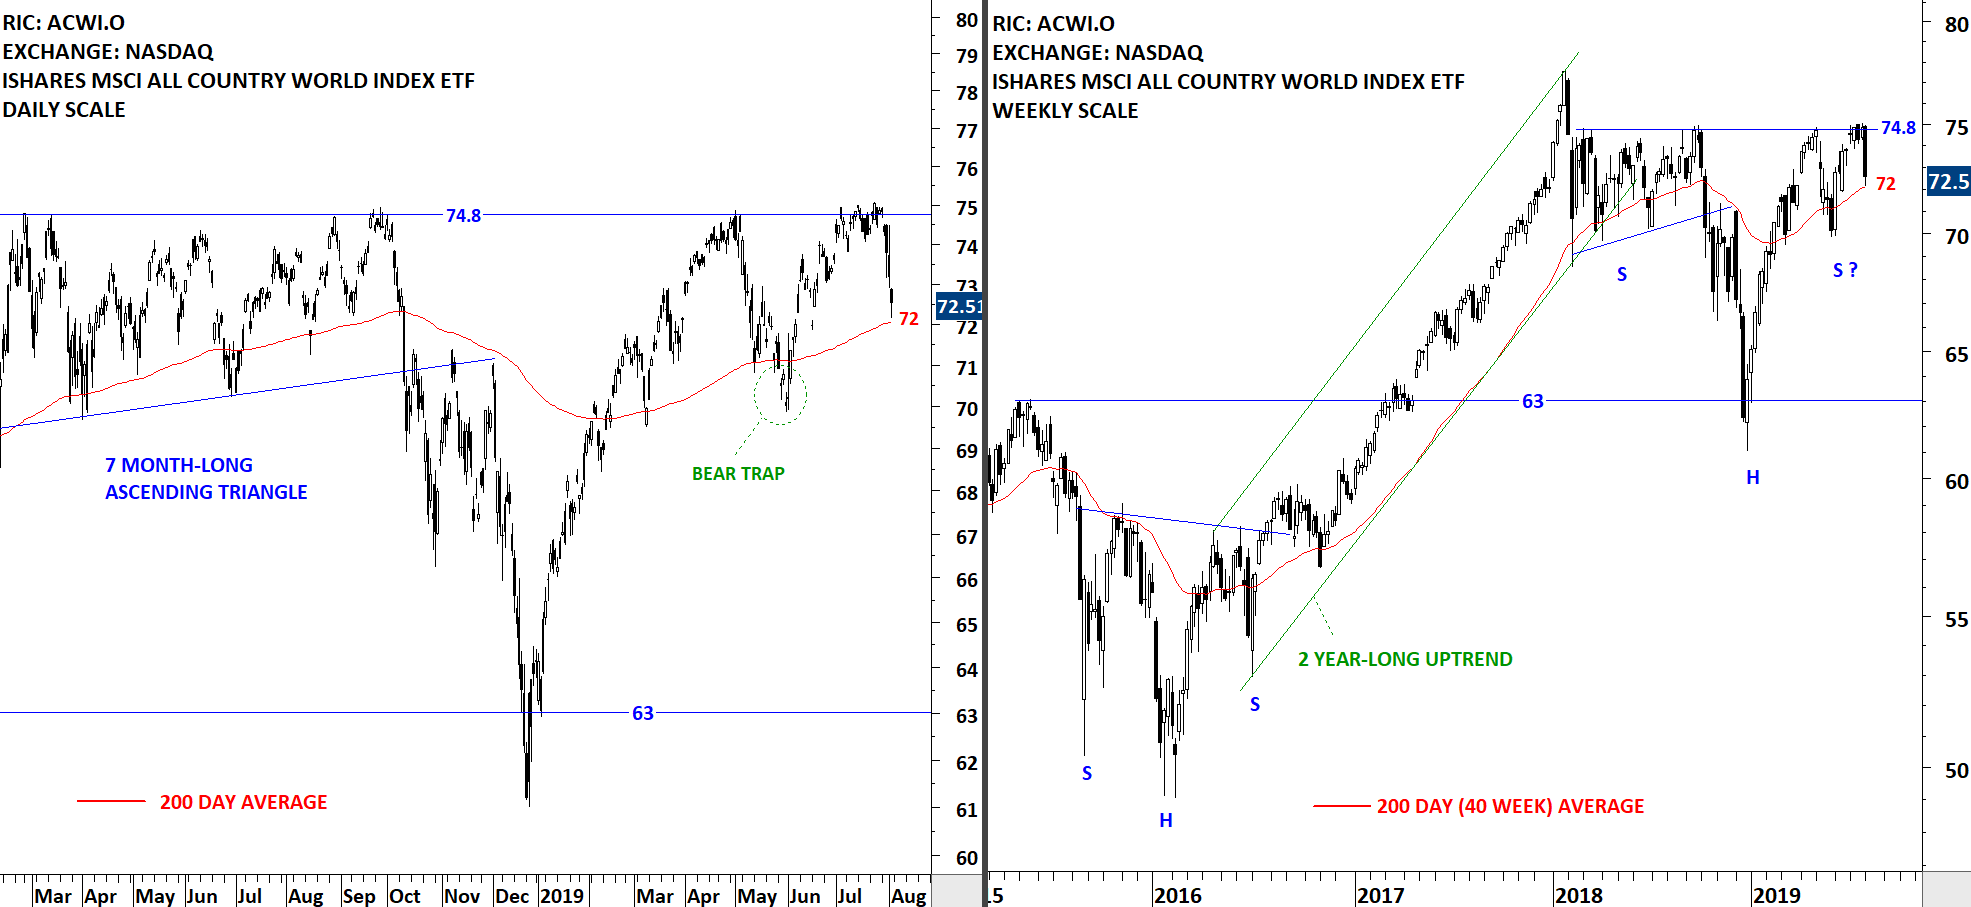
The benchmark for the Global equity markets performance, the iShares MSCI All Country World Index ETF (ACWI.O) failed to break above the strong horizontal resistance once again. Failure to break above the strong resistance resulted in a pullback towards the long-term average at 72 levels. On Friday the ETF tested the 200-day and closed the day off its lows. If we see the price stabilizing above the support at 72, the new trading range can become 72 and 74.8. Failure to hold above the 200-day can result in a larger scale correction. Next support is at 70 levels.
 Read More