Posts

SOUTH AFRICA ALL SHARE INDEX

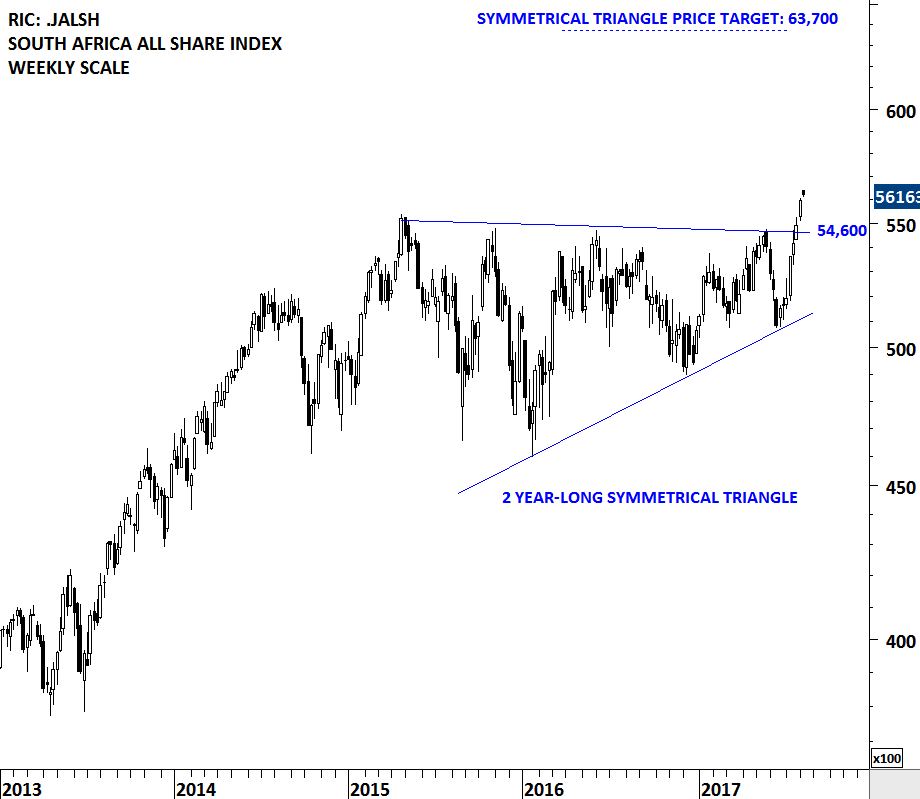
South Africa equities are possibly entering into a strong uptrend with the completion of a 2 year-long sideways consolidation. Last week's price action breached the multi-year trend resistance on the South Africa All Share index and pushed the local equity benchmark to all-time highs. Breakouts from multi-year consolidations usually result in multi-month trends. 54,600 levels will remain as strong support. Possible chart pattern price target for the South Africa All Share Index stands at 63,700 levels.

There are several tradable ETFs listed on the local exchange and also on the global exchanges. Below is a chart of South Africa listed ETF.

Read More

GLOBAL EQUITY MARKETS – May 20, 2017


The Russell 2000 Index is the recognized benchmark measuring the performance of the small-cap segment of the U.S. equity universe. The Russell 2000 Index is a subset of the Russell 3000 Index, representing approximately 10% of the total market capitalization of that index. It includes 2000 of the smallest securities based on a combination of market cap and current index membership. The index is maintained by FTSE Russell, a subsidiary of the London Stock Exchange Group. The Russell 2000 is by far the most common benchmark for mutual funds that identify themselves as "small-cap", while the S&P 500 index is used primarily for large capitalization stocks.

RUSSELL 2000 INDEX (.RUT)

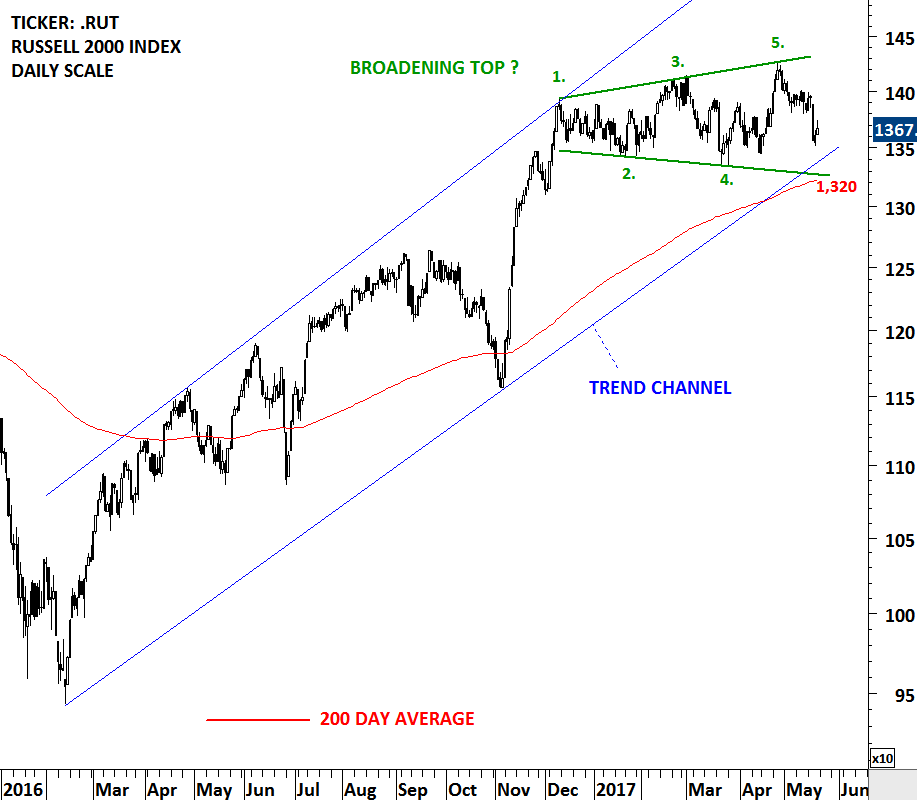
Since the beginning of 2017, the small-cap segment of the U.S. equities had a volatile price action. The swings on the Russell 2000 index possibly formed a very rare chart pattern called a Broadening Top. Richard W. Schabacker in his book Technical Analysis and Stock Market Profits explains the Broadening Top chart pattern as below:

Read More

GLOBAL EQUITY MARKETS – May 13, 2017

Reminder:  Just one week left until our Founding Member launch on May 22nd!


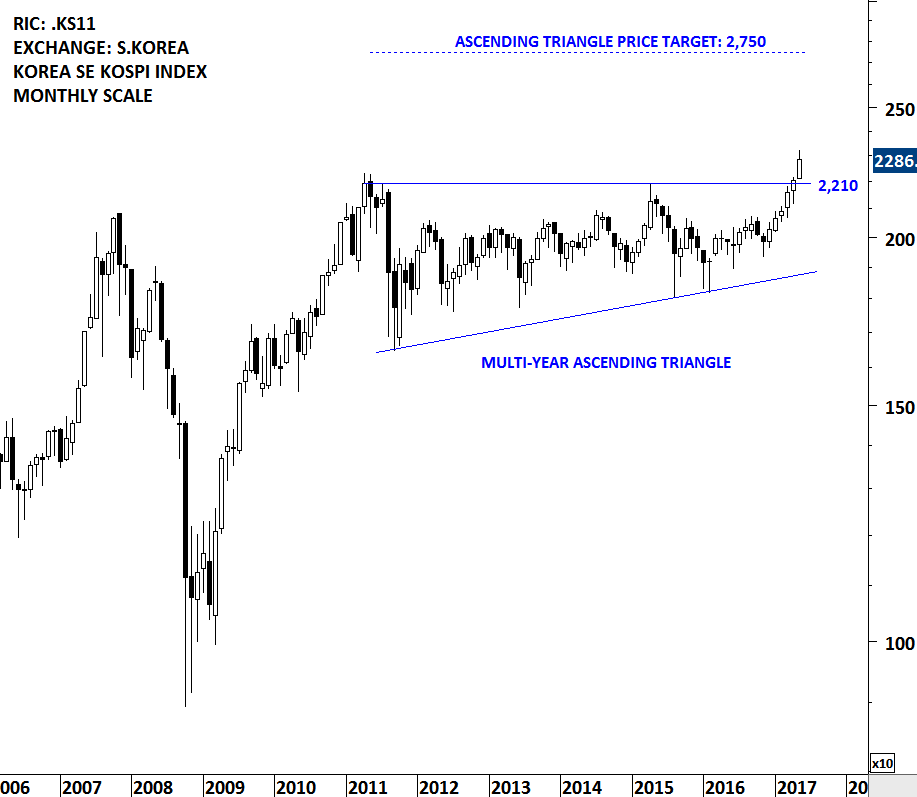
It has been a strong week for equities in emerging Asia and also a strong start for the month of May. South Korea KOSPI index is breaking out to all-time highs by clearing its 6 year-long horizontal resistance at 2,210 levels. The index possibly formed a multi-year long bullish ascending triangle. A strong monthly close will signal positive performance for the coming months. The ascending triangle chart pattern price target stands at 2,750 levels. Emerging Asia is a big component in the MSCI Emerging Markets index. As of May 11, 2017 the top 3 counties in the index are China (26.92%), S.Korea (15.34%) and Taiwan (12.20%).

While the local currency stock market index South Korea KOSPI is breaking out to all-time highs, the U.S. Dollar denominated MSCI S.KOREA price index is few percentage points away from reaching new all-time high levels. The price action is clearly positive. The 9 year-long downward sloping trend line is standing at 460 levels. MSCI S.KOREA index is trying to break out of its multi-year sideways consolidation range.

Read More

GLOBAL EQUITY MARKETS – May 13, 2017


It has been a strong week for equities in emerging Asia and also a strong start for the month of May. South Korea KOSPI index is breaking out to all-time highs by clearing its 6 year-long horizontal resistance at 2,210 levels. The index possibly formed a multi-year long bullish ascending triangle. A strong monthly close will signal positive performance for the coming months. The ascending triangle chart pattern price target stands at 2,750 levels. Emerging Asia is a big component in the MSCI Emerging Markets index. As of May 11, 2017 the top 3 counties in the index are China (26.92%), S.Korea (15.34%) and Taiwan (12.20%).

While the local currency stock market index South Korea KOSPI is breaking out to all-time highs, the U.S. Dollar denominated MSCI S.KOREA price index is few percentage points away from reaching new all-time high levels. The price action is clearly positive. The 9 year-long downward sloping trend line is standing at 460 levels. MSCI S.KOREA index is trying to break out of its multi-year sideways consolidation range.

Read More