REVIEW
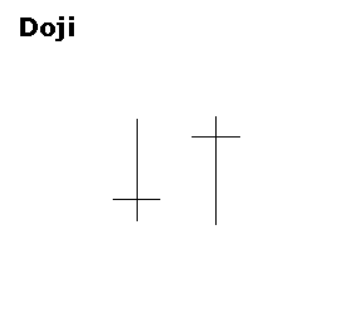 Doji form when a security's open and close are virtually equal. The length of the upper and lower shadows can vary and the resulting candlestick looks like a cross, inverted cross or plus sign. Alone, doji are neutral patterns. Any bullish or bearish bias is based on preceding price action and future confirmation. Doji convey a sense of indecision or tug-of-war between buyers and sellers. Prices move above and below the opening level during the session, but close at or near the opening level. The result is a standoff. The relevance of a doji depends on the preceding trend or preceding candlesticks. After an advance, or long white candlestick, a doji signals that the buying pressure is starting to weaken. After a decline, or long black candlestick, a doji signals that selling pressure is starting to diminish. Doji indicate that the forces of supply and demand are becoming more evenly matched and a change in trend may be near. Doji alone are not enough to mark a reversal and further confirmation may be warranted.
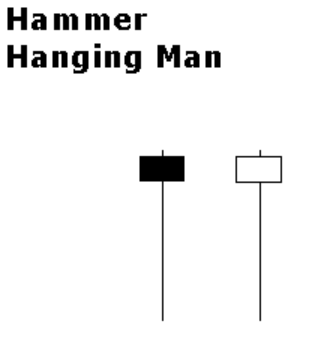 The Hammer and Hanging Man look exactly alike, but have different implications based on the preceding price action. Both have small real bodies (black or white), long lower shadows and short or non-existent upper shadows. As with most single and double candlestick formations, the Hammer and Hanging Man require confirmation before action.
Hammer is a bullish reversal pattern that forms after a decline. In addition to a potential trend reversal, hammers can mark bottoms or support levels. After a decline, hammers signal a bullish revival. The low of the long lower shadow implies that sellers drove prices lower during the session. However, the strong finish indicates that buyers regained their footing to end the session on a strong note. While this may seem enough to act on, hammers require further bullish confirmation. Confirmation could come from a gap up or long white candlestick.
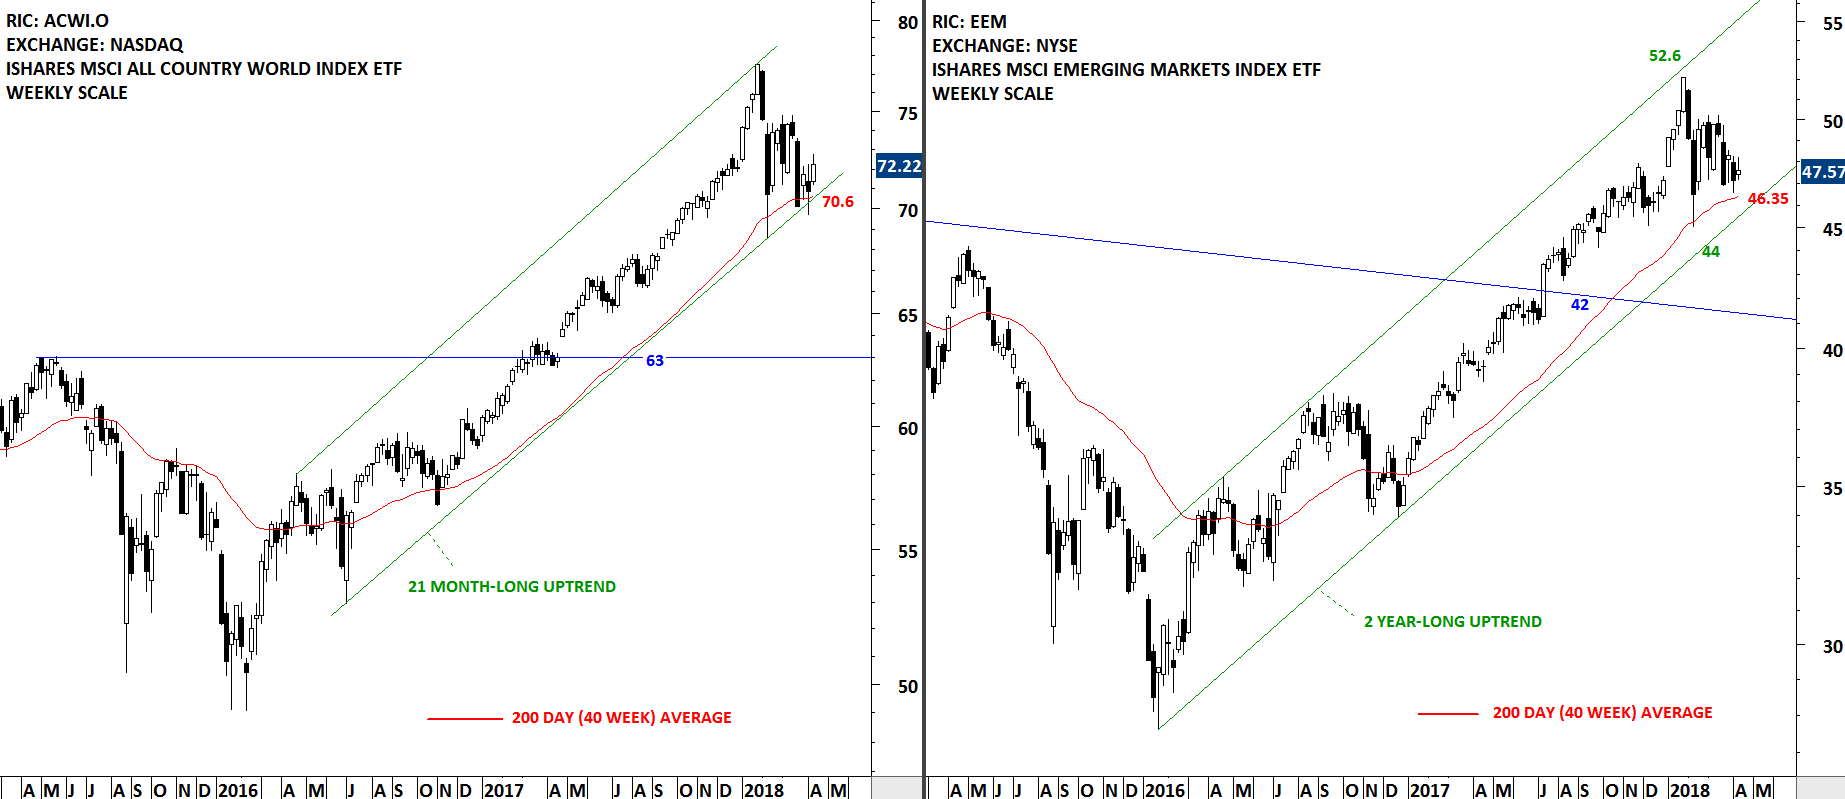
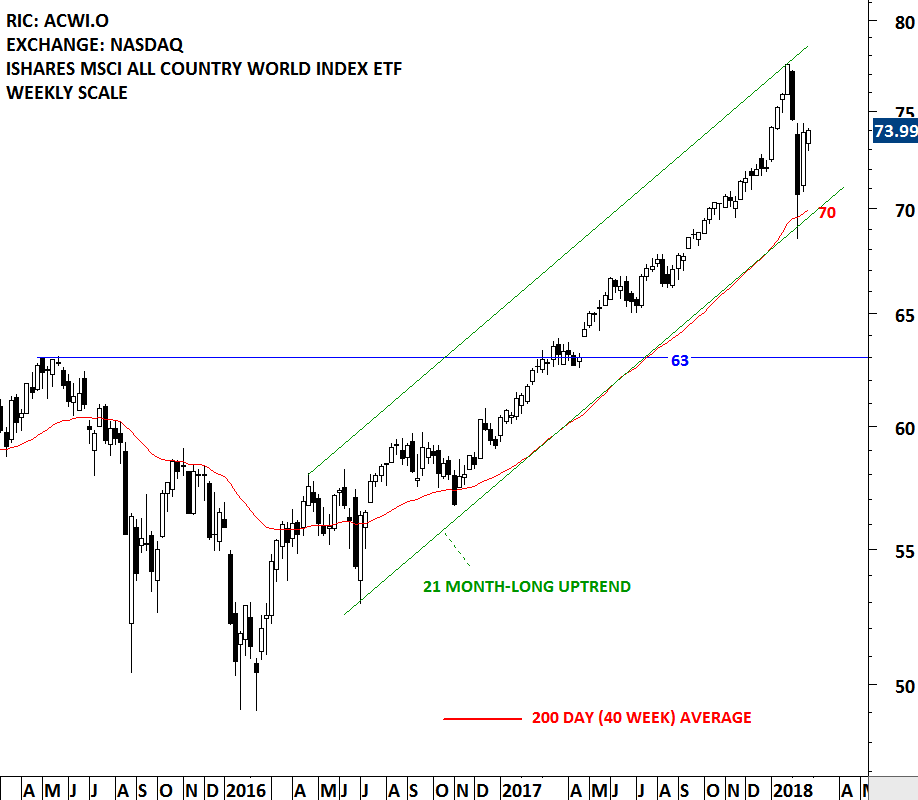
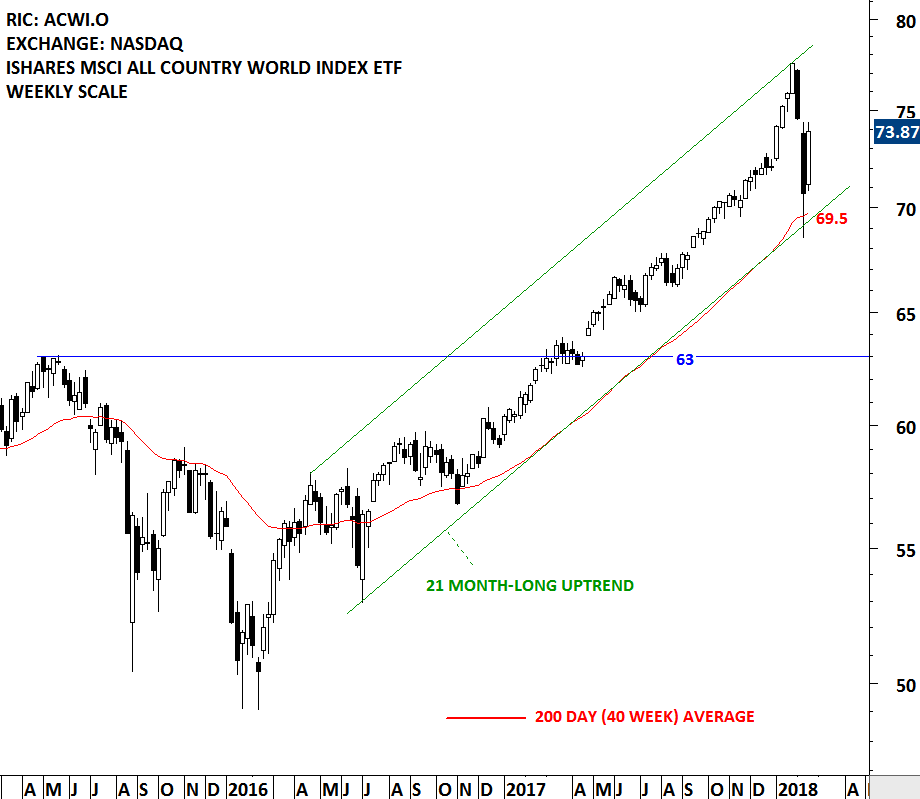
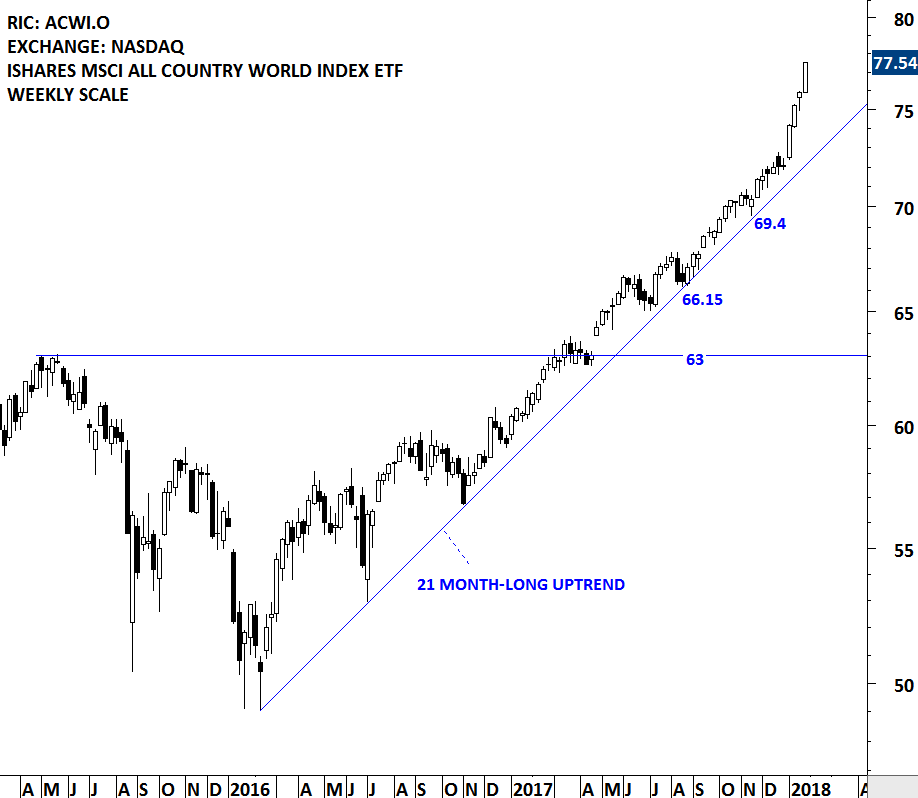
After the sharp sell-off in the beginning of 2018, Global equity markets started consolidating in a tight range. During the last quarter's consolidation, volatility dropped. Both the iShares MSCI All Country World Index ETF, a benchmark for Global Equity Markets performance and the iShares MSCI Emerging Markets Index ETF, a benchmark for Emerging Markets performance, have settled above their long-term moving averages. Price action above the long-term moving average and in the up trend channel suggest that the multi-month long uptrends are still intact on both ETFs .
Read More


 I really enjoyed our conversation with Caroline Stephen, the host of Talking Trading. We discussed Technical Analysis, Classical Charting and my charting and trading experience in the Middle East & North Africa markets.