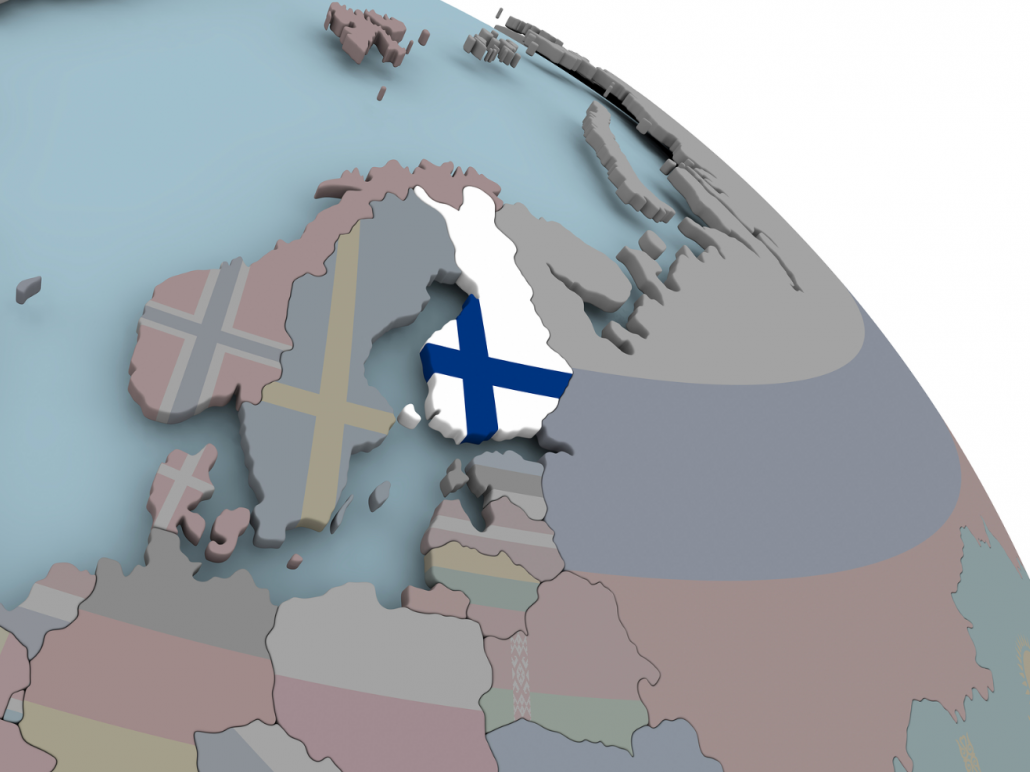
FINLAND OMX HELSINKI 25 INDEX
Every week Tech Charts Global Equity Markets report features some of the well-defined, mature classical chart patterns under a lengthy watchlist and the chart pattern breakout signals that took place during that week. Global Equity Markets report covers single stocks from developed and emerging markets, ETF’s and global equity indices. The report starts with a review section that highlights the important chart developments on global equity benchmarks. This blog post features short and long-term analysis of Finland equity benchmarks and ETF from the review section of the latest weekly Global Equity Markets report.
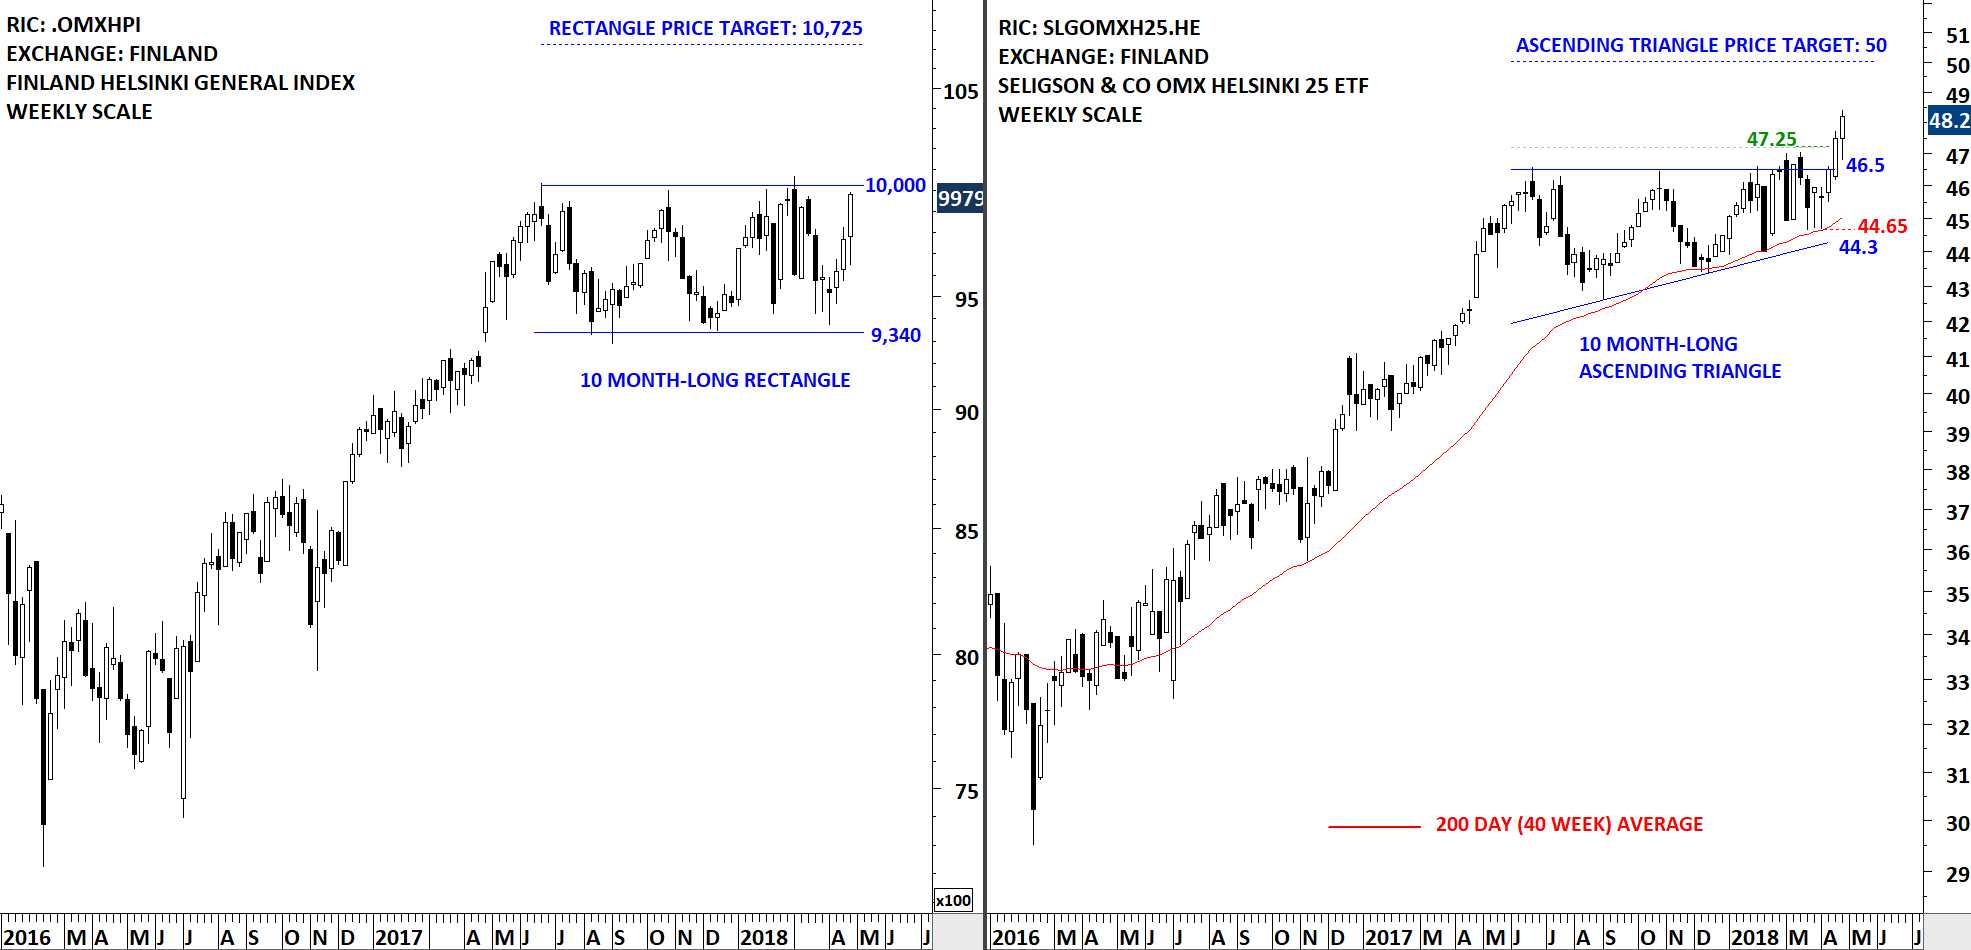
Finland Helsinki General Index is possibly forming a 10 month-long rectangle with the boundaries between 10,000 and 9,340 levels. The upper boundary of the multi-month long rectangle was tested several times over the course of the chart pattern. A breakout can be very positive for Finland equities. Breakouts from rectangle chart patterns are usually reliable. The OMX Helsinki 25 Index is composed of 25 companies and the index is trying to breakout to all time highs. The Seligson & CO OMX Helsinki 25 ETF that is listed on the Helsinki Stock Exchange tracks the OMX Helsinki 25 Index. It was featured in the Breakout Alerts section in the previous report. The ETF is an efficient way to take advantage of breakout opportunity in Finland equities.
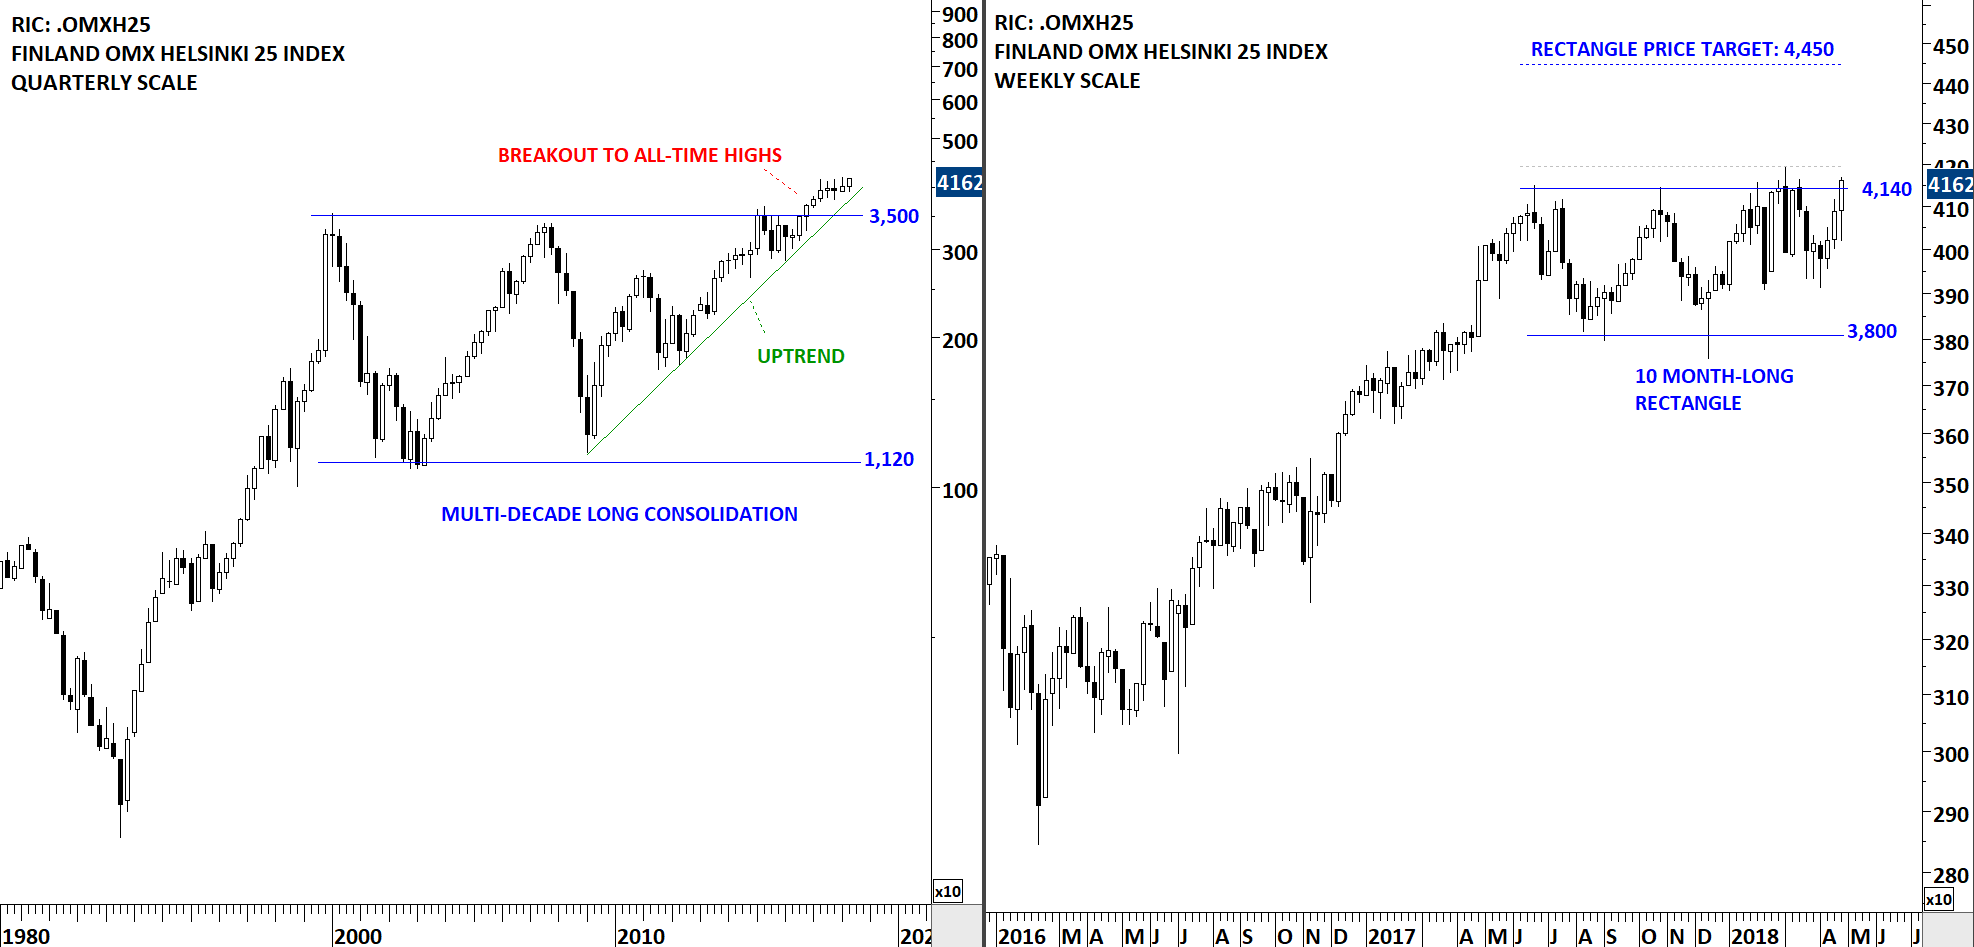
The charts below show the long-term price action for the Finland OMX Helsinki 25 Index on quarterly and weekly scale. A daily close above 4,195 levels will confirm the breakout from the 10 month-long rectangle with the possible chart pattern price target of 4,450 levels.
Tech Charts Membership

By becoming a Premium Member, you’ll be able to improve your knowledge of the principles of classical charting.
With this knowledge, you can merge them with your investing system. In fact, some investors use my analyses to modify their existing style to invest more efficiently and successfully.

As a Premium Member of Aksel Kibar’s Tech Charts,
You will receive:
-
Global Equities Report. Delivered weekly.
-
Classical charting principles. Learn patterns and setups.
-
Actionable information. Worldwide indices and stocks of interest.
-
Risk management advice. The important trading points of each chart.
-
Information on breakout opportunities. Identify the ones you want to take action on.
-
Video tutorials. How patterns form and why they succeed or fail.
-
Watch list alerts. As they become available so you can act quickly.
-
Breakout alerts. Usually once a week.
-
Access to everything (now and as it becomes available)o Reports
o Videos and video series -
Multi-part webinar course. You learn the 8 most common charting principles.
-
Webinars. Actionable and timely advice on breaking out chart patterns.
For your convenience your membership auto renews each year.


