Wishing everyone a healthy and prosperous new year. I would like to finalize the blog posts in 2016 with some of the good chart set-ups in the Emerging Markets that are likely to resolve into trends in 2017. A detailed update on Developed Markets will follow in the first week of the new year.
ISHARES MSCI EMERGING MARKETS ETF (EEM)
ISHARES EMERGING MARKETS ETF listed in the NYSE is trying to rebound from 34 levels with a positive divergence on the MACD. The big question is will this prove to be a double bottom and put a medium-term low for the emerging markets. If yes, the implication is positive at least for the first half of 2017. For now we can say that EEM is forming a range between 34 and 36.5.
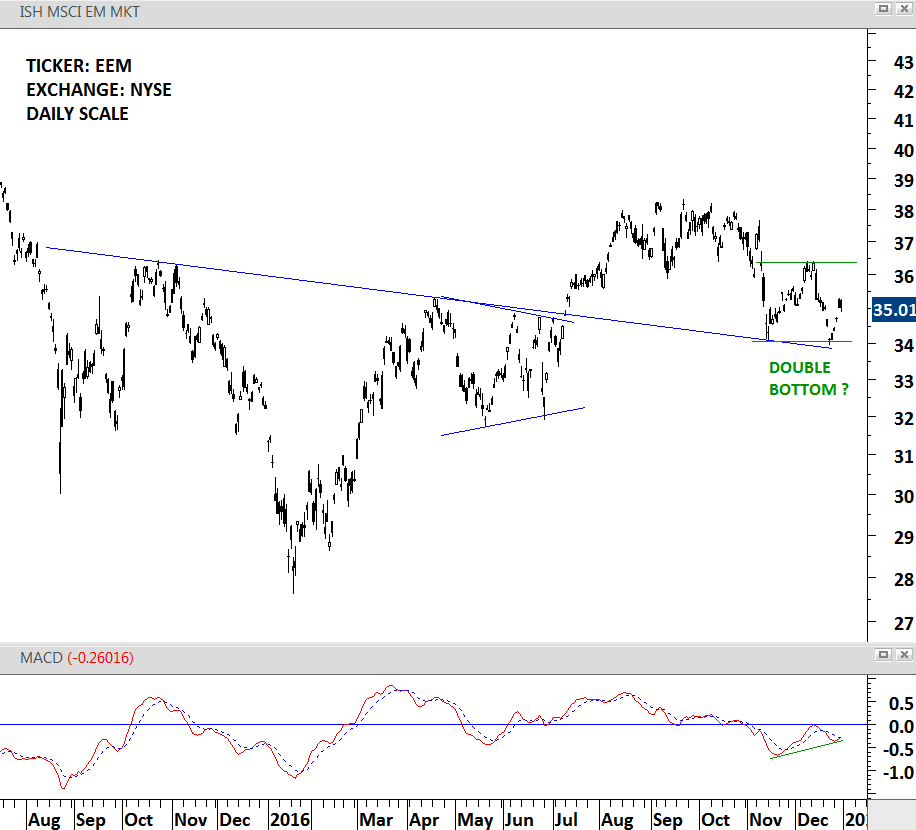
ISHARES EM – DAILY SCALE
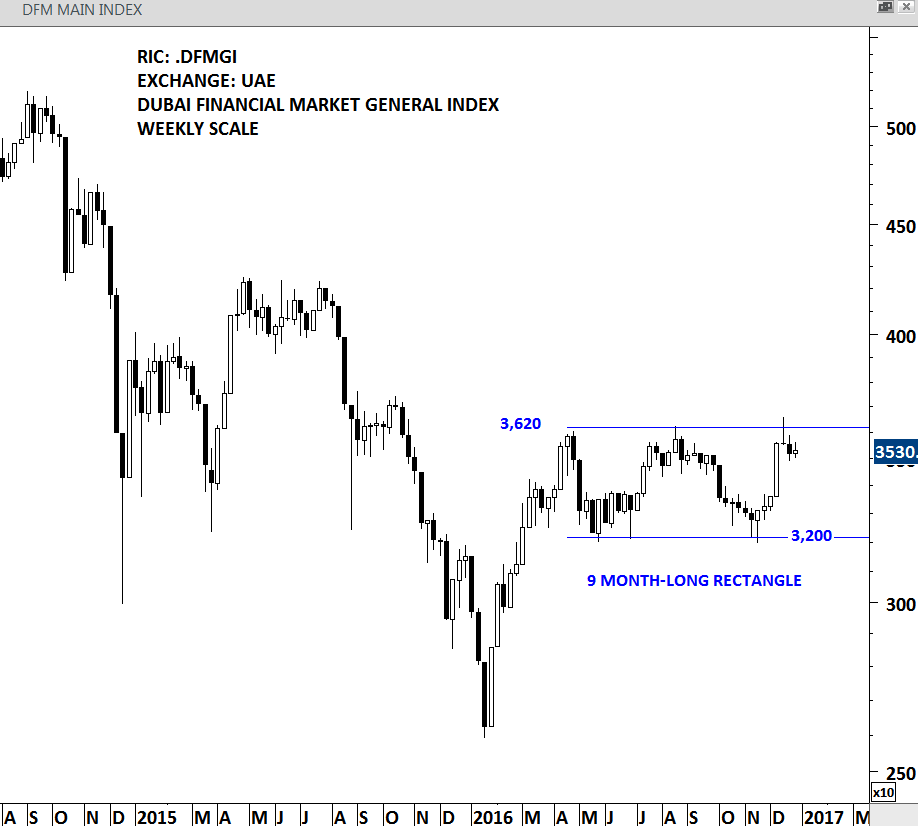
DUBAI FINANCIAL MARKET GENERAL INDEX (.DFMGI)
DUBAI FINANCIAL MARKET GENERAL INDEX is forming a 9 month-long rectangle. The boundaries stand at 3,200 and 3,620. 3,620 was tested for 3 times over the past 9 months. Rectangle is usually considered to be a continuation chart pattern. This implies a possible breakout on the upside. Breakout above 3,620 levels can result in an upward momentum for the UAE equities in 2017.
DFMGI – WEEKLY SCALE
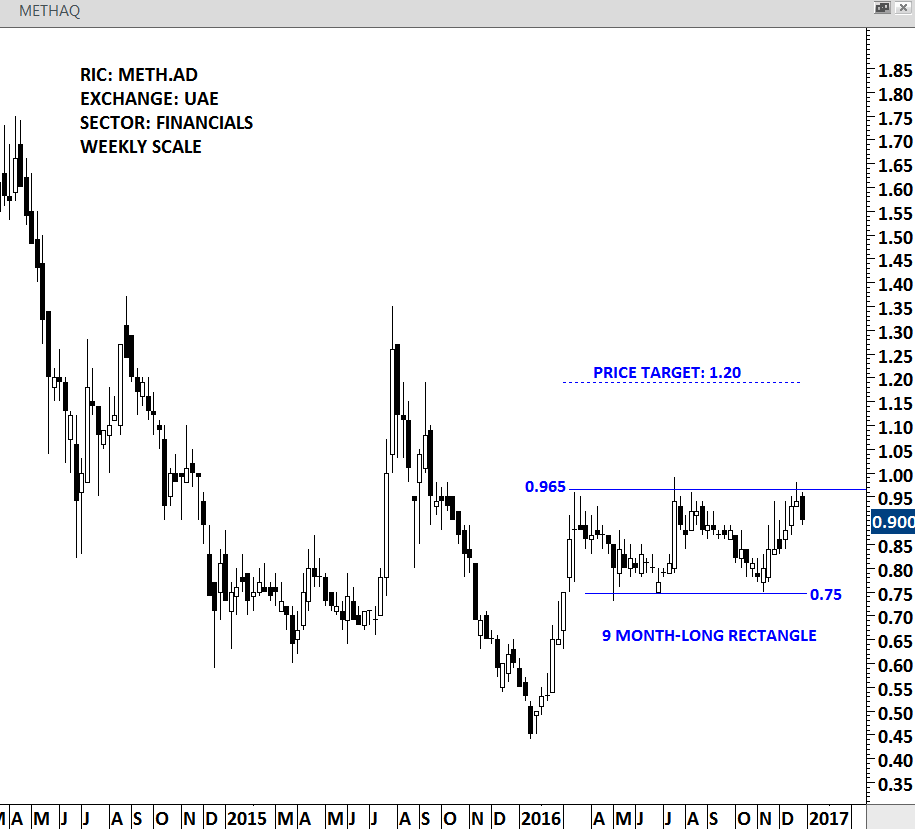
METHAQ (METH.AD)
METHAQ is an insurance company listed in the UAE exchanges. A similar chart pattern is developing on the stock price. A well-defined 9 month-long rectangle has boundaries between 0.965 and 0.75. Breakout above 0.965 will suggest higher prices with a chart pattern initial price target of 1.20. Inefficiencies in some of the emerging markets usually result in uninterrupted trend periods. Breakouts from these type of well-defined trading ranges can be very rewarding.
METHAQ – WEEKLY
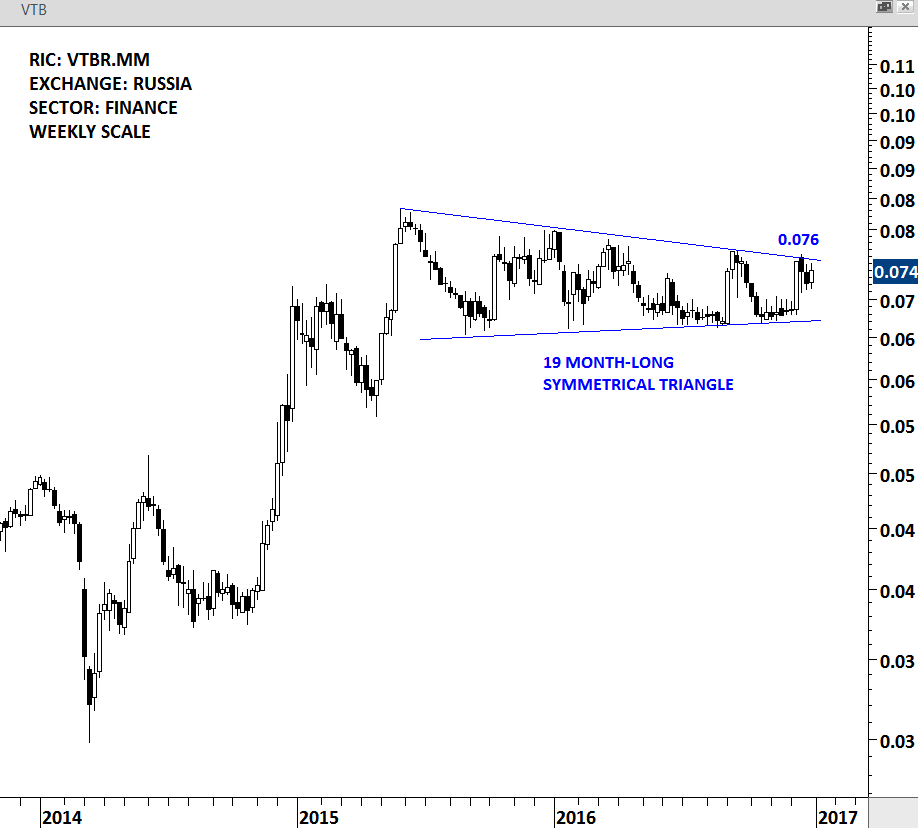
BANK VTB PAO (VTBR.MM)
Bank VTB PAO is a Russia-based company, which is engaged in commercial banking sector. Price chart of the stock is forming a 19 month-long symmetrical triangle. While the stock trades in decimal units, the width of the symmetrical triangle has now reduced to 12% range. Breakout from the lengthy consolidation can result in a strong trend period. Emerging market funds and traders/investors who are active in Russia should benefit from a possible upward breakout.
BANK VTB – WEEKLY SCALE
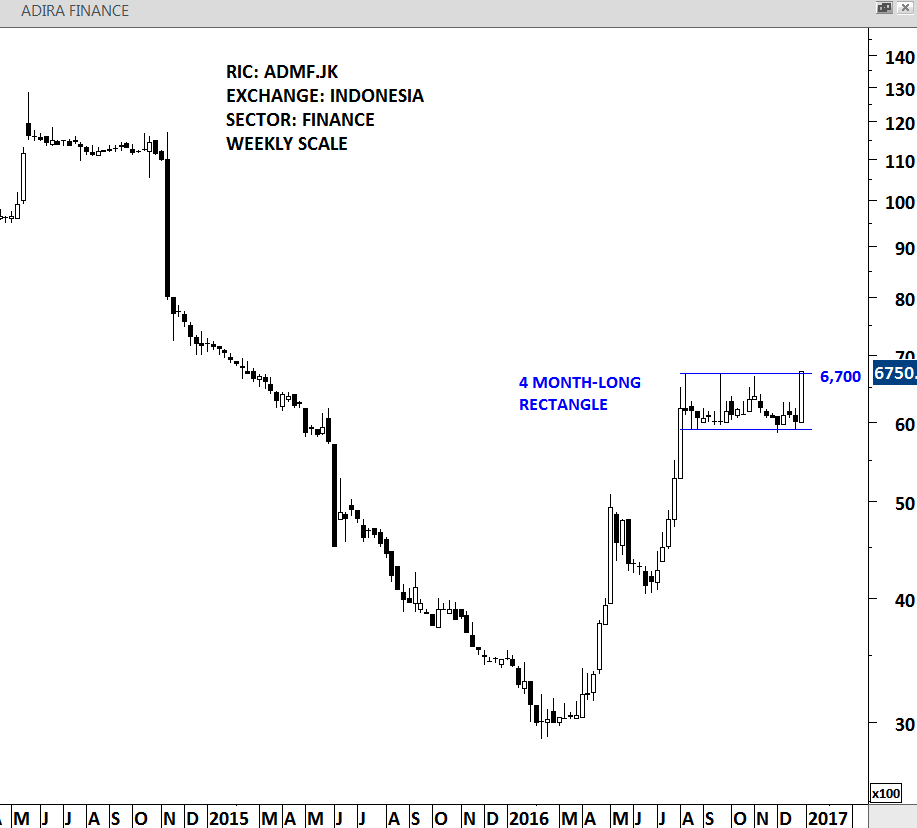
ADIRA FINANCE (ADMF.JK)
Adira Finance is a conventional consumer financing company listed in Indonesia. Stock price is recovering from its losses in 2015 and the uptrend that started in 2016 can still have legs. Over the past 4 months price formed a rectangle continuation. Strong breakout from the 4 month-long sideways consolidation can result in a positive first quarter for the stock. Rectangle price target is at 7,600 levels.
ADIRA FINANCE – WEEKLY SCALE
PEKAO BANK (PKO.WA)
BANK POLSKI SA is a Poland-based commercial bank. It is listed in Warsaw Stock Exchange with USD 8.3 billion market cap. Stock price is forming a year-long base formation. The chart pattern can be identified as a complex H&S bottom. A daily close above 28.60 will confirm the breakout from the year-long bottom reversal.
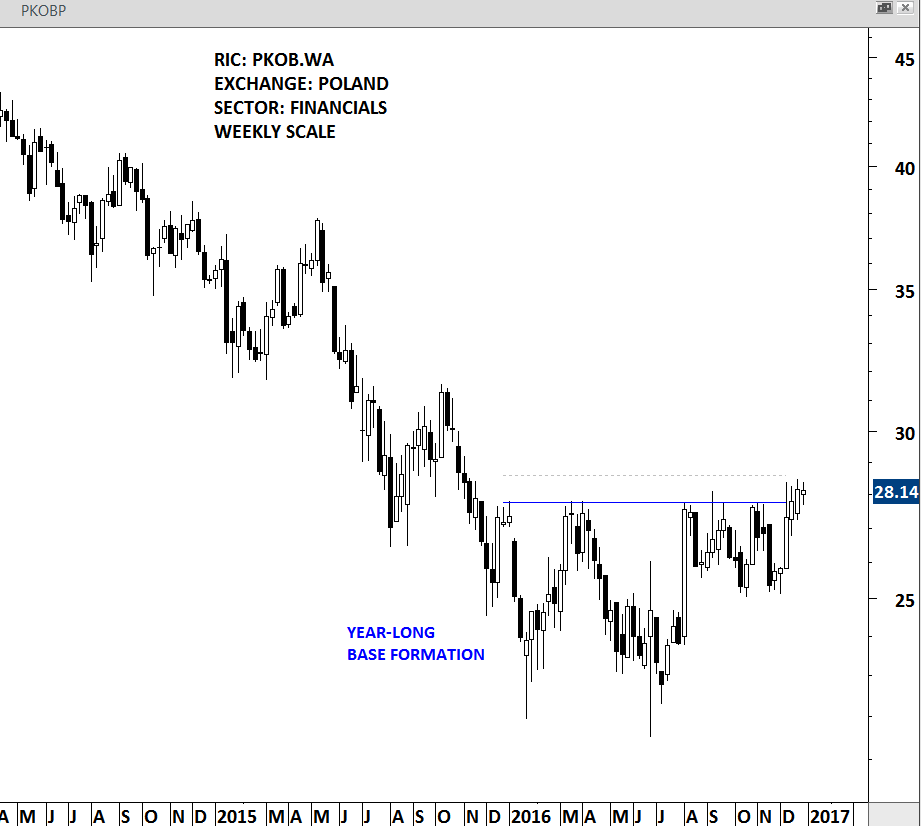
PEKAO BANK – WEEKLY SCALE
AKBANK is a commercial bank listed in Istanbul Stock Exchange. Several financial companies including the benchmark equity index in Turkey has similar chart pattern development. AKBANK is forming a 3 year-long symmetrical triangle which is now very close to a possible breakout. 8.5 level is the upper boundary of the long-term consolidation range. A positive development is taking place worth mentioning on the daily scale charts. 2 month-long H&S bottom is possibly forming with the neckline standing at 8.0 levels. Both the daily and the weekly scale charts have positive implications for the new year.
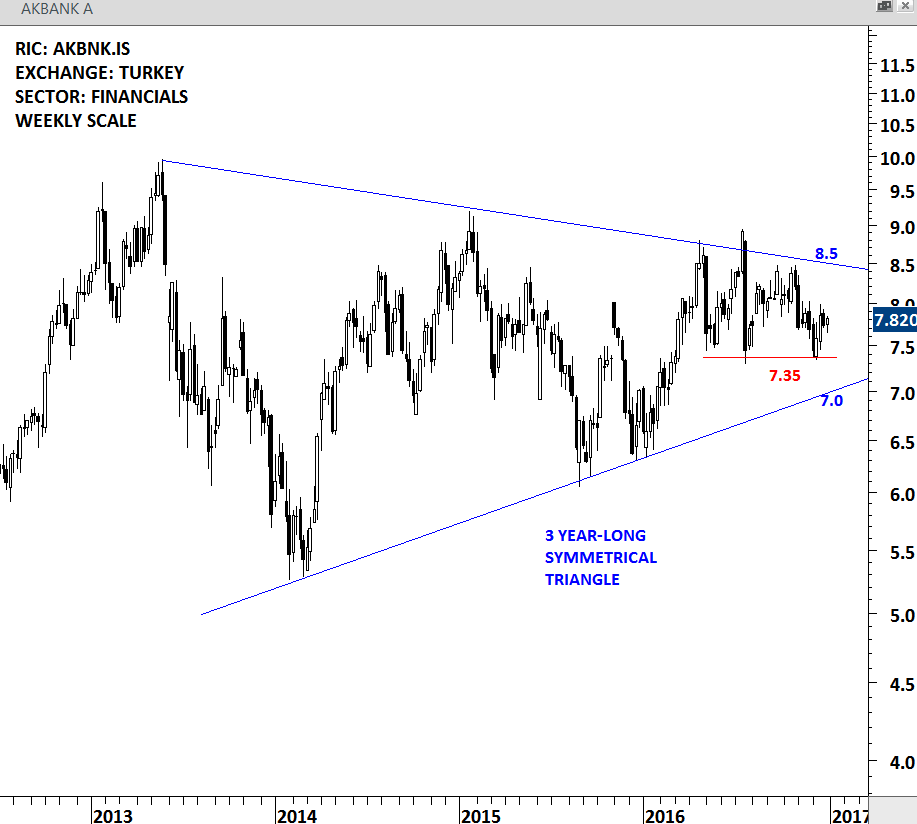
AKBANK – WEEKLY SCALE
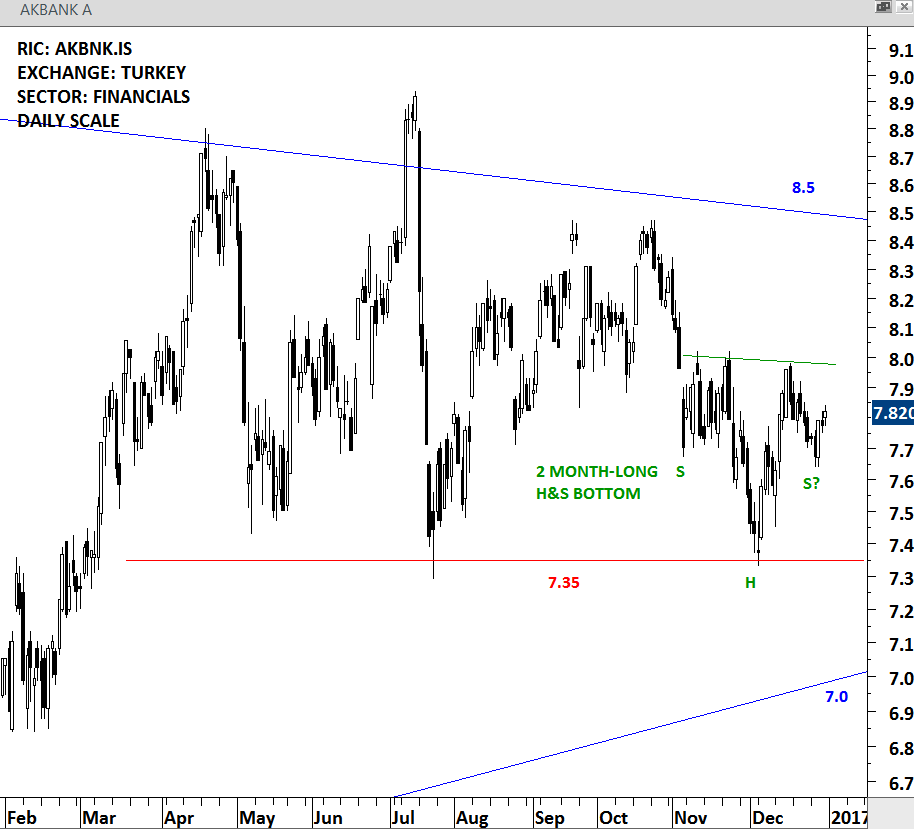
AKBANK – DAILY SCALE
SK TELECOM CO. LTD. provides wireless telecommunications in Korea. developing chart pattern on this stock has two interpretations. The bullish interpretation is that the stock is forming a year-long ascending triangle with the horizontal boundary standing at 233K. Ascending triangles are usually bullish chart patterns that resolve with a breakout above the horizontal boundary. Such price action will result in a massive H&S top failure and should be considered positive for SK TELECOM in 2017. The bearish interpretation is that the stock is forming a multi-year H&S top with the neckline standing at 195K. In this case the year-long ascending triangle will break on the downside resulting in a sharp sell-off towards the 195K levels. A decisive breakout from the year-long ascending triangle will take place in the following weeks.
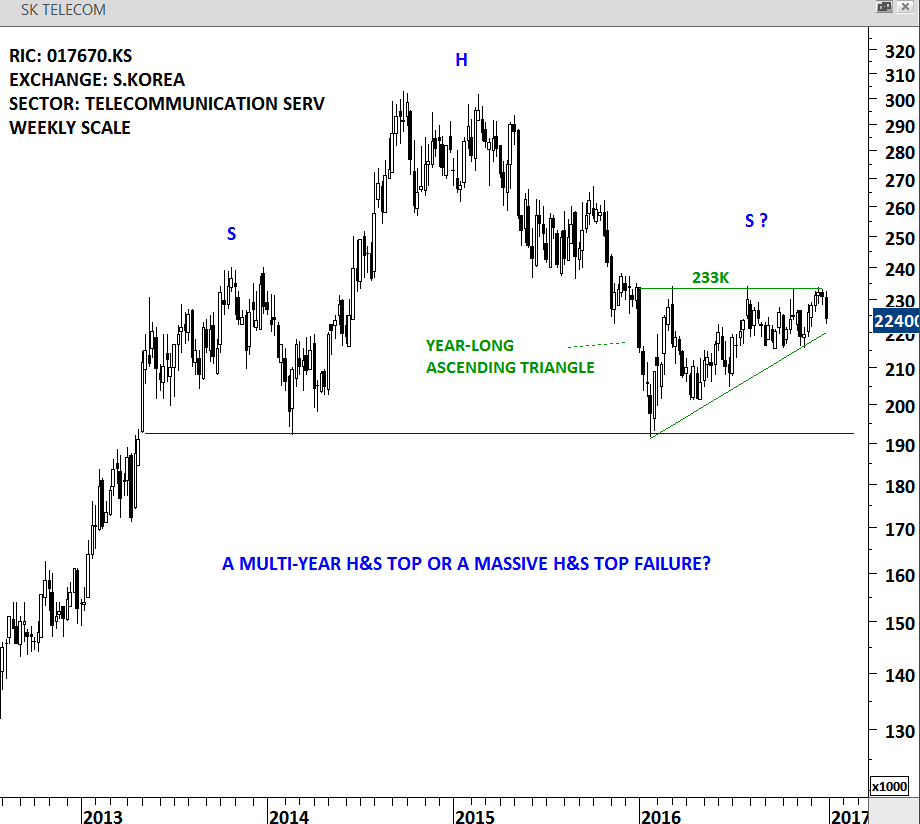
SK TELECOM – WEEKLY SCALE

 Read More