Posts

GLOBAL EQUITY MARKETS – March 10, 2018

REVIEW


A strong weekly close and especially a strong Friday price action is positive for Global equities. However, it is still early to conclude that the short term consolidation is over and we are headed to new all-time highs. I think we are still in the consolidation phase and choppy price action can continue for some time.

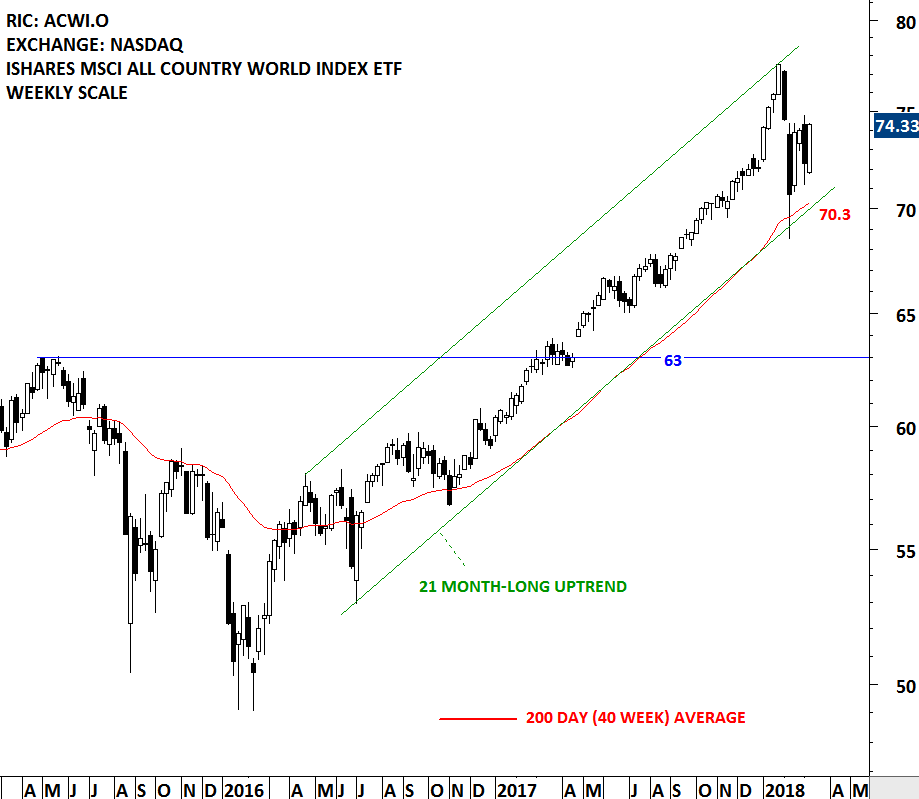
The long-term trend is upwards for the iShares MSCI All Country World Index ETF (ACWI.O). The benchmark for Global equity market performance continues to remain above its long-term average. In the short/medium-term, the ETF is in a trading range between the all-time high at 77.55 and 70 levels.

Read More

GLOBAL EQUITY MARKETS – January 13, 2018

REVIEW


Reviewing long-term charts usually helps us to be focused on the big picture. Due to day to day volatility we might lose sight of the forest for the trees. Every now and then I feature these long-term charts to check the status of the bull market in global equities. U.S. equities have been a leader in the bull market. S&P 500 Index was one of the first widely followed U.S. equity benchmark that completed the decade-long consolidation and broke out to all-time highs in 2013. Since then the index has been in a steady uptrend reaching new high ground. Taking the width of the decade long-consolidation and adding it to the breakout level in percentage terms, gives us a price target in the range of 3,000-3,150.

Read More

BREAKAWAY GAPS

Every week Tech Charts Global Equity Markets report features some of the well-defined, mature classical chart patterns under a lengthy watchlist and the chart pattern breakout signals that took place during that week. Global Equity Markets report covers single stocks from developed and emerging markets, ETF’s and global equity indices. The report starts with a review section that highlights the important chart developments on global equity benchmarks. This blog post features one of several great chart analysis from the latest Global Equity Markets report as a case study discussing the breakaway gaps.

In his book Technical Analysis and Stock Market Profits, Richard W. Schabacker discusses different kinds of price gaps. Below are some of the important points he mentions about Breakaway Gaps.

Read More

GLOBAL EQUITY MARKETS – November 4, 2017

REVIEW


If there is one theme and well-defined similar chart pattern set ups that I need to highlight, it is in the Gold and Silver mining equities. I discussed the developing chart patterns in an earlier Global Equity Markets report and the Interim update. Whenever similar chart patterns are identified on different equities in the same industry and sector, the price action becomes more important. The Tech Charts Watchlist features some of the well-defined chart setups in the gold & mining equities. In a timely manner, we have also added a new video tutorial for members on Descending Triangle as a bearish reversal chart pattern.

Read More

INTERIM UPDATE – November 3, 2017

French auto industry is showing signs of strength and offering major breakout opportunities. September 30, 2017 Global Equity Markets report featured the breakout from a multi-month base formation on the long-term price chart of PEUGEOT AS. This interim update highlights another major opportunity that is taking place in the same industry.

Read More