Posts

ERSTE GROUP BANK AG (ERST.VI)

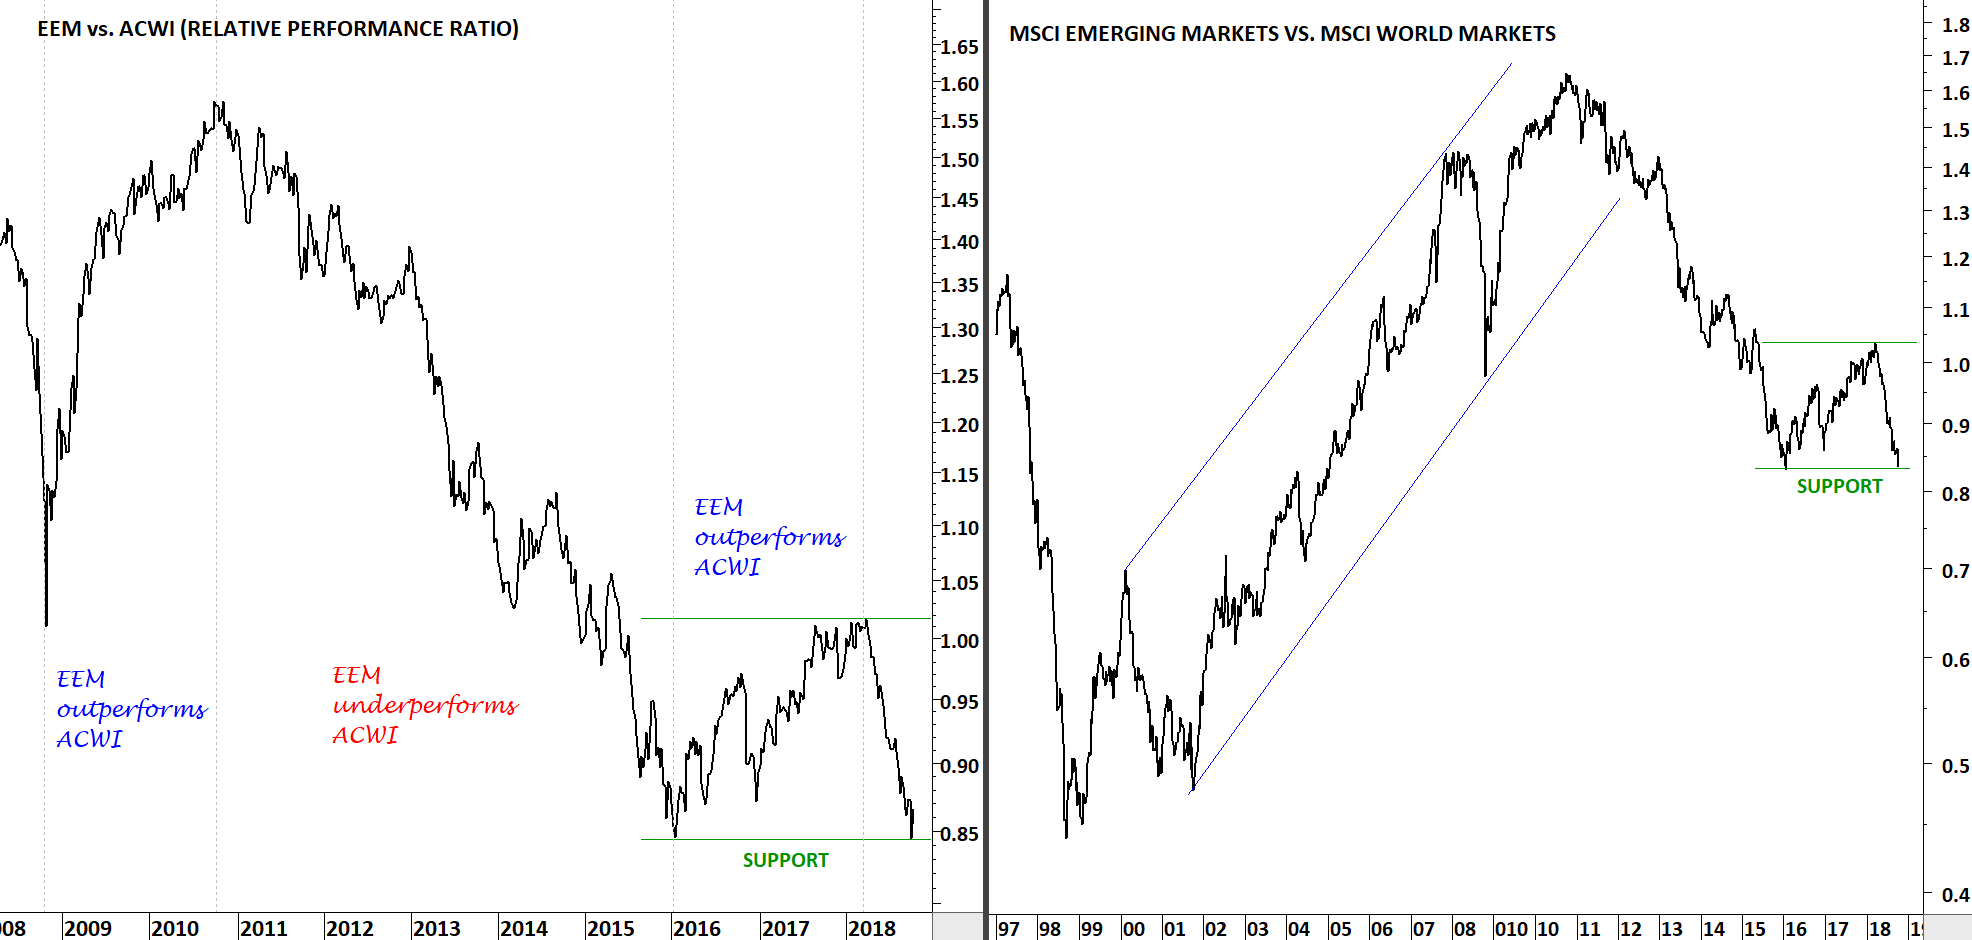
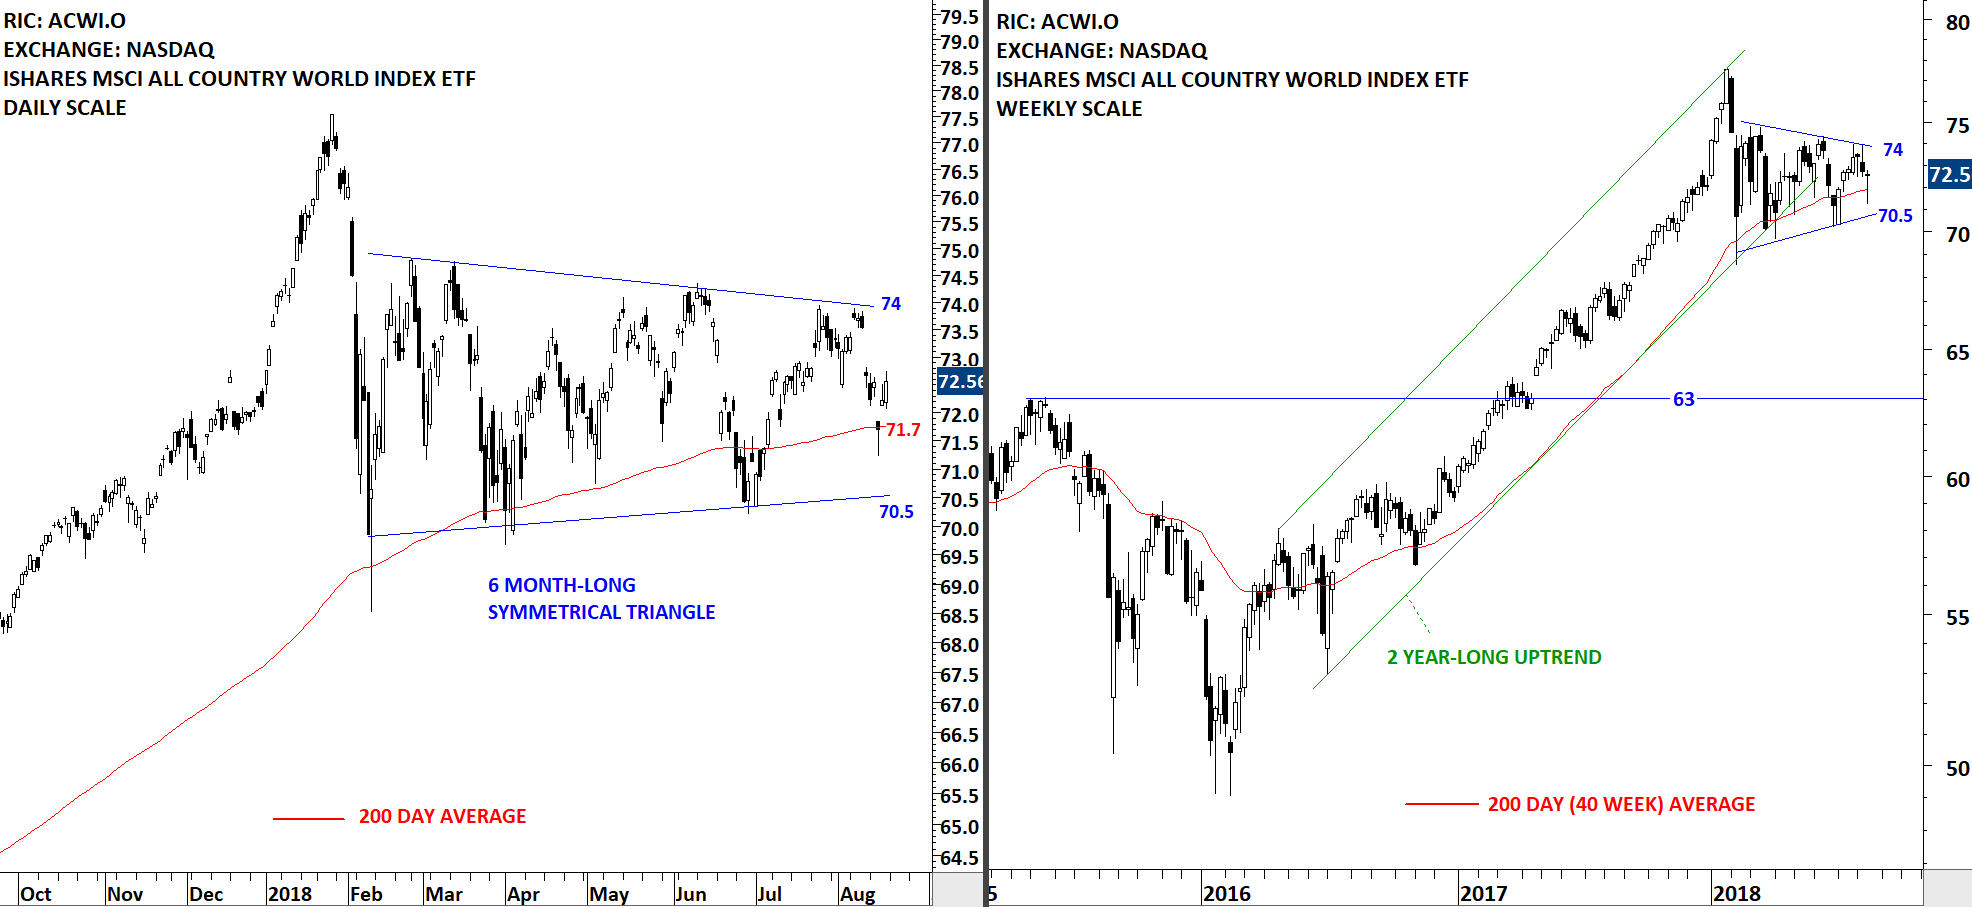
Every week Tech Charts Global Equity Markets report features some of the well-defined, mature classical chart patterns under a lengthy watchlist and the chart pattern breakout signals that took place during that week. Global Equity Markets report covers single stocks from developed, emerging and frontier markets, ETF’s and global equity indices. The report starts with a review section that highlights the important chart developments on global equity benchmarks. This blog post features a 14 month-long Head and Shoulder top reversal on the Eastern European financial services company ERSTE GROUP, featured under the watchlist. In the second part of the blog post I discuss what I regard as text book H&S top chart pattern and their qualities.

Read More

GLOBAL EQUITY MARKETS – October 13, 2018

REVIEW


Since the beginning of 2018, the performance between Emerging Markets and Developed Markets diverged. Emerging Markets have underperformed the Developed Markets by around 15%. Two charts below show the relative performance ratio between EEM and ACWI and also the MSCI indices, MSCI Emerging Markets Index vs. MSCI World Markets Index. You can see the fluctuations on the ratio over the years.

2016-2017 was a period of EM outperformance. In the beginning of 2018, the ratio reversed sharply and the past 10 months resulted in a massive underperformance for the Emerging Markets. We might be at an inflection point as the ratio is now testing 2016 lows. Emerging Markets might start outperforming the Developed Markets once again. (The ratio is calculated by dividing two time series EEM & ACWI and indexing it to 1 on the 1st January 2018)

Read More

GLOBAL EQUITY MARKETS – October 6, 2018

REVIEW


If one needs to explain what "trend less" market looks like, there is no better example other than the iShares MSCI All Country World Index ETF (ACWI.O). Since the beginning of the year the ACWI ETF is stuck in a tight range between 75 and 70. Usually a low volatility period like this is followed by a strong directional movement. ACWI ETF has strong resistance at 74.8 and support at 70.9 levels. The ETF is still holding above its long-term average.

Read More

GLOBAL EQUITY MARKETS – September 8, 2018

REVIEW


Strength in U.S. equities alone was not enough to push the iShares MSCI All Country World Index ETF (ACWI.O) out of its 6 month-long consolidation range. Few days of price action above the chart pattern boundary at 73.9 levels failed to materialize into a strong directional movement. The ETF continues to remain in a range between 70.6 and 73.9 levels. Strong support stands at 70.6 levels.

Read More

GLOBAL EQUITY MARKETS – August 18, 2018

REVIEW


Global Equity Markets continue to remain in a range. The iShares MSCI All Country World Index ETF (ACWI.O) is possibly forming a 6 month-long symmetrical triangle with the upper boundary acting as resistance at 74 and the lower boundary as support at 70.5 levels. Breakout from this lengthy consolidation range will result in a directional move.

Read More

GLOBAL EQUITY MARKETS – June 30, 2018

REVIEW


If anybody tells you, "I know what the markets will do in the following weeks" he or she might be guessing. I will try to be as objective as possible with some of the major equity benchmarks and convey the message of my chart analysis. After the Jan-Feb 2018 sell-off on the ACWI ETF, price remained range-bound. The consolidation formed a possible 4 month-long symmetrical triangle (can act a bearish continuation). Both the lower boundary of the consolidation and the 200-day (40 week) moving average formed support around the same level. After each test over the past 4 months, the ETF rebounded from the 200-day moving average.

Read More