ERSTE GROUP BANK AG (ERST.VI)
Every week Tech Charts Global Equity Markets report features some of the well-defined, mature classical chart patterns under a lengthy watchlist and the chart pattern breakout signals that took place during that week. Global Equity Markets report covers single stocks from developed, emerging and frontier markets, ETF’s and global equity indices. The report starts with a review section that highlights the important chart developments on global equity benchmarks. This blog post features a 14 month-long Head and Shoulder top reversal on the Eastern European financial services company ERSTE GROUP, featured under the watchlist. In the second part of the blog post I discuss what I regard as text book H&S top chart pattern and their qualities.
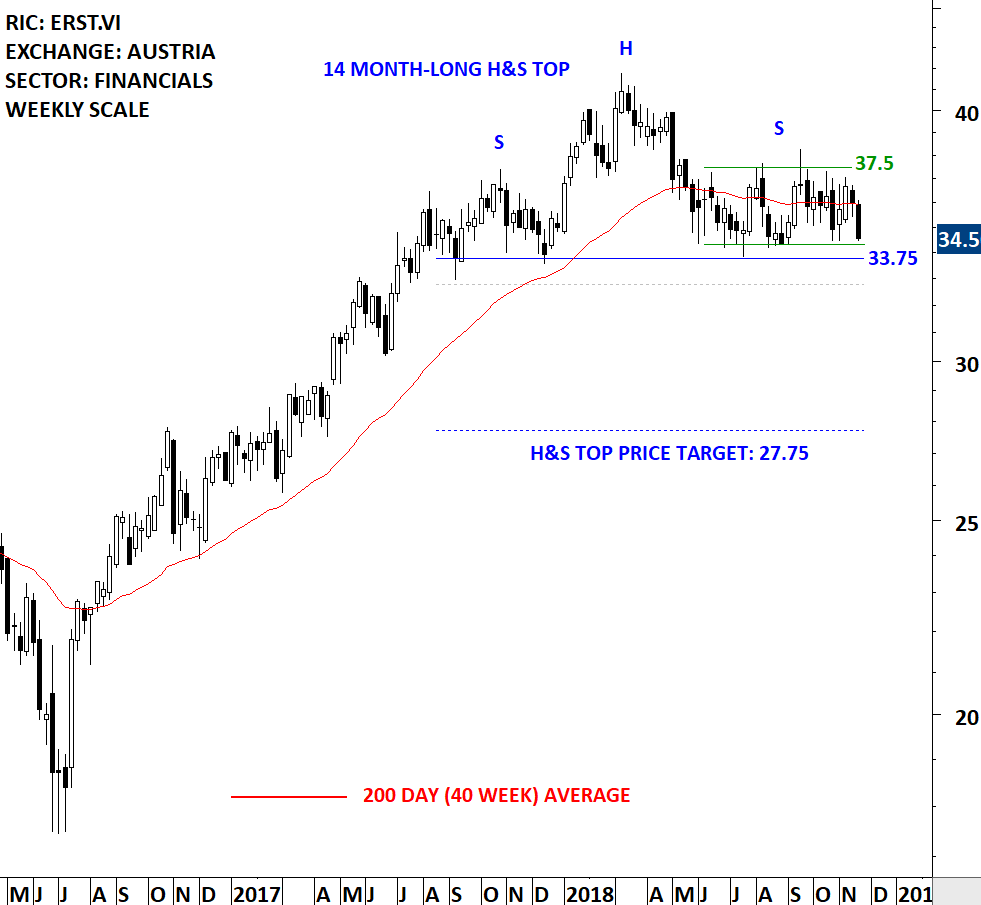
ERSTE GROUP BANK AG (ERST.VI)
Erste Group Bank AG is a savings bank. The Company offers a range of banking and other financial services, such as savings accounts, asset management (including investment funds), consumer credit and mortgage lending, investment banking, securities and derivatives trading, portfolio management, project finance, foreign trade financing, corporate finance, capital market and money market services, foreign exchange trading, leasing and factoring. The stock is listed on the Vienna Stock Exchange. Price chart formed a 14 month-long head and shoulder top with the horizontal boundary acting as strong support at 33.75 levels. The horizontal boundary (neckline) was tested several times over the course of the chart pattern. The right shoulder of the H&S top can be identified as a possible rectangle. A daily close below 32.75 levels will confirm the breakdown from the 14 month-long head and shoulder top with the possible chart pattern price target of 27.75 levels. A breach above 38 levels will negate the H&S top and put the bearish interpretation in question.
Tech Charts Global Equity Markets report features both bullish and bearish chart pattern setups. During market corrections I find more bearish chart pattern setups and highlight those under the Tech Charts watchlist. Lately, as a result of the corrective nature of price action on Global equity benchmarks, we started seeing more and more bearish reversal/continuation chart patterns. H&S top reversal is one of the widely known bearish reversal chart pattern. In the Global Equity Markets report, I feature chart patterns mostly with well-defined horizontal boundaries. I find breakouts that breach the horizontal boundary of a chart pattern being more reliable when compared with breakouts through the diagonal boundary. The reason for this is that the breakout/breakdown takes out the previous highs/lows at the same time of chart pattern completion, leaving the price with limited resistance/support ahead.
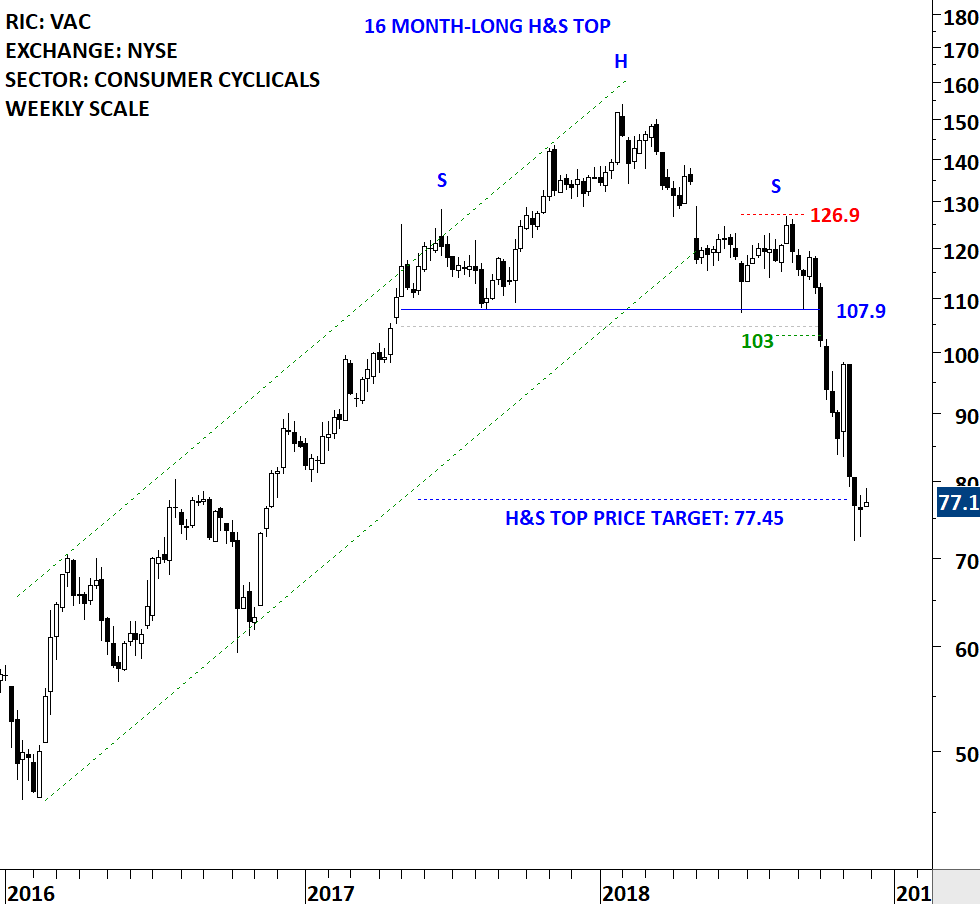
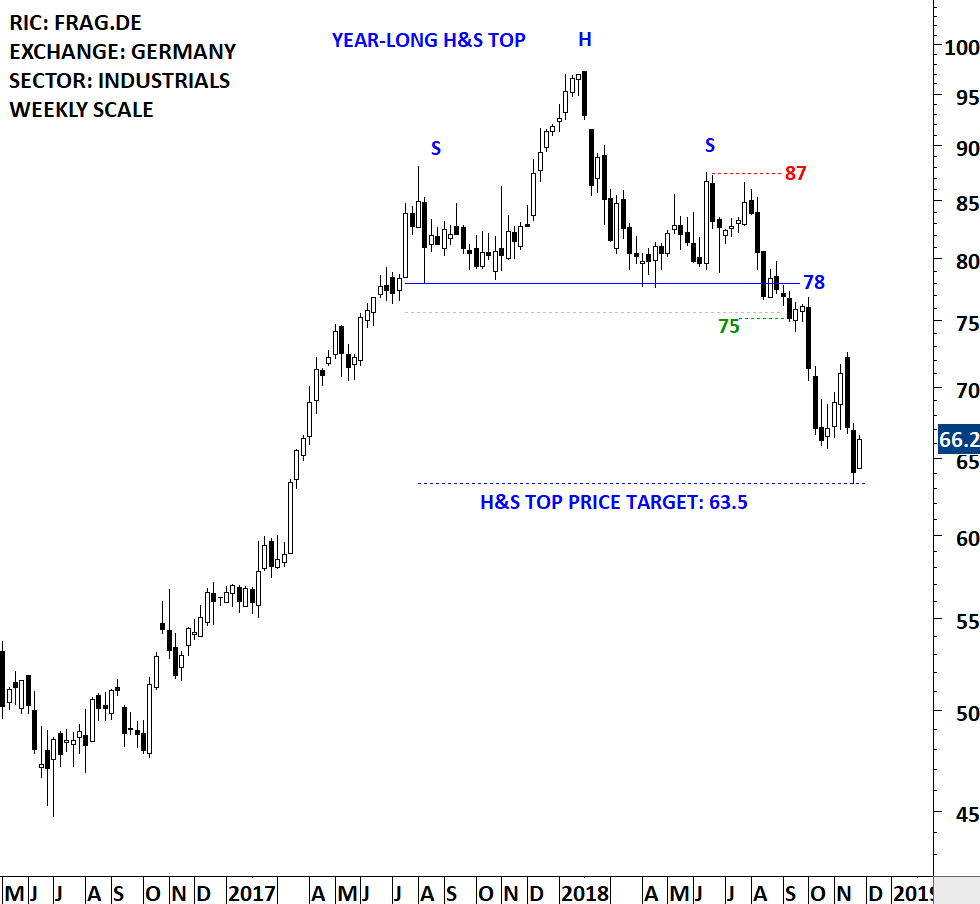
With H&S top reversal (also the same with H&S bottoms) I look for symmetry between the right and left shoulder on price and time scale. The height of each shoulder are approximately same. The time it takes for left shoulder to develop is also very close to the time it takes for right shoulder to develop. These proximity results in symmetry between the shoulders.
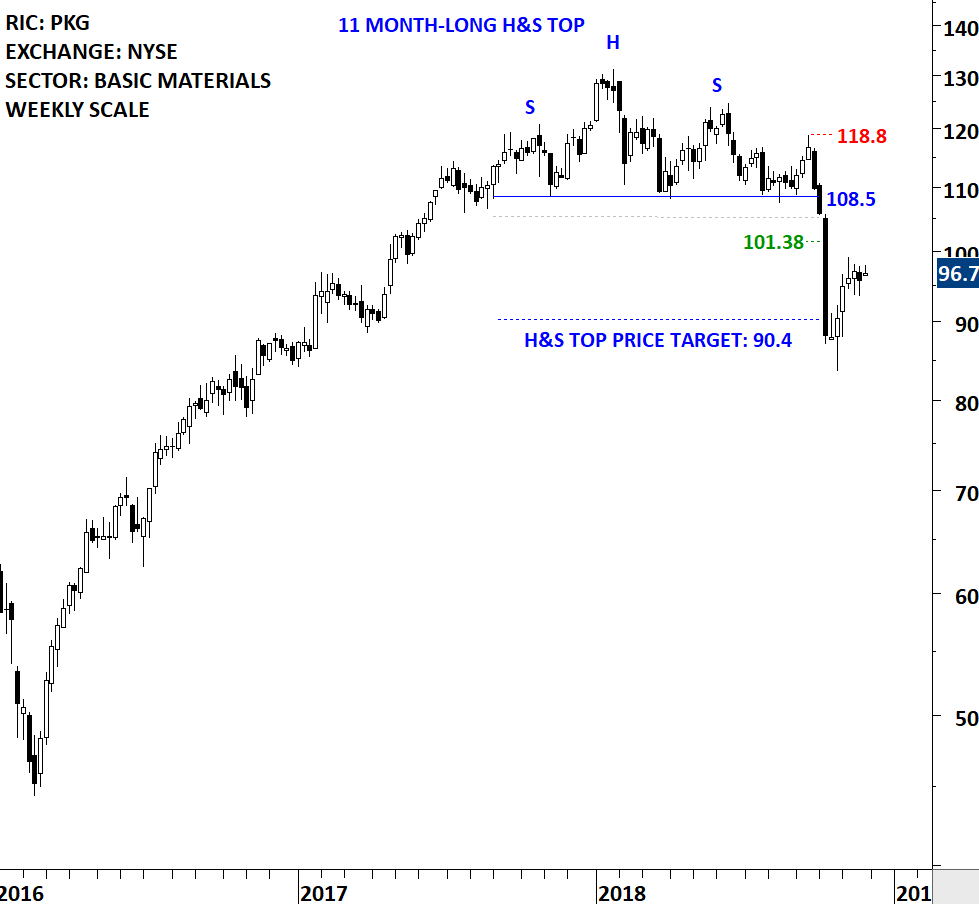
Below are some of the recent examples of H&S top chart patterns the Global Equity Markets report identified and featured under the Breakouts section. Please note that the red dashed lines are levels for chart pattern negation. The highest level for the right shoulder serves as the chart pattern negation level. Once breached on the upside, H&S top reversal and the bearish interpretation is in question. Chart pattern negation level is different than a stop loss. A stop loss will be different for each trader/investor depending on several factors (capitalization, risk profile etc.).
Tech Charts Membership

By becoming a Premium Member, you’ll be able to improve your knowledge of the principles of classical charting.
With this knowledge, you can merge them with your investing system. In fact, some investors use my analyses to modify their existing style to invest more efficiently and successfully.

As a Premium Member of Aksel Kibar’s Tech Charts,
You will receive:
-
Global Equities Report. Delivered weekly.
-
Classical charting principles. Learn patterns and setups.
-
Actionable information. Worldwide indices and stocks of interest.
-
Risk management advice. The important trading points of each chart.
-
Information on breakout opportunities. Identify the ones you want to take action on.
-
Video tutorials. How patterns form and why they succeed or fail.
-
Watch list alerts. As they become available so you can act quickly.
-
Breakout alerts. Usually once a week.
-
Access to everything (now and as it becomes available)o Reports
o Videos and video series -
Multi-part webinar course. You learn the 8 most common charting principles.
-
Webinars. Actionable and timely advice on breaking out chart patterns.
For your convenience your membership auto renews each year.


