REVIEW
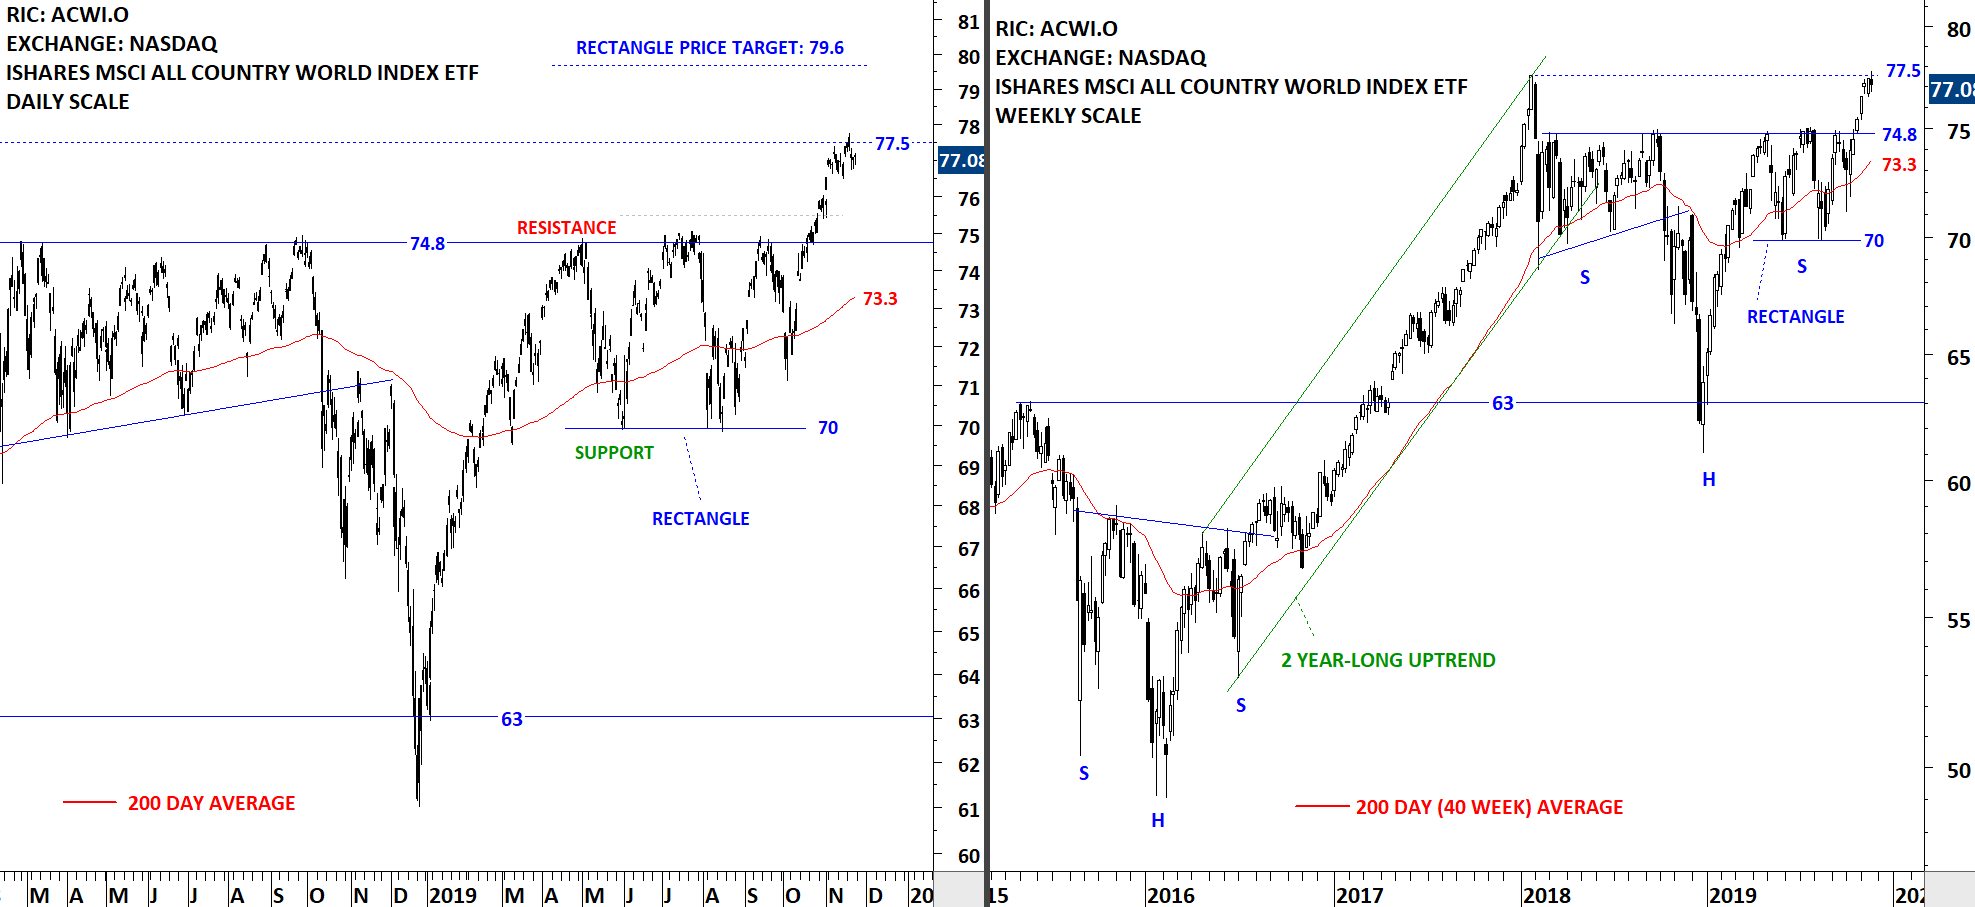
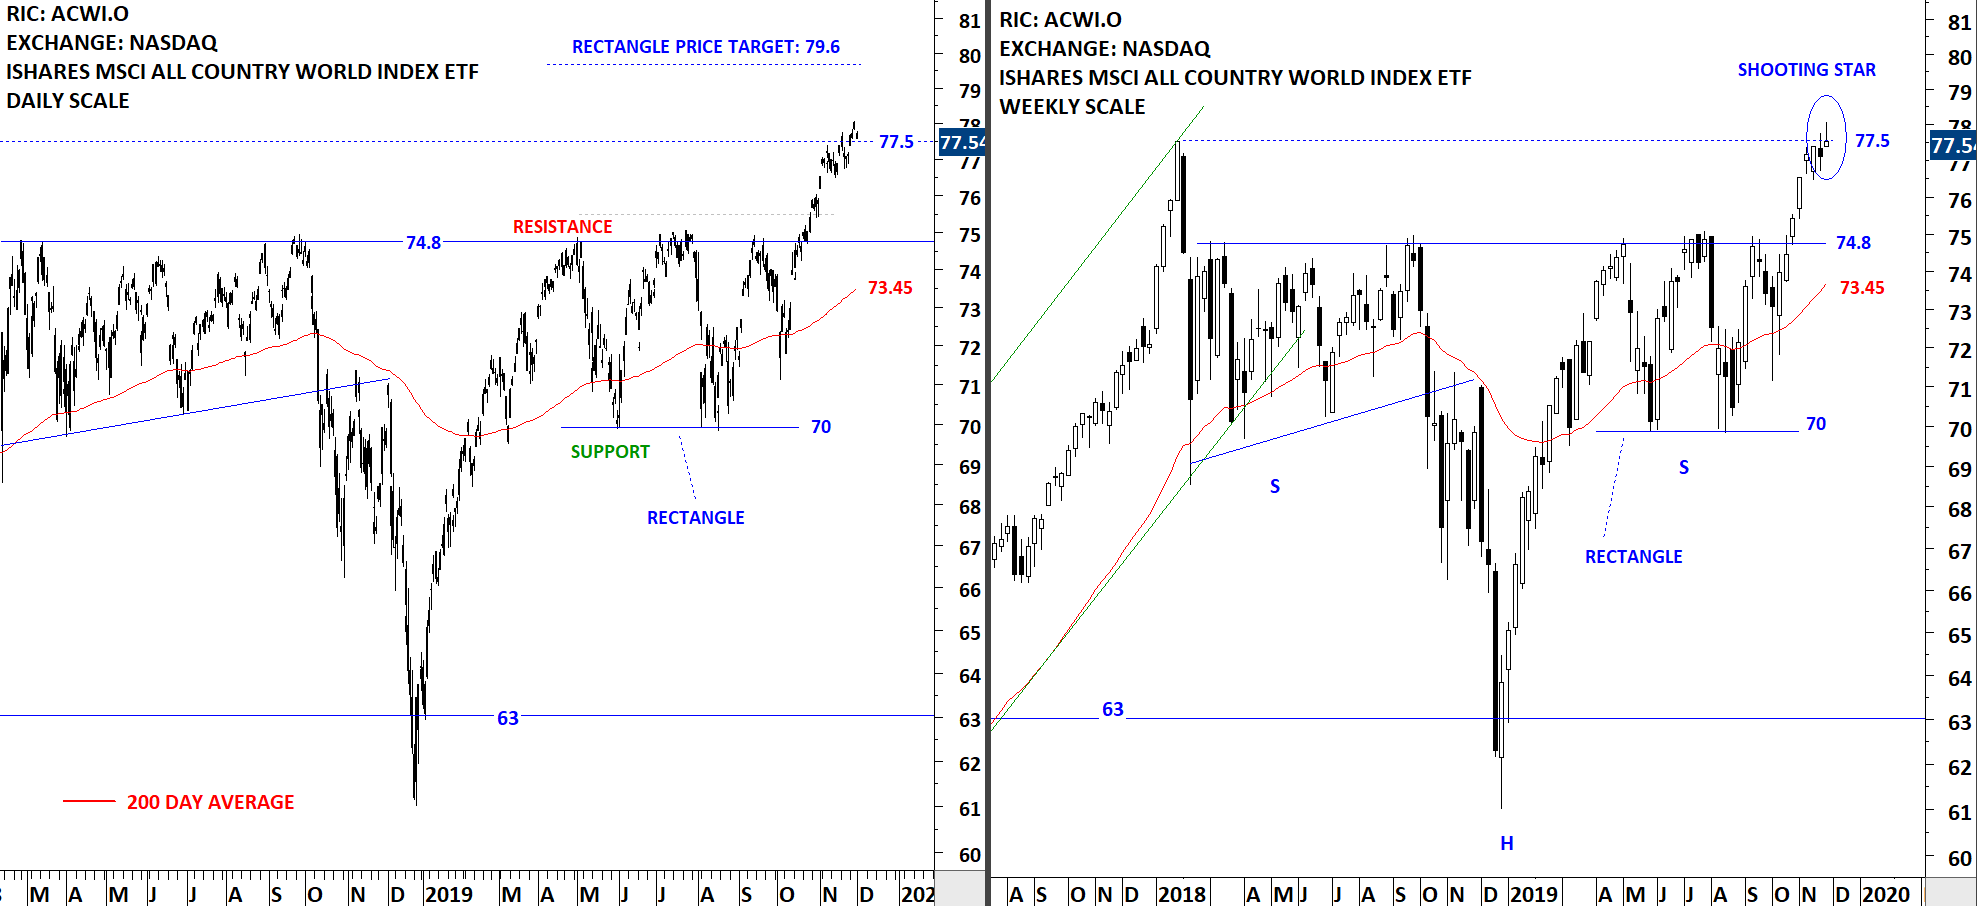
The benchmark for the Global equity markets performance, the iShares MSCI All Country World Index ETF (ACWI.O) found resistance at 77.5 levels. This week's price action formed a shooting star candlestick around the resistance area. The shooting star is common candlestick that indicates the potential for a bearish reversal. This candlestick is characterized by a small body with a long upper wick and a short or nonexistent lower wick. In order to be classified as a shooting star, the upper wick of the candlestick should be at least twice as long as its body. The shooting star candlestick looks very similar to the inverted hammer candlestick. The defining difference is that shooting stars are bearish reversal signals at the top of of uptrends, while inverted hammers are bullish reversal signals at the bottom of downtrends.
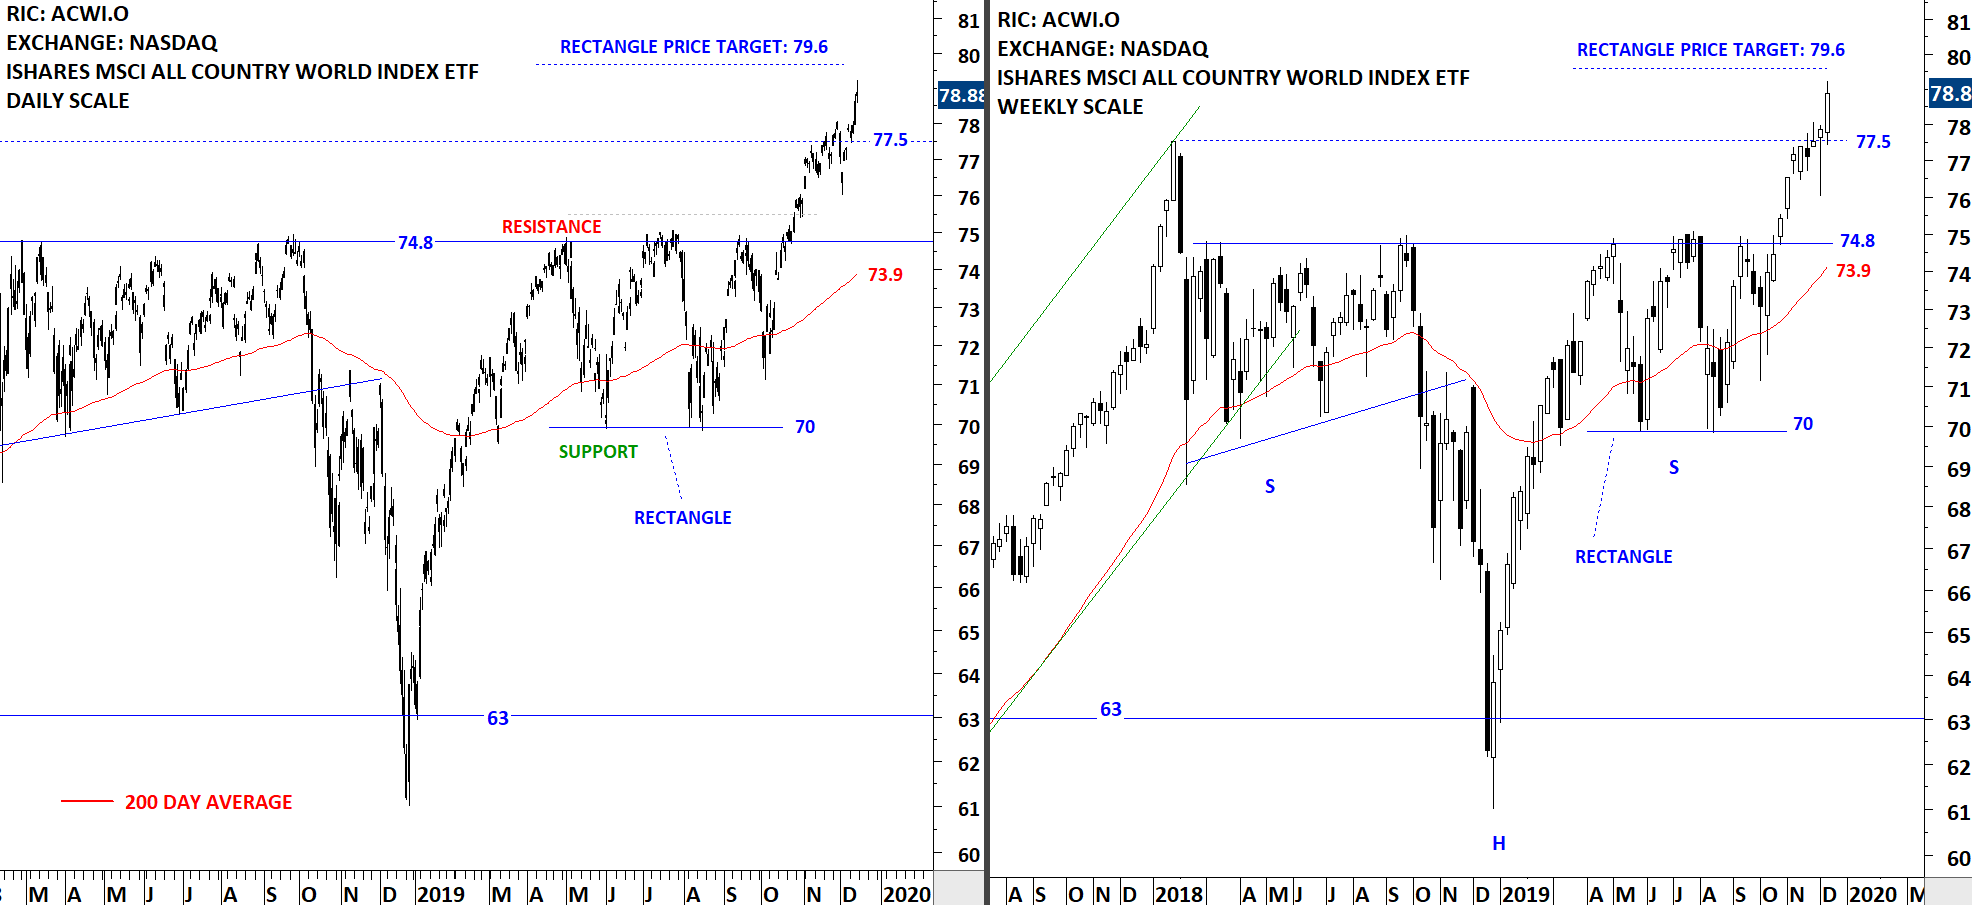
The 5 month-long rectangle price target stands at 79.6 levels. Breakout above the minor resistance can push the ETF towards the price target at 79.6. Both the daily and weekly price charts show a steady uptrend. Unless we see a strong breakout above this week's high, ACWI ETF can trade between 74.8 and 77.5 levels in the following weeks.
 Read More
 Read More