Posts

GLOBAL EQUITY MARKETS – May 27, 2017

Dear Tech Charts members,

Thank you for joining Tech Charts as Founding Member. I hope to identify many great chart set-ups, trading & investment themes and add value to your decision making process in the years ahead. This week's Global Equity Markets report covers several ETFs from different regions, single stocks from Developed and Emerging countries and equity indices. You will find that some of the themes are longer-term and can offer great opportunity once these chart patterns are resolved on the upside. In this report I also added a section that explains what each label on the charts and section headers stand for. I hope this will make it easier to navigate through the charts.

  Read More

GLOBAL EQUITY MARKETS – May 13, 2017

Reminder:  Just one week left until our Founding Member launch on May 22nd!


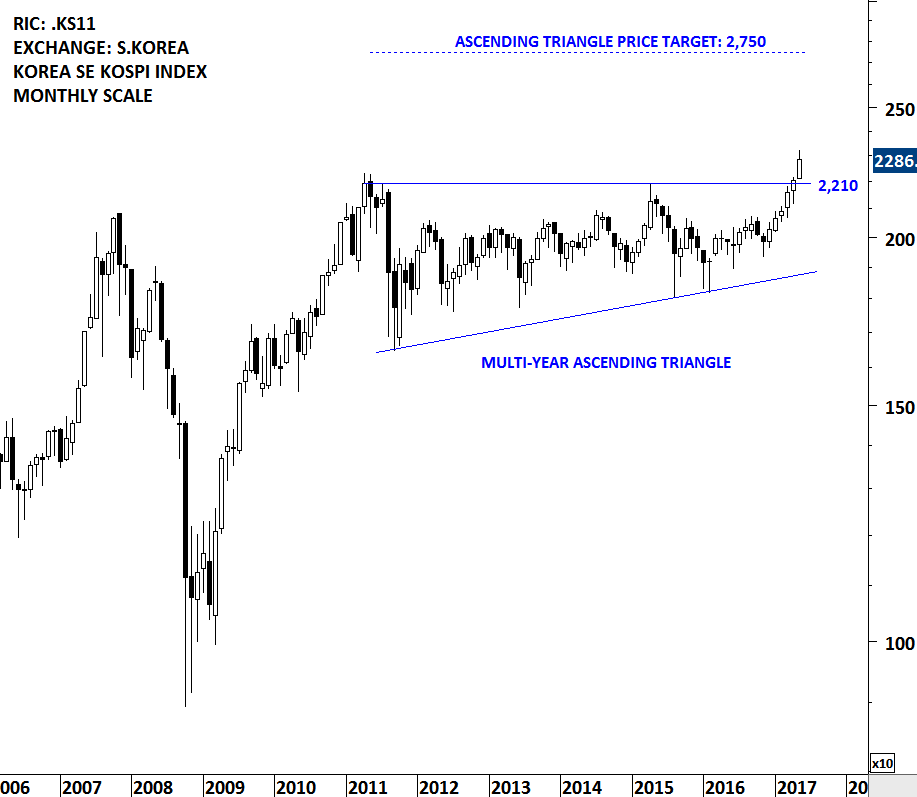
It has been a strong week for equities in emerging Asia and also a strong start for the month of May. South Korea KOSPI index is breaking out to all-time highs by clearing its 6 year-long horizontal resistance at 2,210 levels. The index possibly formed a multi-year long bullish ascending triangle. A strong monthly close will signal positive performance for the coming months. The ascending triangle chart pattern price target stands at 2,750 levels. Emerging Asia is a big component in the MSCI Emerging Markets index. As of May 11, 2017 the top 3 counties in the index are China (26.92%), S.Korea (15.34%) and Taiwan (12.20%).

While the local currency stock market index South Korea KOSPI is breaking out to all-time highs, the U.S. Dollar denominated MSCI S.KOREA price index is few percentage points away from reaching new all-time high levels. The price action is clearly positive. The 9 year-long downward sloping trend line is standing at 460 levels. MSCI S.KOREA index is trying to break out of its multi-year sideways consolidation range.

Read More

GLOBAL EQUITY MARKETS – May 13, 2017


It has been a strong week for equities in emerging Asia and also a strong start for the month of May. South Korea KOSPI index is breaking out to all-time highs by clearing its 6 year-long horizontal resistance at 2,210 levels. The index possibly formed a multi-year long bullish ascending triangle. A strong monthly close will signal positive performance for the coming months. The ascending triangle chart pattern price target stands at 2,750 levels. Emerging Asia is a big component in the MSCI Emerging Markets index. As of May 11, 2017 the top 3 counties in the index are China (26.92%), S.Korea (15.34%) and Taiwan (12.20%).

While the local currency stock market index South Korea KOSPI is breaking out to all-time highs, the U.S. Dollar denominated MSCI S.KOREA price index is few percentage points away from reaching new all-time high levels. The price action is clearly positive. The 9 year-long downward sloping trend line is standing at 460 levels. MSCI S.KOREA index is trying to break out of its multi-year sideways consolidation range.

Read More